New Haven, VT (Vermont) Houses and Residents
| New Haven: | $384,948 |
| Vermont: | $304,700 |
Total population: 1,727 (Urban population: 0, Rural population: 1,666 (120 farm, 1,546 nonfarm))
Houses: 646 (613 occupied: 494 owner occupied, 119 renter occupied)
| % of renters here: | 19% |
| State: | 26% |
Housing density: 16 houses/condos per square mile
Median price asked for vacant for-sale houses and condos in 2022 in this county: $228,979.
Median contract rent in 2022: $1,067 (lower quartile is $881, upper quartile is $1,292)
Median rent asked for vacant for-rent units in 2022: $816
Median gross rent in New Haven, VT in 2022: $1,181
Housing units in New Haven with a mortgage: 112 (6 second mortgage, 33 home equity loan, 0 both second mortgage and home equity loan)
Houses without a mortgage: 65


 | One Week in New England ( Starting from Vermont) Suggestions? (10 replies) |
| Heroin? (115 replies) |
| Vermont Rail Ideas (125 replies) |
| Yep, the Vermont I grew up in is dead. (35 replies) |
| Vermont Made Beers-Here's Your Thread :) (526 replies) |
| Trader Joe's, Whole Foods, French Bakeries and IKEA (43 replies) |

Household type by relationship:
Households: 33,969- In family households: 27,795 (6,422 male householders, 2,918 female householders)
7,510 spouses, 8,926 children (8,175 natural, 336 adopted, 415 stepchildren), 378 grandchildren, 176 brothers or sisters, 192 parents, foster children, 179 other relatives, 914 non-relatives
- In nonfamily households: 6,174 (2,298 male householders (1,677 living alone)), 2,446 female householders (1,912 living alone)), 1,430 nonrelatives
- In group quarters: 2,852 (163 institutionalized population)
6,630 married couples with children.
1,679 single-parent households (533 men, 1,146 women).
96.8% of residents of New Haven speak English at home.
1.4% of residents speak Spanish at home (41% speak English very well, 18% speak English well, 41% speak English not well).
1.8% of residents speak other Indo-European language at home (57% speak English very well, 43% speak English well).
Foreign born population: 36 (1.9%)
(83.3% of them are naturalized citizens)
| Here: | 6.4 |
| State: | 6.4 |
| Here: | 4.3 |
| State: | 3.9 |

- Bedrooms in owner-occupied houses and condos in New Haven, Vermont
- 0no bedroom
- 71 bedroom
- 1142 bedrooms
- 2423 bedrooms
- 1024 bedrooms
- 295+ bedrooms

- Bedrooms in renter-occupied apartments in New Haven, Vermont
- 2no bedroom
- 331 bedroom
- 432 bedrooms
- 213 bedrooms
- 114 bedrooms
- 95+ bedrooms

- Cars and other vehicles available in New Haven in owner-occupied houses/condos
- 10no vehicle
- 1021 vehicle
- 2592 vehicles
- 823 vehicles
- 344 vehicles
- 75+ vehicles

- Cars and other vehicles available in New Haven in renter-occupied apartments
- 4no vehicle
- 391 vehicle
- 632 vehicles
- 43 vehicles
- 74 vehicles
- 25+ vehicles

- Rooms in owner-occupied houses in New Haven, Vermont
- 01 room
- 22 rooms
- 183 rooms
- 454 rooms
- 835 rooms
- 1306 rooms
- 937 rooms
- 698 rooms
- 549+ rooms

- Rooms in renter-occupied apartments in New Haven, Vermont
- 21 room
- 92 rooms
- 193 rooms
- 384 rooms
- 175 rooms
- 76 rooms
- 97 rooms
- 58 rooms
- 139+ rooms


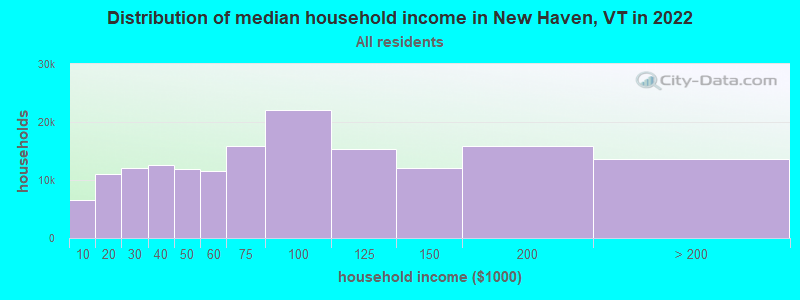
New Haven, VT household income distribution

- 5,793Less than $10,000
- 11,828$10,000 to $19,999
- 13,580$20,000 to $29,999
- 15,806$30,000 to $39,999
- 14,659$40,000 to $49,999
- 14,285$50,000 to $59,999
- 19,013$60,000 to $74,999
- 28,778$75,000 to $99,999
- 19,057$100,000 to $124,999
- 15,214$125,000 to $149,999
- 19,320$150,000 to $199,999
- 17,451$200,000 or more
Percentage of workers working in this county: 77.5%
Number of people working at home: 171 (17.3% of all workers)
Travel time to work (commute)
- Less than 5 minutes: 41
- 5 to 9 minutes: 78
- 10 to 14 minutes: 215
- 15 to 19 minutes: 162
- 20 to 24 minutes: 66
- 25 to 29 minutes: 20
- 30 to 34 minutes: 67
- 35 to 39 minutes: 25
- 40 to 44 minutes: 22
- 45 to 59 minutes: 74
- 60 to 89 minutes: 41
- 90 or more minutes: 8
Means of transportation to work:
- Drove a car alone: 683 (75.3%)
- Carpooled: 99 (10.9%)
- Motorcycle: 2 (0.2%)
- Walked: 26 (2.9%)
- Other means: 9 (1.0%)
- Worked at home: 88 (9.7%)


- Year of entry for the foreign-born population in New Haven, Vermont
- 61995 to March 2000
- 11990 to 1994
- 21985 to 1989
- 71980 to 1984
- 01975 to 1979
- 31970 to 1974
- 31965 to 1969
- 11Before 1965

First ancestries reported:
- English: 319 (16.2%)
- French Canadian: 311 (15.8%)
- Irish: 238 (12.1%)
- French: 222 (11.3%)
- United States: 170 (8.7%)
- German: 166 (8.5%)
- Other: 140 (7.1%)
- Swedish: 67 (3.4%)
- Italian: 65 (3.3%)
- Scottish: 59 (3.0%)
- Polish: 30 (1.5%)
- Russian: 26 (1.3%)
- Scotch-Irish: 26 (1.3%)
- Welsh: 24 (1.2%)
- Dutch: 19 (1.0%)
- Portuguese: 13 (0.7%)
- Czech: 11 (0.6%)
- Hungarian: 11 (0.6%)
- Danish: 10 (0.5%)
- Arab: 9 (0.5%)
- Slovak: 9 (0.5%)
- Norwegian: 6 (0.3%)
- Ukrainian: 5 (0.3%)
- Greek: 3 (0.2%)
- Swiss: 3 (0.2%)
- Lithuanian: 2 (0.1%)
Most common places of birth for foreign-born residents (%):
| New Haven: | 42.4% (14) |
| Vermont: | 34.0% (7,912) |
| New Haven: | 24.2% (8) |
| Vermont: | 7.5% (1,744) |
| New Haven: | 9.1% (3) |
| Vermont: | 1.2% (268) |
| New Haven: | 9.1% (3) |
| Vermont: | 7.2% (1,669) |
| New Haven: | 9.1% (3) |
| Vermont: | 0.6% (144) |
| New Haven: | 6.1% (2) |
| Vermont: | 0.1% (20) |
Place of birth for U.S.-born residents:
- This state: 1,127
- Other state: 490
- Northeast: 365
- Midwest: 45
- South: 36
- West: 44
67% of New Haven residents lived in the same house 5 years ago.
Out of people who lived in different houses, 71% lived in this county.
Out of people who lived in different counties, 32% lived in Vermont.
Education attainment for males 25 years and older:
- No schooling: 11
- Nursery to 4th grade: 2
- 5th and 6th grade: 16
- 7th and 8th grade: 30
- 9th grade: 15
- 10th grade: 4
- 11th grade: 3
- 12th grade, no diploma: 14
- High school graduate (or equivalency): 231
- Less than 1 year of college: 8
- Some college more than 1 year, no degree: 54
- Associate degree: 47
- Bachelor's degree: 78
- Master's degree: 31
- Professional school degree: 7
- Doctorate degree: 15

Education attainment for females 25 years and older:
- No schooling: 0
- Nursery to 4th grade: 4
- 5th and 6th grade: 2
- 7th and 8th grade: 15
- 9th grade: 8
- 10th grade: 6
- 11th grade: 7
- 12th grade, no diploma: 8
- High school graduate (or equivalency): 185
- Less than 1 year of college: 26
- Some college more than 1 year, no degree: 54
- Associate degree: 50
- Bachelor's degree: 101
- Master's degree: 46
- Professional school degree: 16
- Doctorate degree: 7


Housing units in structures:
- One, detached: 514
- One, attached: 14
- Two: 36
- 3 or 4: 18
- 5 to 9: 17
- Mobile homes: 47
Median worth of mobile homes: $157,722
Housing units lacking complete kitchen facilities: 0.6%

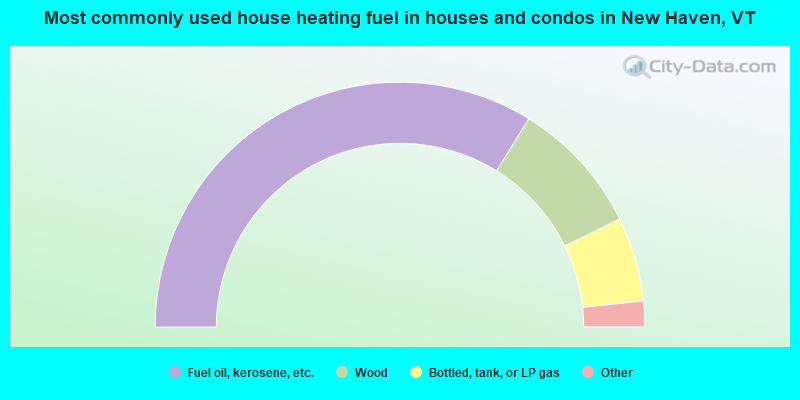
- 67.6%Fuel oil, kerosene, etc.
- 17.8%Wood
- 11.1%Bottled, tank, or LP gas
- 1.2%Electricity
- 0.8%Coal or coke
- 0.8%Solar energy
- 0.4%Utility gas
- 0.2%Other fuel
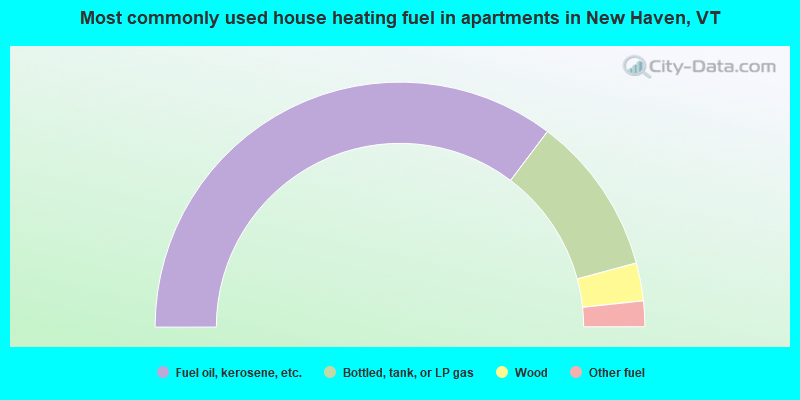
- 70.6%Fuel oil, kerosene, etc.
- 21.0%Bottled, tank, or LP gas
- 5.0%Wood
- 3.4%Other fuel
Private vs. public school enrollment:
| Here: | 13.7% |
| Vermont: | 7.2% |
| Here: | 4.5% |
| Vermont: | 10.4% |
| Here: | 28.9% |
| Vermont: | 37.7% |


