New Hope, PA (Pennsylvania) Houses and Residents
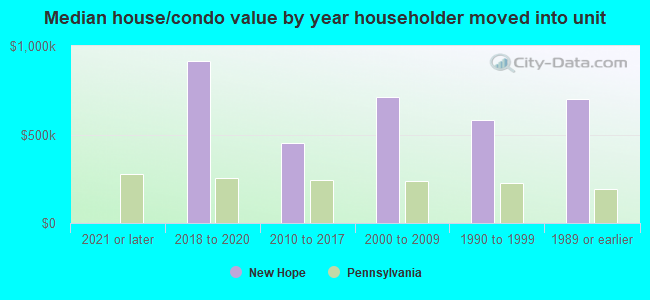
| New Hope: | $644,058 |
| Pennsylvania: | $245,500 |
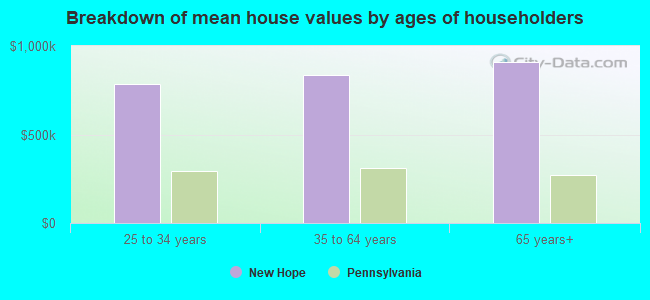
Mean price in 2022:
Detached houses: $1,854,620
Here: $1,854,620 State: $317,202 Townhouses or other attached units: $700,743
Here: $700,743 State: $254,369 In 2-unit structures: $1,245,011
Here: $1,245,011 State: $249,182 In 5-or-more-unit structures: $593,938
Here: $593,938 State: $320,068
Total population: 2,508 (Urban population: 2,252 (all inside urban clusters), Rural population: 0)
Houses: 1,492 (1,364 occupied: 860 owner occupied, 517 renter occupied)
| % of renters here: | 38% |
| State: | 31% |
Housing density: 1,173 houses/condos per square mile
Median price asked for vacant for-sale houses and condos in 2022: $1,189,528.
Median contract rent in 2022: $1,684 (lower quartile is $719, upper quartile is over $2,000)
Median rent asked for vacant for-rent units in 2022: $343
Median gross rent in New Hope, PA in 2022: $1,752
Housing units in New Hope with a mortgage: 351 (46 second mortgage, 0 home equity loan, 33 both second mortgage and home equity loan)
Houses without a mortgage: 18
Median household income for houses/condos with a mortgage: $211,729
Median household income for apartments without a mortgage: $248,132
Median monthly housing costs: $1,574
Compare current foreclosures near New Hope, PA:
| Photo | Address | Area | Beds / Baths | Price | Details |
|---|---|---|---|---|---|

|
#1
Solebury Mountain Rd
New Hope, PA 18938
|
2,452 sq. feet
|
3 baths 3 beds |
show details | |

|
#2
Darien
New Hope, PA 18938
|
1,768 sq. feet
|
3 baths 2 beds |
show details | |

|
#3
Paddock Dr
New Hope, PA 18938
|
5,278 sq. feet
|
6 baths 5 beds |
show details | |

|
#4
River Rd
New Hope, PA 18938
|
1,707 sq. feet
|
1 baths 4 beds |
show details | |

|
#5
Weymouth Ct # 55
New Hope, PA 18938
|
2,052 sq. feet
|
3 baths 2 beds |
show details | |

|
#6
Durham Rd
New Hope, PA 18938
|
6,428 sq. feet
|
3 baths 5 beds |
show details | |

|
#7
New St
New Hope, PA 18938
|
1,347 sq. feet
|
2 baths 2 beds |
show details | |

|
#8
Atkinson Rd
New Hope, PA 18938
|
- sq. feet
|
7 baths 5 beds |
show details | |

|
#9
Lurgan Rd
New Hope, PA 18938
|
2,678 sq. feet
|
2 baths 2 beds |
show details | |

|
#10
Lenape Dr
New Hope, PA 18938
|
4,986 sq. feet
|
2 baths 3 beds |
show details |
| Photo | Address | Area | Beds / Baths | Price | Details |
|---|---|---|---|---|---|

|
#11
Fox Tail Ct
New Hope, PA 18938
|
5,370 sq. feet
|
3 baths 4 beds |
show details | |

|
#12
Ingham Way
New Hope, PA 18938
|
1,604 sq. feet
|
2 baths 2 beds |
show details | |

|
#13
N Sugan Rd Apt 120
New Hope, PA 18938
|
- sq. feet
|
- baths - beds |
show details | |

|
#14
Atkinson Rd
New Hope, PA 18938
|
- sq. feet
|
- baths - beds |
show details | |

|
#15
Tahoe
New Hope, PA 18938
|
- sq. feet
|
- baths - beds |
show details | |

|
#16
Elder Ct
New Hope, PA 18938
|
- sq. feet
|
- baths - beds |
show details | |

|
#17
Moore Ct
Pennington, NJ 08534
|
940 sq. feet
|
1 baths 2 beds |
$195,993
|
show details |

|
#18
Brunswick Ave
Trenton, NJ 08618
|
1,088 sq. feet
|
1 baths 2 beds |
$68,500
|
show details |

|
#19
E Howell St
Trenton, NJ 08610
|
1,272 sq. feet
|
1 baths 3 beds |
$374,500
|
show details |

|
#20
Gallmeier Rd
Frenchtown, NJ 08825
|
1,352 sq. feet
|
3 baths 3 beds |
$439,900
|
show details |
| Photo | Address | Area | Beds / Baths | Price | Details |
|---|---|---|---|---|---|

|
#21
River Rd
New Hope, PA 18938
|
- sq. feet
|
- baths - beds |
show details | |

|
#22
Runnemede
New Hope, PA 18938
|
- sq. feet
|
- baths - beds |
show details | |

|
#23
Manor Rd
Hatboro, PA 19040
|
1,682 sq. feet
|
1 baths 3 beds |
$329,395
|
show details |

|
#24
N Harrison St
Princeton, NJ 08540
|
2,572 sq. feet
|
2 baths 2 beds |
show details | |

|
#25
Claymont Ave
Langhorne, PA 19047
|
1,510 sq. feet
|
2 baths 3 beds |
show details | |

|
#26
Peachtree Ln
Levittown, PA 19054
|
1,000 sq. feet
|
1 baths 2 beds |
show details | |

|
#27
Greenwoods Dr
Horsham, PA 19044
|
1,646 sq. feet
|
3 baths 3 beds |
show details | |

|
#28
Idlewild Rd
Levittown, PA 19057
|
1,000 sq. feet
|
2 baths 2 beds |
show details | |

|
#29
Chestnut Dr
Richboro, PA 18954
|
1,734 sq. feet
|
2 baths 3 beds |
show details | |

|
#30
Bustleton Pike
Feasterville Trevose, PA 19053
|
1,644 sq. feet
|
2 baths 3 beds |
show details |
| Photo | Address | Area | Beds / Baths | Price | Details |
|---|---|---|---|---|---|

|
#31
Jacksonville Rd
Warminster, PA 18974
|
1,624 sq. feet
|
1 baths 2 beds |
show details | |

|
#32
Middle Holland Rd
Southampton, PA 18966
|
2,216 sq. feet
|
1 baths 3 beds |
show details | |

|
#33
Heron Rd
Southampton, PA 18966
|
2,300 sq. feet
|
1 baths 3 beds |
show details | |

|
#34
Sugarmaple Ln
Levittown, PA 19055
|
1,384 sq. feet
|
2 baths 4 beds |
show details | |

|
#35
Glenwood Ln
Levittown, PA 19055
|
1,780 sq. feet
|
2 baths 3 beds |
show details | |

|
#36
Phillips Ave
Feasterville Trevose, PA 19053
|
1,340 sq. feet
|
1 baths 2 beds |
show details | |

|
#37
Heron Rd
Southampton, PA 18966
|
1,600 sq. feet
|
1 baths 3 beds |
show details | |

|
#38
Stanford Rd
Fairless Hills, PA 19030
|
1,999 sq. feet
|
3 baths 4 beds |
show details | |

|
#39
Walker Ave
Langhorne, PA 19047
|
1,499 sq. feet
|
1 baths 3 beds |
show details | |

|
#40
Peachtree Ln
Levittown, PA 19054
|
1,000 sq. feet
|
1 baths 2 beds |
show details |
| Photo | Address | Area | Beds / Baths | Price | Details |
|---|---|---|---|---|---|

|
#41
Falcon Rd
Levittown, PA 19056
|
2,289 sq. feet
|
2 baths 3 beds |
show details | |

|
#42
Countryside Dr
Doylestown, PA 18901
|
2,920 sq. feet
|
3 baths 4 beds |
show details | |

|
#43
Oval Turn Ln
Levittown, PA 19055
|
1,564 sq. feet
|
1 baths 2 beds |
show details | |

|
#44
E Village Rd
Southampton, PA 18966
|
1,215 sq. feet
|
2 baths 2 beds |
show details | |

|
#45
Sunburry Ct
Southampton, PA 18966
|
1,215 sq. feet
|
1 baths 2 beds |
show details | |

|
#46
Crescent Rd
Hatboro, PA 19040
|
1,451 sq. feet
|
1 baths 3 beds |
show details | |

|
#47
Van Horn Pl
Southampton, PA 18966
|
1,063 sq. feet
|
2 baths 2 beds |
show details | |

|
#48
Jason Dr
Southampton, PA 18966
|
1,912 sq. feet
|
3 baths 3 beds |
show details | |

|
#49
Clearview Ave
Feasterville Trevose, PA 19053
|
1,485 sq. feet
|
2 baths 3 beds |
show details | |

|
Check over 1 million property listings on Foreclosure.com!
|
browse all offers | |||


 | New Hope - condos/townhomes (1 reply) |
| Bucks County PA Townhomes and Condo communities (3 replies) |
| Opinions on current shopping in New Hope (6 replies) |
| Which metro area to move to in PA? (51 replies) |
| PA Location: Rental Houses, Woods, Many Jobs? (3 replies) |
| Retirement Move from Newton, MA to PA (Philly Suburbs) (73 replies) |

Median year apartment built: 1987
Household type by relationship:
Households: 2,623- Male householders: 639 (328 living alone), Female householders: 715 (365 living alone)
591 spouses (571 opposite-sex spouses), 65 unmarried partners, (65 opposite-sex unmarried partners), 503 children (437 natural, 21 adopted, 43 stepchildren), 0 grandchildren, 0 brothers or sisters, 96 parents, 0 foster children, 0 other relatives, 8 non-relatives
Size of family households: 336 2-persons, 151 3-persons, 76 4-persons, 27 5-persons, 21 7-or-more-persons.
Size of nonfamily households: 696 1-person, 76 2-persons.
301 married couples with children.
7 single-parent households (0 men, 7 women).
86.3% of residents of New Hope speak English at home.
9.0% of residents speak Spanish at home (28% speak English very well, 60% speak English well, 12% speak English not well).
3.8% of residents speak other Indo-European language at home (46% speak English very well, 49% speak English well, 5% speak English not well).
2.5% of residents speak Asian or Pacific Island language at home (41% speak English very well, 20% speak English well, 39% speak English not well).
1.5% of residents speak other language at home (100% speak English very well).
Foreign born population: 267 (10.2%)
(74.2% of them are naturalized citizens)
| Here: | 6.4 |
| State: | 6.8 |
| Here: | 3.8 |
| State: | 4.3 |
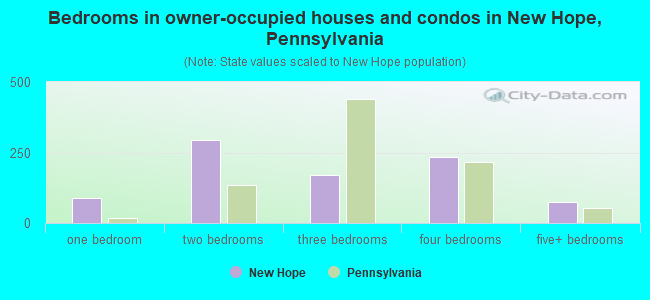
- Bedrooms in owner-occupied houses and condos in New Hope, Pennsylvania
- 0no bedroom
- 891 bedroom
- 2942 bedrooms
- 1693 bedrooms
- 2334 bedrooms
- 765+ bedrooms
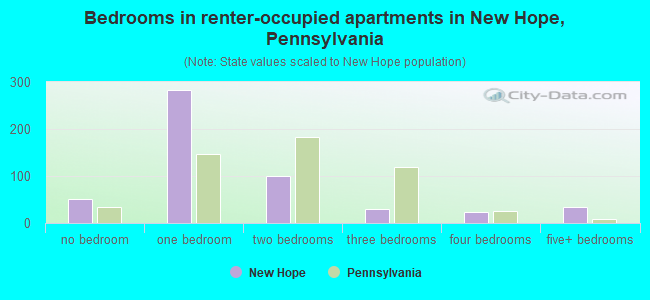
- Bedrooms in renter-occupied apartments in New Hope, Pennsylvania
- 51no bedroom
- 2821 bedroom
- 992 bedrooms
- 293 bedrooms
- 234 bedrooms
- 335+ bedrooms
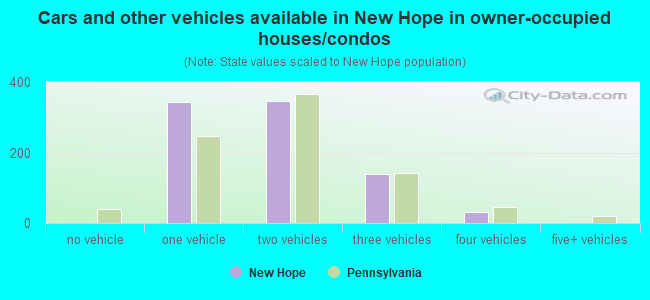
- Cars and other vehicles available in New Hope in owner-occupied houses/condos
- 0no vehicle
- 3441 vehicle
- 3462 vehicles
- 1383 vehicles
- 314 vehicles
- 05+ vehicles
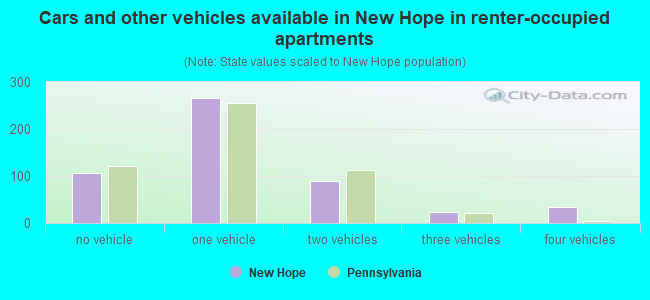
- Cars and other vehicles available in New Hope in renter-occupied apartments
- 107no vehicle
- 2651 vehicle
- 892 vehicles
- 233 vehicles
- 334 vehicles
- 05+ vehicles
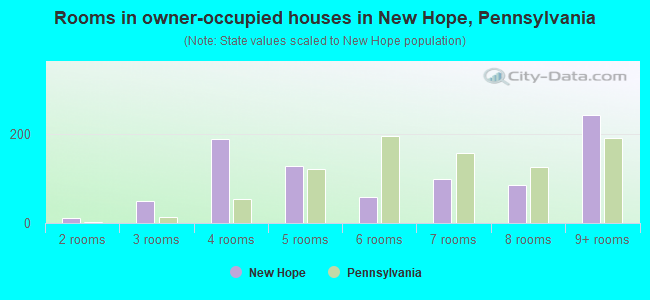
- Rooms in owner-occupied houses in New Hope, Pennsylvania
- 01 room
- 112 rooms
- 493 rooms
- 1884 rooms
- 1275 rooms
- 596 rooms
- 987 rooms
- 868 rooms
- 2439+ rooms
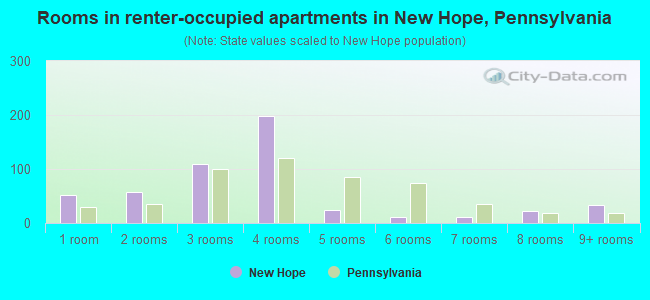
- Rooms in renter-occupied apartments in New Hope, Pennsylvania
- 511 room
- 572 rooms
- 1093 rooms
- 1984 rooms
- 245 rooms
- 116 rooms
- 117 rooms
- 238 rooms
- 339+ rooms
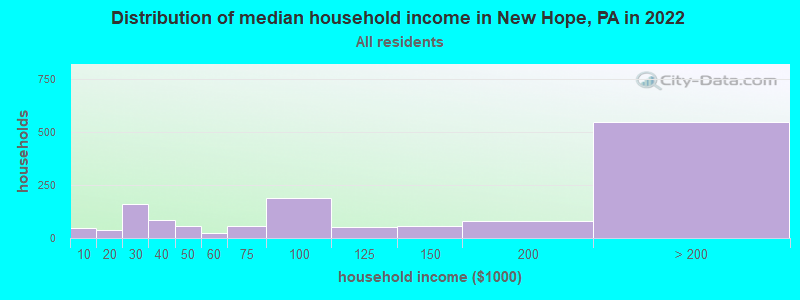
New Hope, PA household income distribution

- 45Less than $10,000
- 37$10,000 to $19,999
- 160$20,000 to $29,999
- 87$30,000 to $39,999
- 58$40,000 to $49,999
- 22$50,000 to $59,999
- 57$60,000 to $74,999
- 189$75,000 to $99,999
- 53$100,000 to $124,999
- 55$125,000 to $149,999
- 79$150,000 to $199,999
- 546$200,000 or more
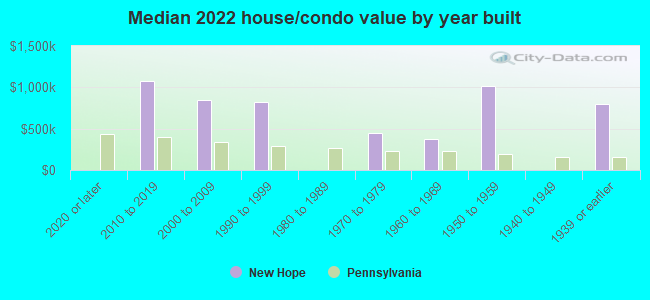
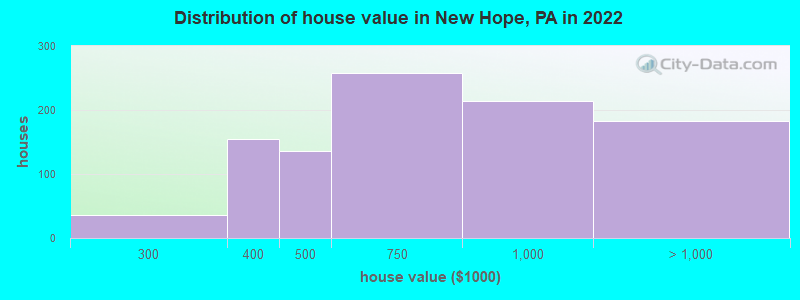
Home value of owner - occupied houses in 2022 in New Hope, PA
-
- 35$250,000 to $299,999
- 155$300,000 to $399,999
- 135$400,000 to $499,999
- 257$500,000 to $749,999
- 213$750,000 to $999,999
- 110$1,000,000 to $1,499,999
- 55$1,500,000 to $1,999,999
- 17$2,000,000 or more
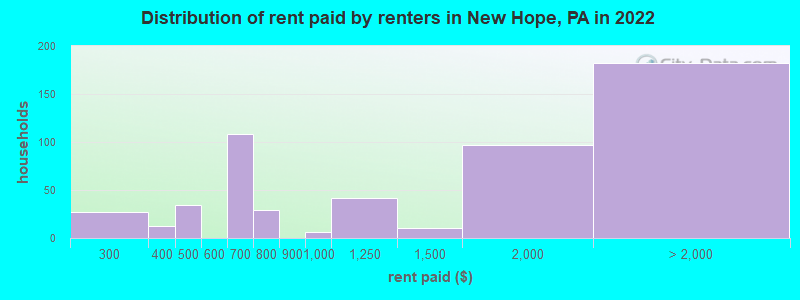
Rent paid by renters in 2022 in New Hope, PA
-
- 26$200 to $249
- 11$300 to $349
- 33$450 to $499
- 108$650 to $699
- 20$700 to $749
- 8$750 to $799
- 6$900 to $999
- 41$1,000 to $1,249
- 9$1,250 to $1,499
- 96$1,500 to $1,999
- 107$2,000 to $2,499
- 35$3,000 to $3,499
- 25$3,500 or more
- 12No cash rent
Percentage of workers working in this county: 68.4%
Number of people working at home: 570 (44.6% of all workers)
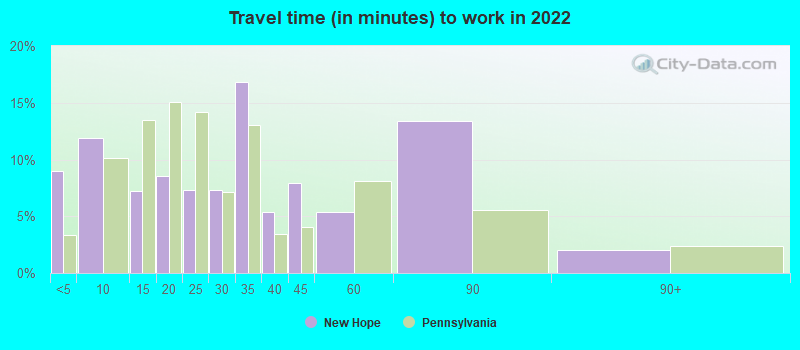
Travel time to work (commute)
- Less than 5 minutes: 80
- 5 to 9 minutes: 40
- 10 to 14 minutes: 9
- 15 to 19 minutes: 46
- 20 to 24 minutes: 110
- 25 to 29 minutes: 47
- 30 to 34 minutes: 133
- 35 to 39 minutes: 41
- 40 to 44 minutes: 10
- 45 to 59 minutes: 103
- 60 to 89 minutes: 97
- 90 or more minutes: 61
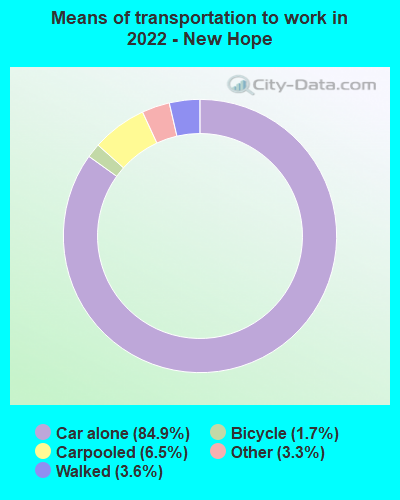
Means of transportation to work:
- Drove a car alone: 1,637 (66.0%)
- Carpooled: 115 (4.6%)
- Taxi: 93 (3.7%)
- Bicycle: 61 (2.5%)
- Walked: 60 (2.4%)
- Worked at home: 570 (23.0%)
- Unemployment by race in 2022
- Unemployment rate for White non-Hispanic residents
- 5.0%Males
- 9.9%Females
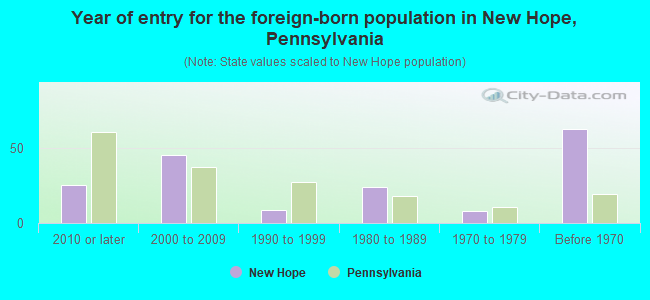
- Year of entry for the foreign-born population in New Hope, Pennsylvania
- 252010 or later
- 452000 to 2009
- 81990 to 1999
- 241980 to 1989
- 81970 to 1979
- 63Before 1970
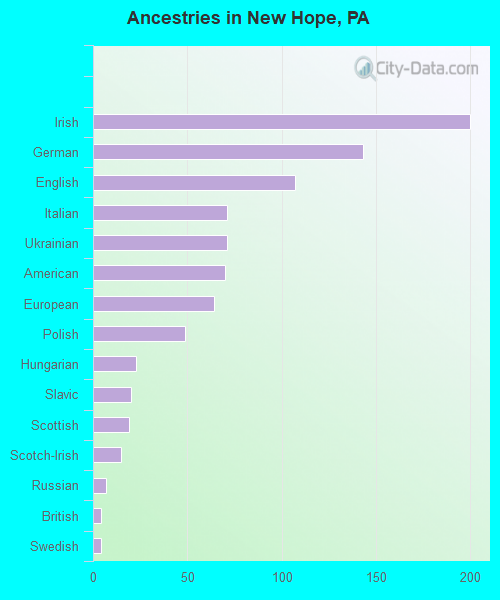
First ancestries reported:
- Irish: 200 (19.0%)
- German: 143 (13.6%)
- English: 107 (10.2%)
- Italian: 71 (6.8%)
- Ukrainian: 71 (6.8%)
- American: 70 (6.7%)
- European: 64 (6.1%)
- Polish: 49 (4.7%)
- Hungarian: 23 (2.2%)
- Slavic: 20 (1.9%)
- Scottish: 19 (1.8%)
- Scotch-Irish: 15 (1.4%)
- Russian: 7 (0.7%)
- British: 4 (0.4%)
- Swedish: 4 (0.4%)
Most common places of birth for foreign-born residents (%):
| New Hope: | 15.2% (41) |
| Pennsylvania: | 0.4% (4,113) |
| New Hope: | 14.9% (40) |
| Pennsylvania: | 2.1% (19,841) |
| New Hope: | 10.8% (29) |
| Pennsylvania: | 3.3% (31,542) |
| New Hope: | 10.8% (29) |
| Pennsylvania: | 1.8% (16,884) |
| New Hope: | 10.0% (27) |
| Pennsylvania: | 0.6% (6,036) |
| New Hope: | 8.9% (24) |
| Pennsylvania: | 1.0% (9,205) |
| New Hope: | 4.8% (13) |
| Pennsylvania: | 10.7% (100,596) |
| New Hope: | 4.8% (13) |
| Pennsylvania: | 1.5% (13,823) |
| New Hope: | 4.8% (13) |
| Pennsylvania: | 0.7% (6,690) |
| New Hope: | 2.6% (7) |
| Pennsylvania: | 0.5% (4,424) |
| New Hope: | 1.9% (5) |
| Pennsylvania: | 1.1% (10,331) |
Place of birth for U.S.-born residents:
- This state: 607
- Other state: 1,779
- Northeast: 1,467
- Midwest: 100
- South: 140
- West: 72
81.7% of New Hope residents lived in the same house 1 years ago.
Out of people who lived in different houses, 7.3% lived in this county.
Out of people who lived in different counties, 6.5% lived in Pennsylvania.
| New Hope: | 81.7% |
| State average: | 89.3% |
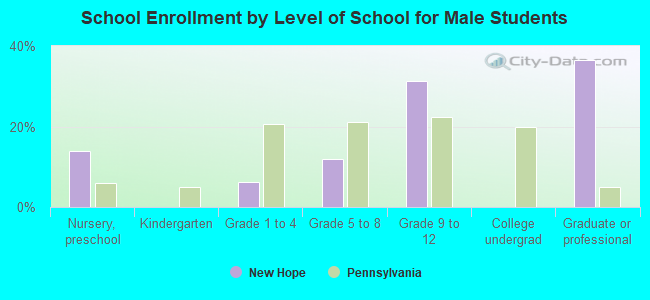
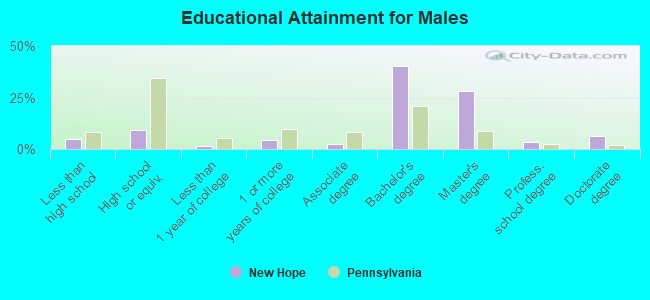
Education attainment for males 25 years and older:
- No schooling: 0
- Nursery to 4th grade: 23
- 5th and 6th grade: 0
- 7th and 8th grade: 0
- 9th grade: 0
- 10th grade: 0
- 11th grade: 0
- 12th grade, no diploma: 31
- High school graduate (or equivalency): 102
- Less than 1 year of college: 15
- Some college more than 1 year, no degree: 46
- Associate degree: 25
- Bachelor's degree: 440
- Master's degree: 308
- Professional school degree: 36
- Doctorate degree: 69
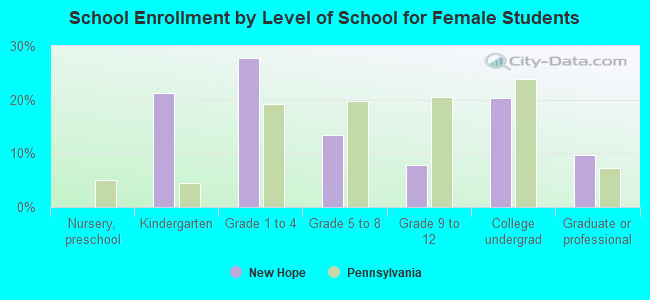
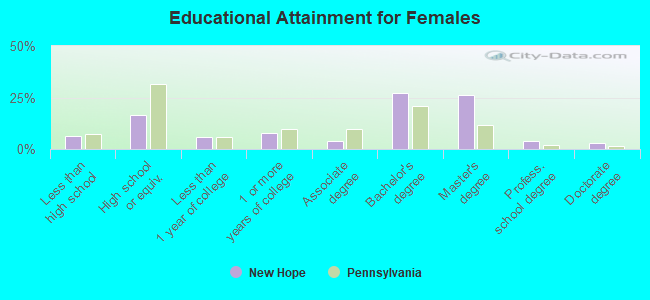
Education attainment for females 25 years and older:
- No schooling: 0
- Nursery to 4th grade: 0
- 5th and 6th grade: 43
- 7th and 8th grade: 23
- 9th grade: 0
- 10th grade: 0
- 11th grade: 0
- 12th grade, no diploma: 0
- High school graduate (or equivalency): 175
- Less than 1 year of college: 63
- Some college more than 1 year, no degree: 83
- Associate degree: 43
- Bachelor's degree: 290
- Master's degree: 281
- Professional school degree: 40
- Doctorate degree: 29


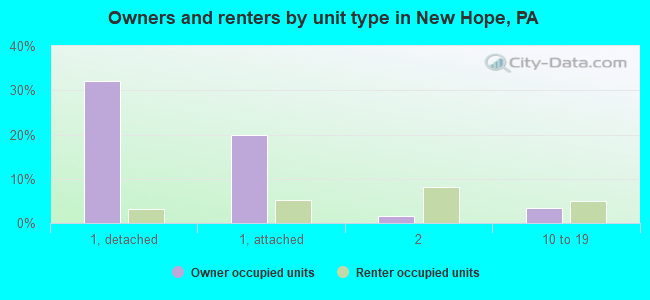
Housing units in structures:
- One, detached: 614
- One, attached: 475
- Two: 84
- 3 or 4: 87
- 10 to 19: 54
- 20 to 49: 29
- 50 or more: 146
Housing units lacking complete kitchen facilities in 2022: 1.2%
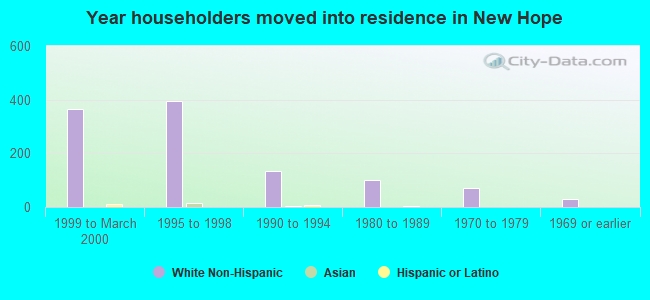
House/condo owner moved in on average 13 years ago
Renter moved in on average 0 years ago
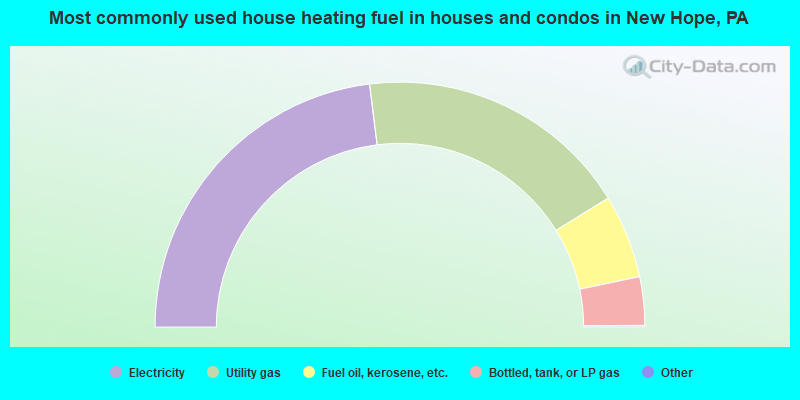
- 46.2%Electricity
- 36.4%Utility gas
- 11.1%Fuel oil, kerosene, etc.
- 6.4%Bottled, tank, or LP gas
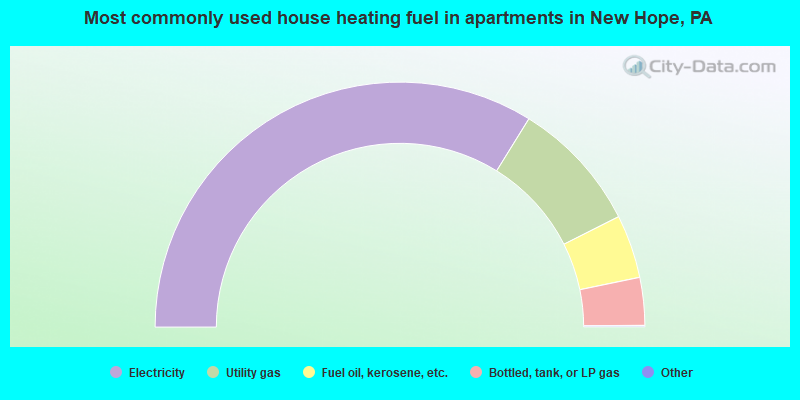
- 67.8%Electricity
- 17.5%Utility gas
- 8.4%Fuel oil, kerosene, etc.
- 6.3%Bottled, tank, or LP gas
Private vs. public school enrollment:
| Here: | 0.0% |
| Pennsylvania: | 15.7% |
| Here: | 17.5% |
| Pennsylvania: | 13.4% |
| Here: | 0.0% |
| Pennsylvania: | 39.8% |