Housing density: 1,783 houses/condos per square mile
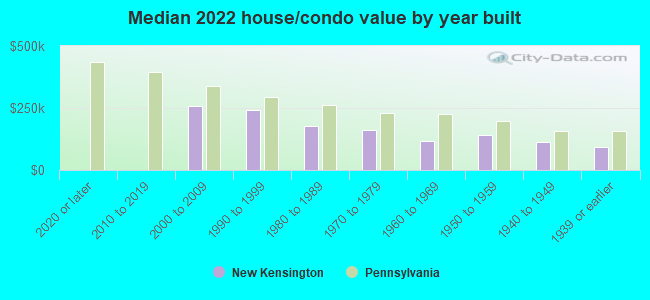
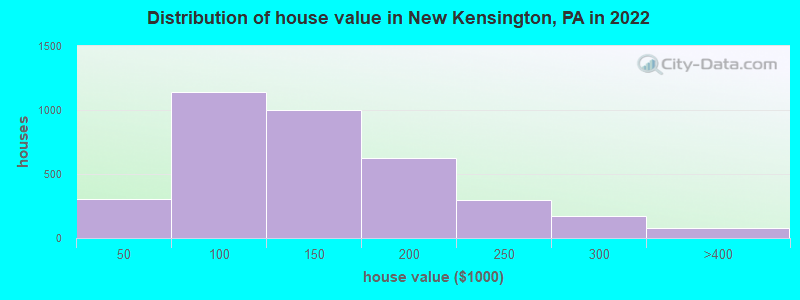
Median price asked for vacant for-sale houses and condos in 2022: $308,083.
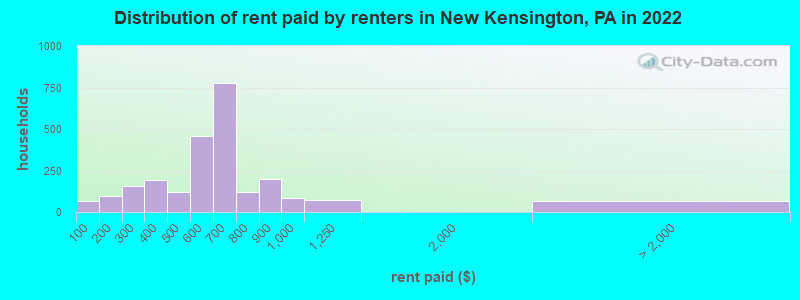
Median contract rent in 2022: $613 (lower quartile is $405, upper quartile is $705)
Median rent asked for vacant for-rent units in 2022: $582
Median gross rent in New Kensington, PA in 2022: $692
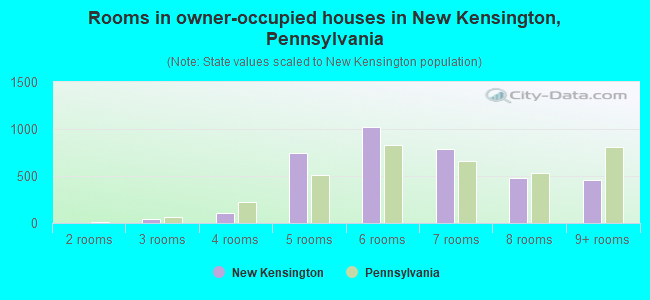
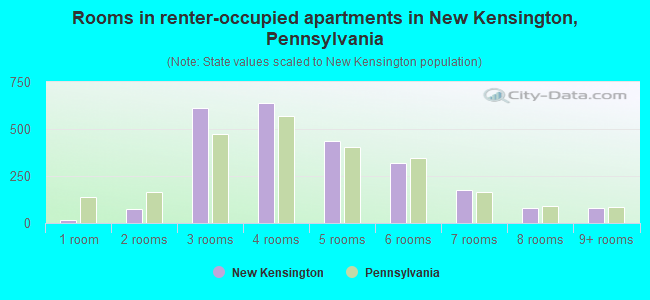
Housing units in New Kensington with a mortgage: 2,091 (195 second mortgage, 30 home equity loan, 170 both second mortgage and home equity loan) Houses without a mortgage: 271
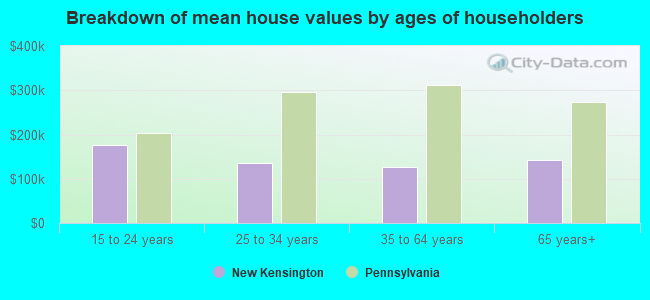
Median household income for houses/condos with a mortgage: $76,186
Median household income for apartments without a mortgage: $59,092
Median monthly housing costs: $775
Compare current foreclosures in New Kensington, PA:
#1
Hill St
New Kensington, PA 15068
1,458
sq. feet
2
baths
3
beds
#2
Deer Dr
New Kensington, PA 15068
2,477
sq. feet
3
baths
4
beds
#3
Leechburg Rd
New Kensington, PA 15068
1,212
sq. feet
1
baths
3
beds
#4
High Ridge Ct
New Kensington, PA 15068
2,504
sq. feet
2
baths
3
beds
#5
Lynn Ann Dr
New Kensington, PA 15068
2,240
sq. feet
2
baths
3
beds
#6
Mcallister Dr
New Kensington, PA 15068
1,734
sq. feet
2
baths
3
beds
#7
Leechburg Rd
New Kensington, PA 15068
1,408
sq. feet
1
baths
3
beds
#8
Ligonier Ct
New Kensington, PA 15068
1,260
sq. feet
2
baths
3
beds
#9
Greensburg Rd
New Kensington, PA 15068
1,320
sq. feet
1
baths
2
beds
#10
Charles Ave
New Kensington, PA 15068
-
sq. feet
1
baths
3
beds
#11
Larchmont Dr
New Kensington, PA 15068
-
sq. feet
-
baths
-
beds
#12
Willow St
New Kensington, PA 15068
-
sq. feet
-
baths
-
beds
#13
Fairhaven Dr
New Kensington, PA 15068
-
sq. feet
-
baths
-
beds
#14
Frederick Dr
New Kensington, PA 15068
-
sq. feet
-
baths
-
beds
#15
Moore St
New Kensington, PA 15068
-
sq. feet
-
baths
-
beds
#16
Cleveland Dr
New Kensington, PA 15068
-
sq. feet
-
baths
-
beds
#17
Kimball Ave
New Kensington, PA 15068
-
sq. feet
-
baths
-
beds
#18
Constitution Blvd
New Kensington, PA 15068
-
sq. feet
-
baths
-
beds
#19
Violet Dr
New Kensington, PA 15068
-
sq. feet
-
baths
-
beds
#20
Greensburg Rd
New Kensington, PA 15068
-
sq. feet
-
baths
-
beds
#21
Strawn Ave
New Kensington, PA 15068
-
sq. feet
-
baths
-
beds
#22
Woodstone Lane, Unit 52 Aka 103 Woodstone Lane, Apartment 52 Aka 103 Woodstone Lane
964 married couples with children.
689 single-parent households (290 men, 399 women).
95.8% of residents of New Kensington speak English at home.
0.9% of residents speak Spanish at home (53% speak English very well, 47% speak English well).
1.0% of residents speak other Indo-European language at home (73% speak English very well, 18% speak English well, 9% speak English not well).
2.0% of residents speak Asian or Pacific Island language at home (50% speak English very well, 9% speak English well, 18% speak English not well, 23% don't speak English at all).
Foreign born population: 255 (2.1%)
(61.6% of them are naturalized citizens)
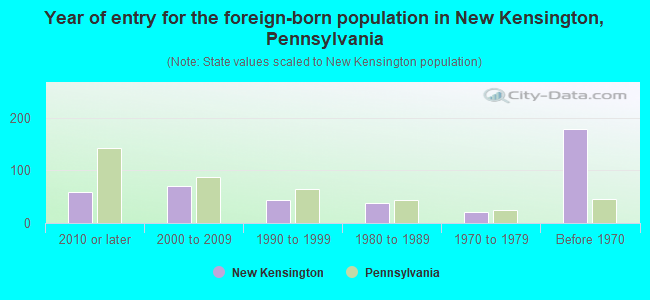
Year of entry for the foreign-born population in New Kensington, Pennsylvania
592010 or later
712000 to 2009
431990 to 1999
381980 to 1989
211970 to 1979
179Before 1970
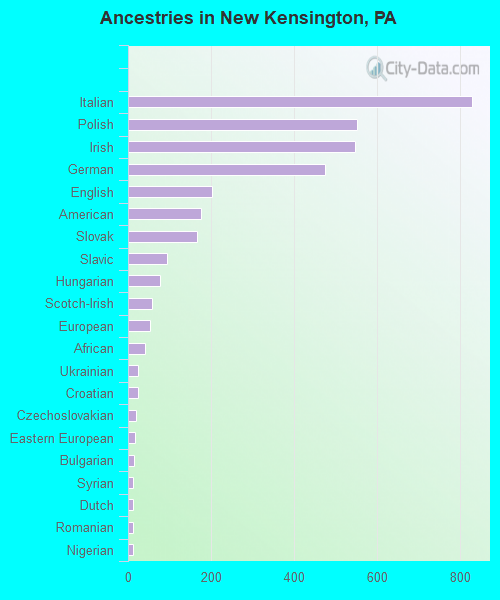
First ancestries reported:
Italian: 828 (17.8%)
Polish: 551 (11.9%)
Irish: 547 (11.8%)
German: 474 (10.2%)
English: 203 (4.4%)
American: 175 (3.8%)
Slovak: 167 (3.6%)
Slavic: 93 (2.0%)
Hungarian: 76 (1.6%)
Scotch-Irish: 58 (1.2%)
European: 53 (1.1%)
African: 41 (0.9%)
Ukrainian: 25 (0.5%)
Croatian: 23 (0.5%)
Czechoslovakian: 20 (0.4%)
Eastern European: 18 (0.4%)
Bulgarian: 14 (0.3%)
Syrian: 11 (0.2%)
Dutch: 11 (0.2%)
Romanian: 11 (0.2%)
Nigerian: 11 (0.2%)
Arab: 7 (0.2%)
Pennsylvania German: 7 (0.2%)
French: 6 (0.1%)
Russian: 6 (0.1%)
Swedish: 5 (0.1%)
Lithuanian: 4 (0.09%)
British: 3 (0.06%)
Most common places of birth for foreign-born residents (%):
China, excluding Hong Kong and Taiwan
New Kensington:
47.9% (115)
Pennsylvania:
7.2% (67,704)
Dominican Republic
New Kensington:
23.8% (57)
Pennsylvania:
9.2% (86,544)
Czechoslovakia (includes Czech Republic and Slovakia)
New Kensington:
6.2% (15)
Pennsylvania:
0.2% (1,916)
Romania
New Kensington:
5.4% (13)
Pennsylvania:
0.6% (5,598)
Germany
New Kensington:
3.8% (9)
Pennsylvania:
1.9% (18,065)
Italy
New Kensington:
3.3% (8)
Pennsylvania:
1.8% (16,884)
Poland
New Kensington:
3.3% (8)
Pennsylvania:
1.3% (12,172)
Russia
New Kensington:
2.9% (7)
Pennsylvania:
1.6% (15,272)
Spain
New Kensington:
2.1% (5)
Pennsylvania:
0.3% (2,635)
Place of birth for U.S.-born residents:
This state: 10,267
Other state: 1,492
Northeast: 427
Midwest: 223
South: 694
West: 158
87.8% of New Kensington residents lived in the same house 1 years ago. Out of people who lived in different houses, 40.9% lived in this county. Out of people who lived in different counties, 89.2% lived in Pennsylvania.
New Kensington:
87.8%
State average:
89.3%
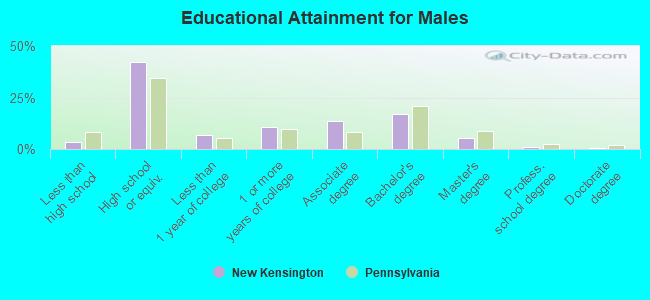
Education attainment for males 25 years and older:
No schooling: 42
Nursery to 4th grade: 1
5th and 6th grade: 0
7th and 8th grade: 7
9th grade: 22
10th grade: 49
11th grade: 6
12th grade, no diploma: 38
High school graduate (or equivalency): 1,943
Less than 1 year of college: 306
Some college more than 1 year, no degree: 492
Associate degree: 614
Bachelor's degree: 783
Master's degree: 235
Professional school degree: 39
Doctorate degree: 12
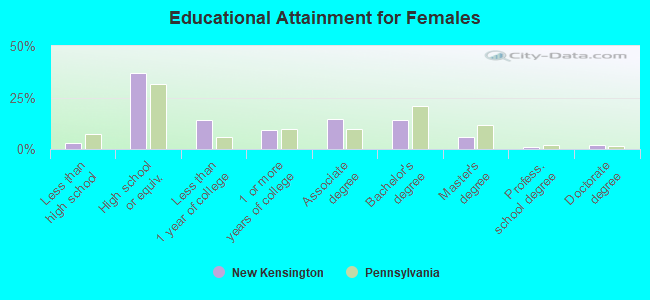
Education attainment for females 25 years and older:
No schooling: 44
Nursery to 4th grade: 7
5th and 6th grade: 0
7th and 8th grade: 8
9th grade: 8
10th grade: 0
11th grade: 34
12th grade, no diploma: 21
High school graduate (or equivalency): 1,626
Less than 1 year of college: 632
Some college more than 1 year, no degree: 407
Associate degree: 655
Bachelor's degree: 615
Master's degree: 262
Professional school degree: 34
Doctorate degree: 77
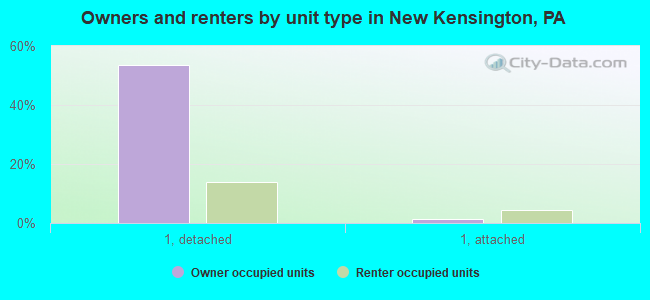
Housing units in structures:
One, detached: 4,607
One, attached: 530
Two: 383
3 or 4: 448
5 to 9: 313
10 to 19: 243
20 to 49: 156
50 or more: 364
Mobile homes: 23
Boats, RVs, vans, etc.: 5
Median worth of mobile homes: $142,326
Housing units lacking complete plumbing facilities in 2022: 4.1%
Housing units lacking complete kitchen facilities in 2022: 6.0%
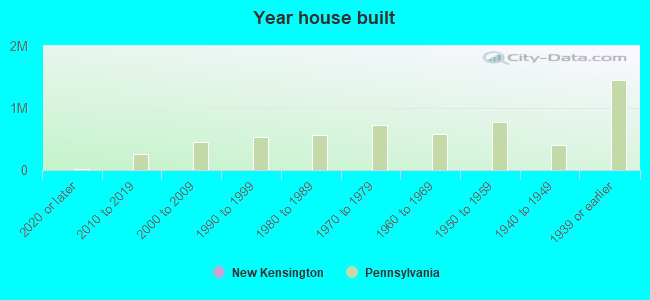
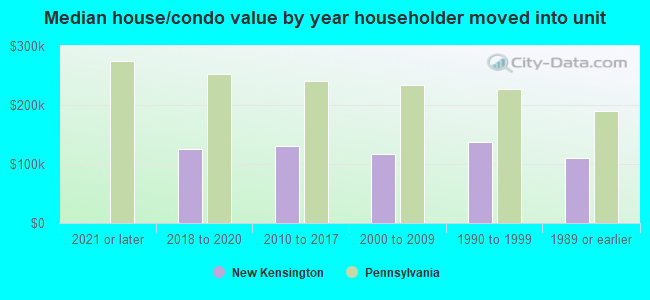
House/condo owner moved in on average 18 years ago