New Milford, PA (Pennsylvania) Houses and Residents
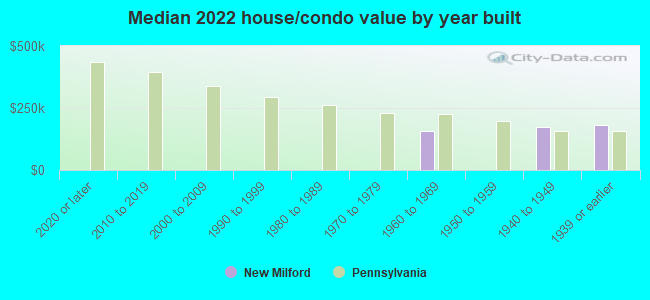
| New Milford: | $167,899 |
| Pennsylvania: | $245,500 |
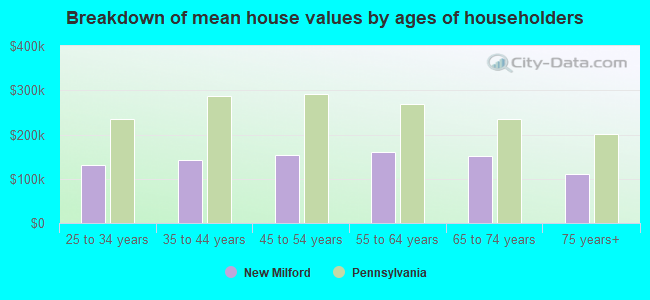
Mean price in 2022:
Detached houses: $198,031
Here: $198,031 State: $317,202 Mobile homes: $23,659
Here: $23,659 State: $92,414
Total population: 873 (Urban population: 784, Rural population: 99 (all nonfarm))
Houses: 358 (291 occupied: 153 owner occupied, 139 renter occupied)
| % of renters here: | 48% |
| State: | 31% |
Housing density: 346 houses/condos per square mile
Median price asked for vacant for-sale houses and condos in 2022: $220,870.
Median contract rent in 2022: $768 (lower quartile is $640, upper quartile is $910)
Median rent asked for vacant for-rent units in 2022: $695
Median gross rent in New Milford, PA in 2022: $922
Housing units in New Milford with a mortgage: 82 (14 second mortgage, 0 home equity loan, 9 both second mortgage and home equity loan)
Houses without a mortgage: 3
Median household income for houses/condos with a mortgage: $87,467
Median household income for apartments without a mortgage: $48,979
Median monthly housing costs: $904
Compare current foreclosures near New Milford, PA:
| Photo | Address | Area | Beds / Baths | Price | Details |
|---|---|---|---|---|---|

|
#1
State Route 492
New Milford, PA 18834
|
- sq. feet
|
- baths - beds |
show details | |

|
#2
Stearns Rd
New Milford, PA 18834
|
- sq. feet
|
- baths - beds |
show details | |

|
#3
Viaduct St
Susquehanna, PA 18847
|
2,200 sq. feet
|
2 baths 4 beds |
$194,500
|
show details |

|
#4
State Route 171
Susquehanna, PA 18847
|
- sq. feet
|
2 baths 3 beds |
show details | |

|
#5
Hand Rd
Binghamton, NY 13903
|
2,354 sq. feet
|
1 baths 3 beds |
show details | |

|
#6
Trim St
Windsor, NY 13865
|
1,470 sq. feet
|
1 baths 2 beds |
show details | |

|
#7
Main St
Windsor, NY 13865
|
1,083 sq. feet
|
1 baths 2 beds |
show details | |

|
#8
Powers Rd
Conklin, NY 13748
|
1,248 sq. feet
|
1 baths 3 beds |
show details | |

|
#9
Us Route 11
Kirkwood, NY 13795
|
1,440 sq. feet
|
1 baths 3 beds |
show details | |

|
#10
Leslie Ave
Conklin, NY 13748
|
1,401 sq. feet
|
2 baths 2 beds |
show details |
| Photo | Address | Area | Beds / Baths | Price | Details |
|---|---|---|---|---|---|

|
#11
Us Route 11
Kirkwood, NY 13795
|
1,370 sq. feet
|
1 baths 3 beds |
show details | |

|
#12
Ostrum Rd
Kirkwood, NY 13795
|
1,108 sq. feet
|
1 baths 3 beds |
show details | |

|
#13
Muckey Rd
Binghamton, NY 13903
|
960 sq. feet
|
1 baths 2 beds |
show details | |

|
#14
North Rd
Windsor, NY 13865
|
885 sq. feet
|
1 baths 3 beds |
show details | |

|
#15
Bayless Ave
Binghamton, NY 13903
|
1,524 sq. feet
|
1 baths 4 beds |
show details | |

|
#16
Johnson Rd
Kirkwood, NY 13795
|
1,734 sq. feet
|
2 baths 3 beds |
show details | |

|
#17
9th St
Union Dale, PA 18470
|
- sq. feet
|
- baths - beds |
show details | |

|
#18
Powers Rd
Conklin, NY 13748
|
- sq. feet
|
- baths - beds |
show details | |

|
#19
E Rush Rd
Montrose, PA 18801
|
- sq. feet
|
- baths - beds |
show details | |

|
#20
Roxbury St
Conklin, NY 13748
|
- sq. feet
|
- baths - beds |
show details |
| Photo | Address | Area | Beds / Baths | Price | Details |
|---|---|---|---|---|---|

|
#21
Wooden Rd
Montrose, PA 18801
|
- sq. feet
|
- baths - beds |
show details | |

|
#22
Hardie Rd
Conklin, NY 13748
|
- sq. feet
|
- baths - beds |
show details | |

|
#23
Bradley Ave
Conklin, NY 13748
|
- sq. feet
|
- baths - beds |
show details | |

|
#24
Decker Rd
Binghamton, NY 13903
|
- sq. feet
|
- baths - beds |
show details | |

|
#25
Frances St Apt 5
Kirkwood, NY 13795
|
- sq. feet
|
- baths - beds |
show details | |

|
#26
Maple Grove Rd
Starrucca, PA 18462
|
- sq. feet
|
- baths - beds |
show details | |

|
#27
Novitch Rd
Nicholson, PA 18446
|
- sq. feet
|
- baths - beds |
show details | |

|
#28
Morgan Rd
Binghamton, NY 13903
|
- sq. feet
|
- baths - beds |
show details | |

|
#29
Quilty Hill Rd
Kirkwood, NY 13795
|
980 sq. feet
|
- baths - beds |
show details | |

|
#30
Sr 407
Nicholson, PA 18446
|
- sq. feet
|
- baths - beds |
show details |
| Photo | Address | Area | Beds / Baths | Price | Details |
|---|---|---|---|---|---|

|
#31
State Route 171
Susquehanna, PA 18847
|
- sq. feet
|
- baths - beds |
show details | |

|
#32
High School Rd
Montrose, PA 18801
|
- sq. feet
|
- baths - beds |
show details | |

|
#33
Main St
Great Bend, PA 18821
|
- sq. feet
|
- baths - beds |
show details | |

|
#34
Fair Hill Rd
Harford, PA 18823
|
- sq. feet
|
- baths - beds |
show details | |

|
#35
Franklin Hill Rd
Hallstead, PA 18822
|
- sq. feet
|
- baths - beds |
show details | |

|
#36
Lane
Susquehanna, PA 18847
|
- sq. feet
|
- baths - beds |
show details | |

|
#37
Sheldon Rd
Susquehanna, PA 18847
|
- sq. feet
|
- baths - beds |
show details | |

|
#38
State Route 706
Montrose, PA 18801
|
- sq. feet
|
- baths - beds |
show details | |

|
#39
Conklin Rd
Conklin, NY 13748
|
924 sq. feet
|
- baths - beds |
show details | |

|
#40
Payne Rd
Kingsley, PA 18826
|
- sq. feet
|
- baths - beds |
show details |
| Photo | Address | Area | Beds / Baths | Price | Details |
|---|---|---|---|---|---|

|
#41
Bendix Rd
Montrose, PA 18801
|
- sq. feet
|
- baths - beds |
show details | |

|
#42
State Route 29
Montrose, PA 18801
|
- sq. feet
|
- baths - beds |
show details | |

|
#43
Ridge Rd
Montrose, PA 18801
|
- sq. feet
|
- baths - beds |
show details | |

|
#44
Main St, Apt 1
Thompson, PA 18465
|
- sq. feet
|
- baths - beds |
show details | |

|
#45
Felters Rd
Binghamton, NY 13903
|
- sq. feet
|
- baths - beds |
show details | |

|
#46
Hawleyton Rd
Binghamton, NY 13903
|
- sq. feet
|
- baths - beds |
show details | |

|
#47
Carr St
Nicholson, PA 18446
|
- sq. feet
|
- baths - beds |
show details | |

|
#48
Old County Rd
Montrose, PA 18801
|
- sq. feet
|
- baths - beds |
show details | |

|
#49
Route 79 S
Windsor, NY 13865
|
- sq. feet
|
- baths - beds |
show details | |

|
Check over 1 million property listings on Foreclosure.com!
|
browse all offers | |||


 | Foliage 2015 (11 replies) |
| A move to Susquehanna/Wayne Counties? NY Commute. (9 replies) |
| Five reasons why i hate Scranton (147 replies) |
| Finding an Apartment 30 min between Scranton PA and Binghamton NY (17 replies) |
| Rentals in the Scranton area? (7 replies) |
| Montrose chocolate and Wine festival (20 replies) |

Median year apartment built: 1940
Household type by relationship:
Households: 676- Male householders: 101 (40 living alone), Female householders: 185 (66 living alone)
98 spouses (98 opposite-sex spouses), 34 unmarried partners, (34 opposite-sex unmarried partners), 185 children (185 natural, 0 adopted, 0 stepchildren), 0 grandchildren, 22 brothers or sisters, 7 parents, 0 foster children, 10 other relatives, 26 non-relatives
Size of family households: 65 2-persons, 34 3-persons, 25 4-persons, 21 5-persons.
Size of nonfamily households: 111 1-person, 24 2-persons, 12 3-persons.
101 married couples with children.
37 single-parent households (0 men, 37 women).
92.0% of residents of New Milford speak English at home.
6.2% of residents speak Spanish at home (85% speak English very well, 15% don't speak English at all).
1.1% of residents speak other Indo-European language at home (57% speak English very well, 43% speak English well).
Foreign born population: 11 (1.6%)
(100.0% of them are naturalized citizens)
| Here: | 7.4 |
| State: | 6.8 |
| Here: | 4.9 |
| State: | 4.3 |
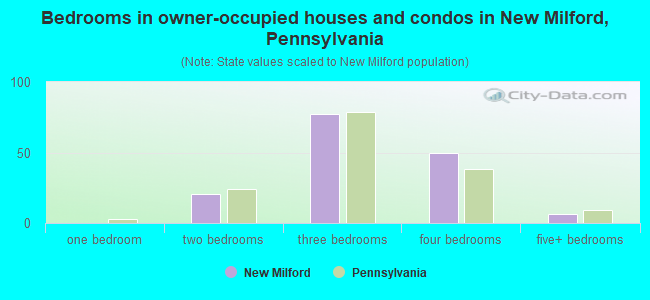
- Bedrooms in owner-occupied houses and condos in New Milford, Pennsylvania
- 0no bedroom
- 01 bedroom
- 202 bedrooms
- 773 bedrooms
- 504 bedrooms
- 65+ bedrooms
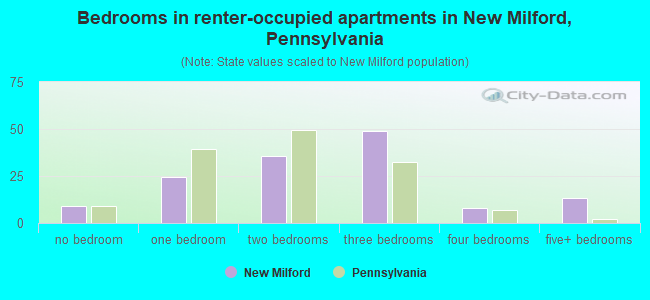
- Bedrooms in renter-occupied apartments in New Milford, Pennsylvania
- 9no bedroom
- 241 bedroom
- 362 bedrooms
- 493 bedrooms
- 84 bedrooms
- 135+ bedrooms
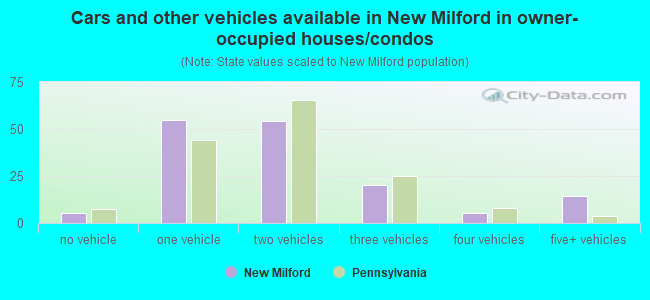
- Cars and other vehicles available in New Milford in owner-occupied houses/condos
- 5no vehicle
- 551 vehicle
- 542 vehicles
- 203 vehicles
- 54 vehicles
- 145+ vehicles
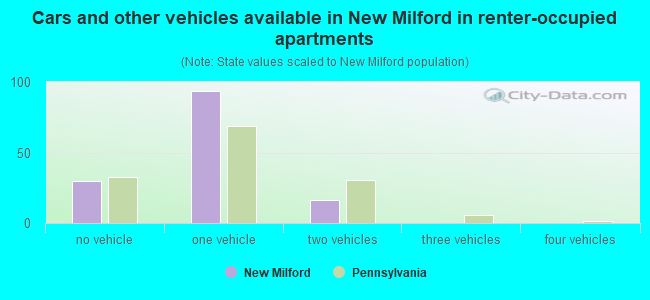
- Cars and other vehicles available in New Milford in renter-occupied apartments
- 30no vehicle
- 941 vehicle
- 162 vehicles
- 03 vehicles
- 04 vehicles
- 05+ vehicles
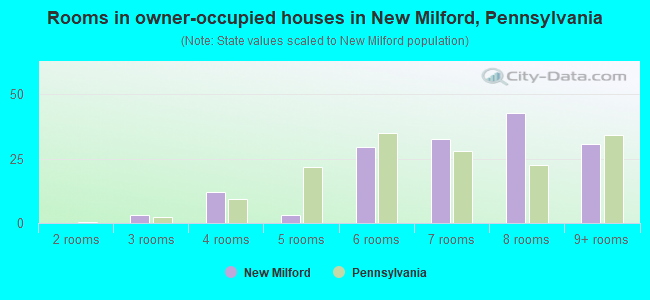
- Rooms in owner-occupied houses in New Milford, Pennsylvania
- 01 room
- 02 rooms
- 33 rooms
- 124 rooms
- 35 rooms
- 306 rooms
- 337 rooms
- 438 rooms
- 319+ rooms
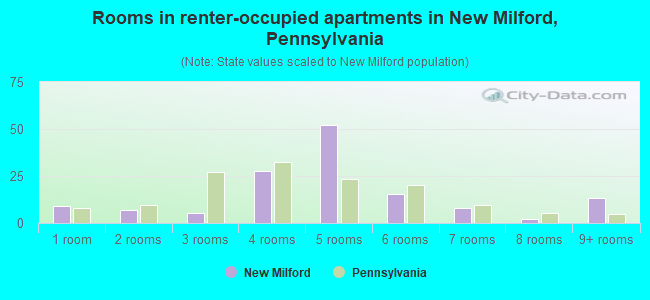
- Rooms in renter-occupied apartments in New Milford, Pennsylvania
- 91 room
- 72 rooms
- 53 rooms
- 284 rooms
- 525 rooms
- 156 rooms
- 87 rooms
- 28 rooms
- 139+ rooms
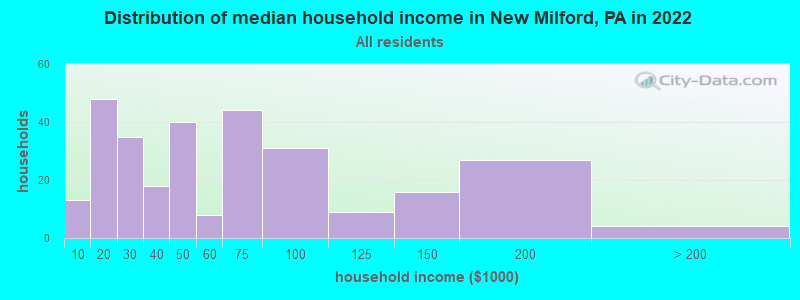
New Milford, PA household income distribution

- 13Less than $10,000
- 48$10,000 to $19,999
- 35$20,000 to $29,999
- 18$30,000 to $39,999
- 40$40,000 to $49,999
- 8$50,000 to $59,999
- 44$60,000 to $74,999
- 31$75,000 to $99,999
- 9$100,000 to $124,999
- 16$125,000 to $149,999
- 27$150,000 to $199,999
- 4$200,000 or more
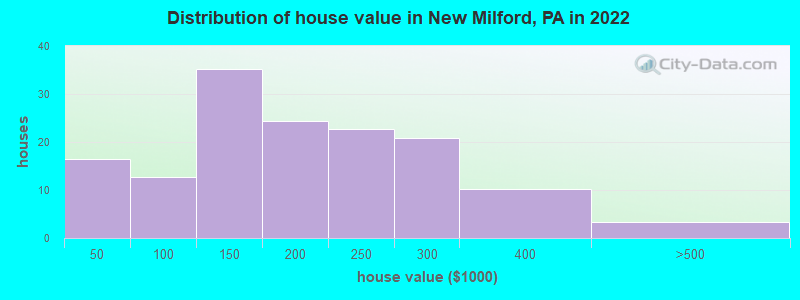
Home value of owner - occupied houses in 2022 in New Milford, PA
-
- 4$20,000 to $24,999
- 9$35,000 to $39,999
- 2$40,000 to $49,999
- 1$50,000 to $59,999
- 6$60,000 to $69,999
- 2$90,000 to $99,999
- 10$100,000 to $124,999
- 24$125,000 to $149,999
- 24$150,000 to $174,999
- 22$200,000 to $249,999
- 20$250,000 to $299,999
- 10$300,000 to $399,999
- 3$400,000 to $499,999
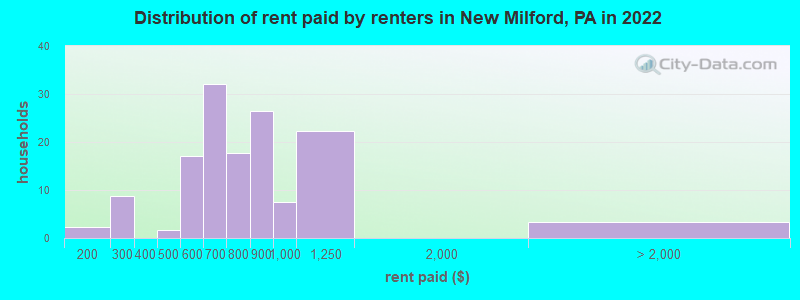
Rent paid by renters in 2022 in New Milford, PA
-
- 2$150 to $199
- 2$200 to $249
- 5$250 to $299
- 1$450 to $499
- 11$500 to $549
- 6$550 to $599
- 3$600 to $649
- 28$650 to $699
- 6$700 to $749
- 11$750 to $799
- 26$800 to $899
- 7$900 to $999
- 22$1,000 to $1,249
- 3No cash rent
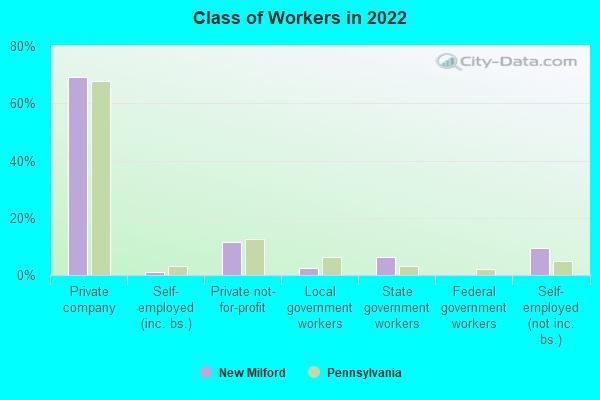
Percentage of workers working in this county: 71.0%
Number of people working at home: 40 (12.3% of all workers)
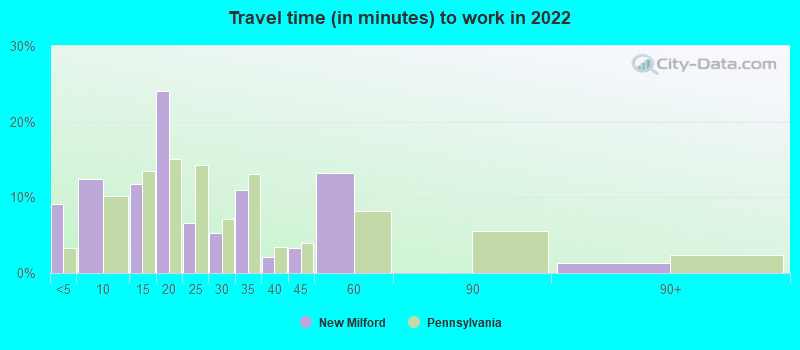
Travel time to work (commute)
- Less than 5 minutes: 19
- 5 to 9 minutes: 53
- 10 to 14 minutes: 14
- 15 to 19 minutes: 29
- 20 to 24 minutes: 39
- 25 to 29 minutes: 21
- 30 to 34 minutes: 57
- 35 to 39 minutes: 0
- 40 to 44 minutes: 21
- 45 to 59 minutes: 19
- 60 to 89 minutes: 1
- 90 or more minutes: 1
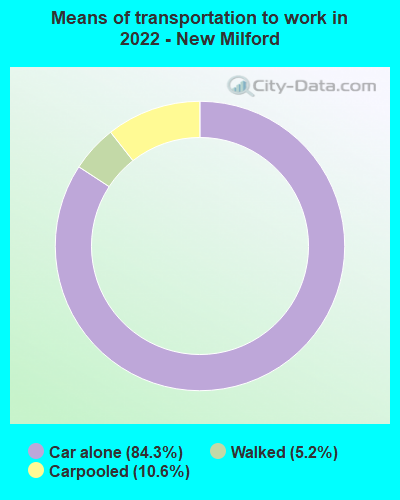
Means of transportation to work:
- Drove a car alone: 367 (76.1%)
- Carpooled: 45 (9.3%)
- Walked: 22 (4.6%)
- Worked at home: 40 (8.3%)
- Unemployment by race in 2022
- Unemployment rate for White non-Hispanic residents
- 15.1%Females
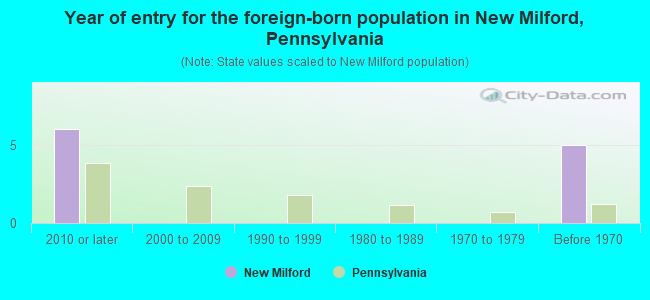
- Year of entry for the foreign-born population in New Milford, Pennsylvania
- 62010 or later
- 02000 to 2009
- 01990 to 1999
- 01980 to 1989
- 01970 to 1979
- 5Before 1970
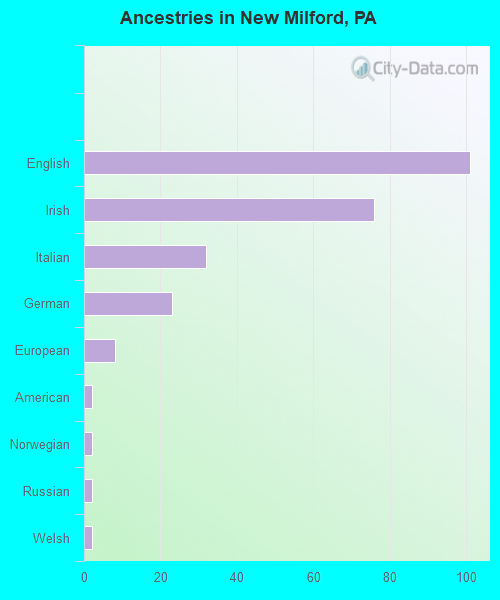
First ancestries reported:
- English: 101 (39.2%)
- Irish: 76 (29.5%)
- Italian: 32 (12.4%)
- German: 23 (8.9%)
- European: 8 (3.1%)
- American: 2 (0.8%)
- Norwegian: 2 (0.8%)
- Russian: 2 (0.8%)
- Welsh: 2 (0.8%)
Most common places of birth for foreign-born residents (%):
| New Milford: | 54.5% (6) |
| Pennsylvania: | 9.2% (86,544) |
| New Milford: | 27.3% (3) |
| Pennsylvania: | 2.1% (19,841) |
| New Milford: | 18.2% (2) |
| Pennsylvania: | 1.6% (15,272) |
Place of birth for U.S.-born residents:
- This state: 328
- Other state: 342
- Northeast: 311
- Midwest: 0
- South: 22
- West: 7
87.2% of New Milford residents lived in the same house 1 years ago.
Out of people who lived in different houses, 30.8% lived in this county.
Out of people who lived in different counties, 2.1% lived in Pennsylvania.
| New Milford: | 87.2% |
| State average: | 89.3% |
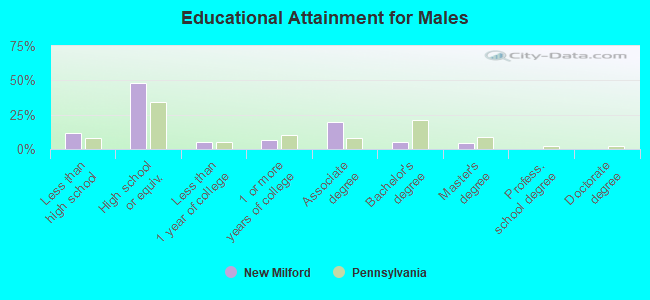
Education attainment for males 25 years and older:
- No schooling: 0
- Nursery to 4th grade: 0
- 5th and 6th grade: 0
- 7th and 8th grade: 0
- 9th grade: 0
- 10th grade: 2
- 11th grade: 4
- 12th grade, no diploma: 17
- High school graduate (or equivalency): 95
- Less than 1 year of college: 10
- Some college more than 1 year, no degree: 13
- Associate degree: 39
- Bachelor's degree: 10
- Master's degree: 8
- Professional school degree: 0
- Doctorate degree: 0
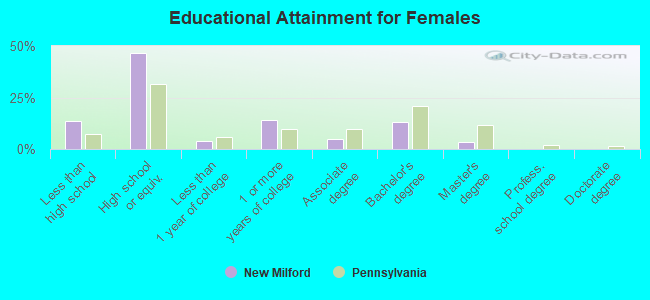
Education attainment for females 25 years and older:
- No schooling: 5
- Nursery to 4th grade: 0
- 5th and 6th grade: 0
- 7th and 8th grade: 9
- 9th grade: 0
- 10th grade: 1
- 11th grade: 3
- 12th grade, no diploma: 17
- High school graduate (or equivalency): 119
- Less than 1 year of college: 10
- Some college more than 1 year, no degree: 36
- Associate degree: 12
- Bachelor's degree: 34
- Master's degree: 9
- Professional school degree: 0
- Doctorate degree: 0


Housing units in structures:
- One, detached: 206
- Two: 40
- 3 or 4: 29
- 5 to 9: 32
- 10 to 19: 22
- 20 to 49: 11
- Mobile homes: 17
Housing units lacking complete kitchen facilities in 2022: 10.4%
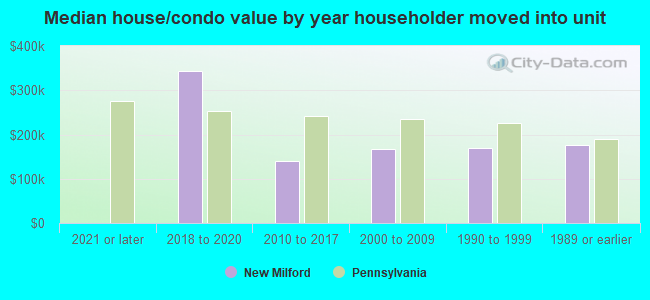
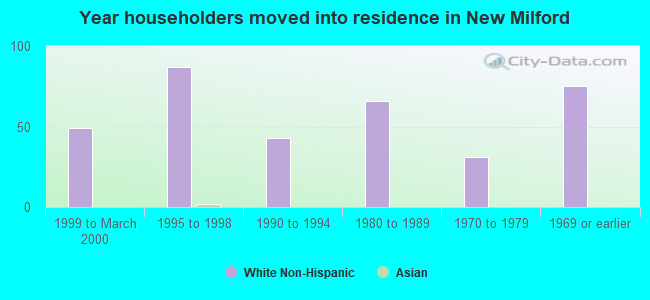
House/condo owner moved in on average 21 years ago
Renter moved in on average 1 years ago
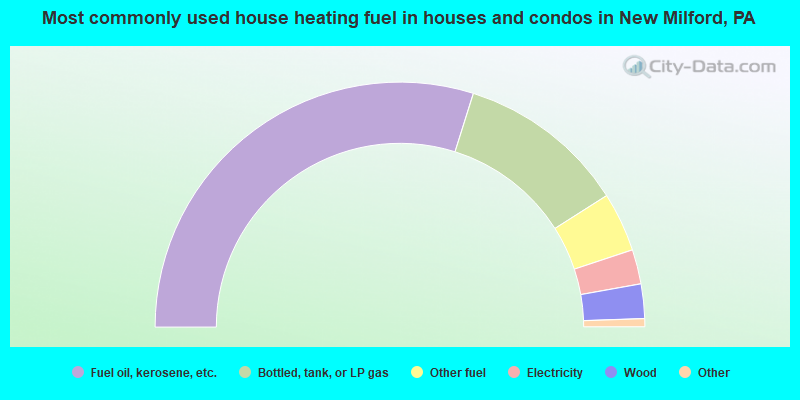
- 60.3%Fuel oil, kerosene, etc.
- 22.5%Bottled, tank, or LP gas
- 7.9%Other fuel
- 4.6%Electricity
- 4.6%Wood
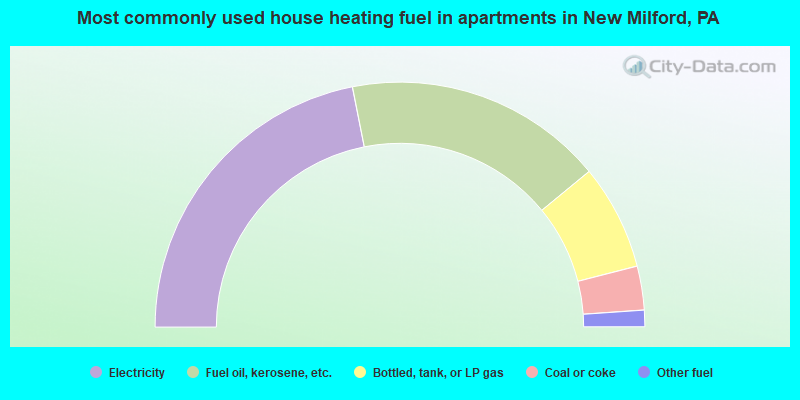
- 43.8%Electricity
- 34.3%Fuel oil, kerosene, etc.
- 13.9%Bottled, tank, or LP gas
- 5.8%Coal or coke
- 2.2%Other fuel
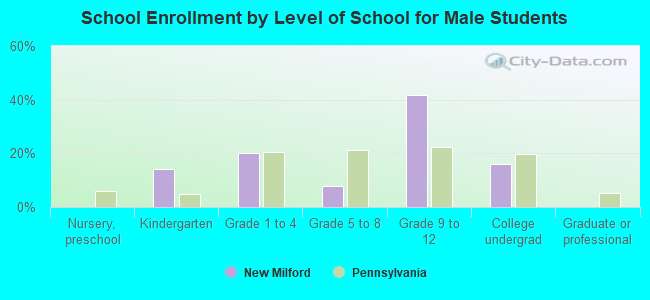
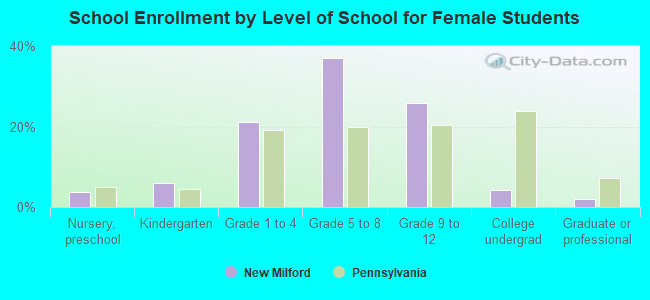
Private vs. public school enrollment:
| Here: | 8.7% |
| Pennsylvania: | 15.7% |
| Here: | 0.0% |
| Pennsylvania: | 13.4% |
| Here: | 30.0% |
| Pennsylvania: | 39.8% |