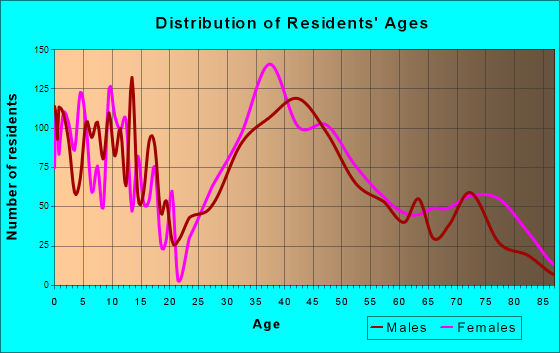
New Providence, NJ (New Jersey) Houses and Residents
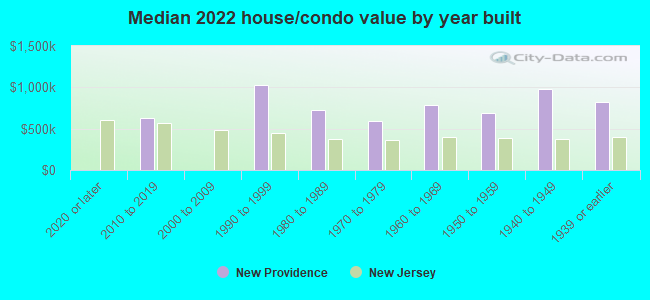
| New Providence: | $764,497 |
| New Jersey: | $428,900 |
Mean price in 2022:
Detached houses: $750,175
Here: $750,175 State: $537,591 Townhouses or other attached units: $830,013
Here: $830,013 State: $381,113 In 2-unit structures: $356,069
Here: $356,069 State: $444,476 In 3-to-4-unit structures: $520,766
Here: $520,766 State: $457,463 In 5-or-more-unit structures: $706,197
Here: $706,197 State: $368,745
Total population: 12,422 (Urban population: 11,907, Rural population: 0)
Houses: 5,381 (5,112 occupied: 3,958 owner occupied, 1,171 renter occupied)
| % of renters here: | 23% |
| State: | 35% |
Housing density: 1,463 houses/condos per square mile
Median price asked for vacant for-sale houses and condos in 2022: $575,352.
Median contract rent in 2022: $1,874 (lower quartile is $1,562, upper quartile is over $2,000)
Median rent asked for vacant for-rent units in 2022: $3,594
Median gross rent in New Providence, NJ in 2022: $1,951
Housing units in New Providence with a mortgage: 2,337 (166 second mortgage, 0 home equity loan, 166 both second mortgage and home equity loan)
Houses without a mortgage: 289
Median household income for houses/condos with a mortgage: $231,162
Median household income for apartments without a mortgage: $139,487
Median monthly housing costs: $2,657
Compare current foreclosures near New Providence, NJ:
| Photo | Address | Area | Beds / Baths | Price | Details |
|---|---|---|---|---|---|

|
#1
Westview Ave
New Providence, NJ 07974
|
- sq. feet
|
- baths - beds |
show details | |

|
#2
Hedden Pl
New Providence, NJ 07974
|
1,978 sq. feet
|
- baths - beds |
show details | |

|
#3
Beech St
New Providence, NJ 07974
|
- sq. feet
|
- baths - beds |
show details | |

|
#4
Jersey Ave
Morristown, NJ 07960
|
2,406 sq. feet
|
2 baths 4 beds |
$665,000
|
show details |

|
#5
S Orange Ave
Newark, NJ 07103
|
989 sq. feet
|
1 baths 2 beds |
$289,900
|
show details |

|
#6
Hazelhurst St
New Brunswick, NJ 08901
|
465 sq. feet
|
1 baths 1 beds |
$325,000
|
show details |

|
#7
Catherine St
South Amboy, NJ 08879
|
2,266 sq. feet
|
3 baths 4 beds |
$351,900
|
show details |

|
#8
Ashland Ave
East Orange, NJ 07017
|
2,254 sq. feet
|
1 baths 5 beds |
$272,000
|
show details |

|
#9
Applegate Ave
Elizabeth, NJ 07202
|
808 sq. feet
|
1 baths 2 beds |
$355,000
|
show details |

|
#10
1st Ave
North Brunswick, NJ 08902
|
1,296 sq. feet
|
2 baths 3 beds |
$349,900
|
show details |
| Photo | Address | Area | Beds / Baths | Price | Details |
|---|---|---|---|---|---|

|
#11
Florence Ave
Colonia, NJ 07067
|
1,930 sq. feet
|
2 baths 3 beds |
$599,900
|
show details |

|
#12
Sharon Garden Ct
Woodbridge, NJ 07095
|
1,000 sq. feet
|
2 baths 2 beds |
$455,000
|
show details |

|
#13
Willow St
Bloomfield, NJ 07003
|
1,092 sq. feet
|
1 baths 3 beds |
$499,900
|
show details |

|
#14
Bloomfield Ave
Caldwell, NJ 07006
|
1,216 sq. feet
|
2 baths 2 beds |
$400,000
|
show details |

|
#15
Huntington Rd
Union, NJ 07083
|
1,532 sq. feet
|
2 baths 3 beds |
$539,900
|
show details |

|
#16
The Fellsway
New Providence, NJ 07974
|
- sq. feet
|
- baths - beds |
show details | |

|
#17
Glenside Rd
New Providence, NJ 07974
|
- sq. feet
|
- baths - beds |
show details | |

|
#18
Burlington Rd
New Providence, NJ 07974
|
- sq. feet
|
- baths - beds |
show details | |

|
#19
The Fellsway
New Providence, NJ 07974
|
- sq. feet
|
- baths - beds |
show details | |

|
#20
Crane Cir
New Providence, NJ 07974
|
- sq. feet
|
- baths - beds |
show details |
| Photo | Address | Area | Beds / Baths | Price | Details |
|---|---|---|---|---|---|

|
#21
N 19th St
East Orange, NJ 07017
|
- sq. feet
|
3 baths 6 beds |
$399,900
|
show details |

|
#22
Willow Rd W
Staten Island, NY 10314
|
- sq. feet
|
1 baths 3 beds |
$491,400
|
show details |

|
#23
Station Ave
Staten Island, NY 10309
|
- sq. feet
|
1 baths 3 beds |
$649,900
|
show details |

|
#24
Cook Ave
Middlesex, NJ 08846
|
- sq. feet
|
1 baths 3 beds |
$244,900
|
show details |

|
#25
Glannon Rd
Livingston, NJ 07039
|
- sq. feet
|
1 baths 3 beds |
$535,600
|
show details |

|
#26
Clove Rd Apt 6e
Staten Island, NY 10301
|
950 sq. feet
|
1 baths 1 beds |
show details | |

|
#27
Crestwood Ave
Nutley, NJ 07110
|
1,032 sq. feet
|
1 baths 3 beds |
show details | |

|
#28
Waverly Dr W
Edison, NJ 08817
|
1,947 sq. feet
|
2 baths 4 beds |
show details | |

|
#29
Carnegie Ave
Plainfield, NJ 07060
|
1,210 sq. feet
|
1 baths 3 beds |
show details | |

|
#30
Newark Ave
Staten Island, NY 10302
|
1,120 sq. feet
|
1 baths 3 beds |
show details |
| Photo | Address | Area | Beds / Baths | Price | Details |
|---|---|---|---|---|---|

|
#31
Donaldson Pl
Linden, NJ 07036
|
768 sq. feet
|
3 baths 3 beds |
show details | |

|
#32
Tompkins Ct
Staten Island, NY 10310
|
1,890 sq. feet
|
1 baths 3 beds |
show details | |

|
#33
293 Morris Ave
Newark, NJ 07103
|
3,386 sq. feet
|
6 baths 9 beds |
show details | |

|
#34
Hagaman St
Port Reading, NJ 07064
|
1,376 sq. feet
|
2 baths 3 beds |
show details | |

|
#35
State Route 10 Bldg
Morris Plains, NJ 07950
|
800 sq. feet
|
1 baths 1 beds |
show details | |

|
#36
Midland Ave
East Orange, NJ 07017
|
1,558 sq. feet
|
1 baths 3 beds |
show details | |

|
#37
Ralph Rd
West Orange, NJ 07052
|
1,329 sq. feet
|
2 baths 3 beds |
show details | |

|
#38
Luisser St
Clifton, NJ 07012
|
1,464 sq. feet
|
1 baths 3 beds |
show details | |

|
#39
High St Apt 26
Orange, NJ 07050
|
1,116 sq. feet
|
1 baths 3 beds |
show details | |

|
#40
Irving St
Carteret, NJ 07008
|
1,110 sq. feet
|
1 baths 3 beds |
show details |
| Photo | Address | Area | Beds / Baths | Price | Details |
|---|---|---|---|---|---|

|
#41
Bloomingdale Ave
Cranford, NJ 07016
|
1,800 sq. feet
|
2 baths 4 beds |
show details | |

|
#42
Rigimar Ct
Staten Island, NY 10309
|
2,600 sq. feet
|
3 baths 5 beds |
show details | |

|
#43
New St
East Orange, NJ 07017
|
2,212 sq. feet
|
2 baths 5 beds |
show details | |

|
#44
Gabriele Ct
Staten Island, NY 10312
|
2,100 sq. feet
|
3 baths 3 beds |
show details | |

|
#45
Van Duyne Ave
Wayne, NJ 07470
|
1,526 sq. feet
|
1 baths 4 beds |
show details | |

|
#46
N 8th St
Newark, NJ 07107
|
1,648 sq. feet
|
2 baths 4 beds |
show details | |

|
#47
E 5th Ave
Roselle, NJ 07203
|
1,342 sq. feet
|
2 baths 3 beds |
show details | |

|
#48
Dey St
Montclair, NJ 07042
|
1,472 sq. feet
|
3 baths 4 beds |
show details | |

|
#49
Bradford St
Orange, NJ 07050
|
1,382 sq. feet
|
1 baths 2 beds |
show details | |

|
Check over 1 million property listings on Foreclosure.com!
|
browse all offers | |||


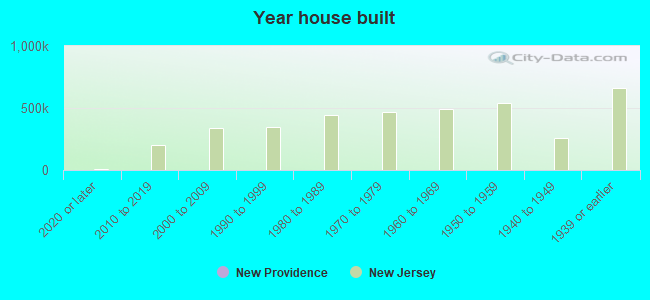
Median year apartment built: 1991
Household type by relationship:
Households: 13,541- Male householders: 2,740 (337 living alone), Female householders: 2,304 (831 living alone)
3,525 spouses (3,466 opposite-sex spouses), 109 unmarried partners, (109 opposite-sex unmarried partners), 4,347 children (4,185 natural, 44 adopted, 117 stepchildren), 97 grandchildren, 25 brothers or sisters, 149 parents, 0 foster children, 24 other relatives, 39 non-relatives
- In group quarters: 175
Size of family households: 1,464 2-persons, 669 3-persons, 1,037 4-persons, 580 5-persons, 66 6-persons.
Size of nonfamily households: 1,135 1-person, 113 2-persons.
2,777 married couples with children.
377 single-parent households (81 men, 296 women).
77.5% of residents of New Providence speak English at home.
2.6% of residents speak Spanish at home (63% speak English very well, 9% speak English well, 28% speak English not well).
9.0% of residents speak other Indo-European language at home (78% speak English very well, 17% speak English well, 5% speak English not well, 1% don't speak English at all).
9.7% of residents speak Asian or Pacific Island language at home (66% speak English very well, 30% speak English well, 3% speak English not well, 1% don't speak English at all).
1.5% of residents speak other language at home (90% speak English very well, 10% speak English well).
Foreign born population: 2,632 (19.4%)
(49.1% of them are naturalized citizens)
| Here: | 7.9 |
| State: | 6.8 |
| Here: | 3.8 |
| State: | 3.9 |
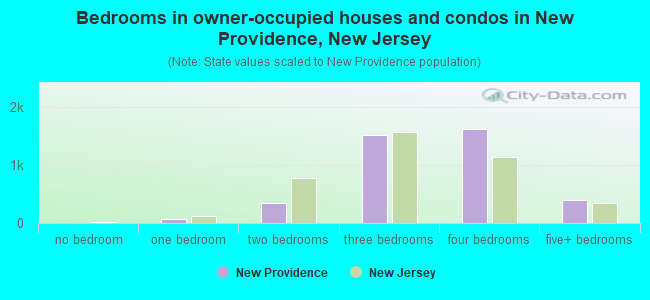
- Bedrooms in owner-occupied houses and condos in New Providence, New Jersey
- 0no bedroom
- 681 bedroom
- 3482 bedrooms
- 1,5233 bedrooms
- 1,6204 bedrooms
- 3995+ bedrooms
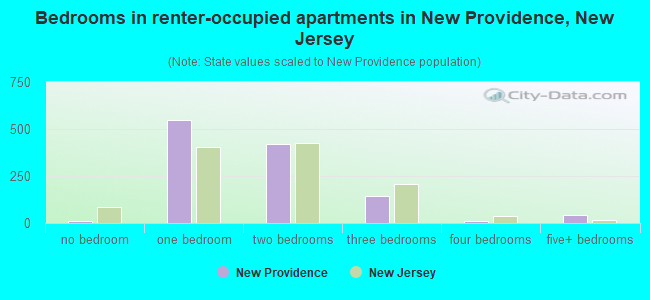
- Bedrooms in renter-occupied apartments in New Providence, New Jersey
- 10no bedroom
- 5461 bedroom
- 4212 bedrooms
- 1413 bedrooms
- 104 bedrooms
- 445+ bedrooms
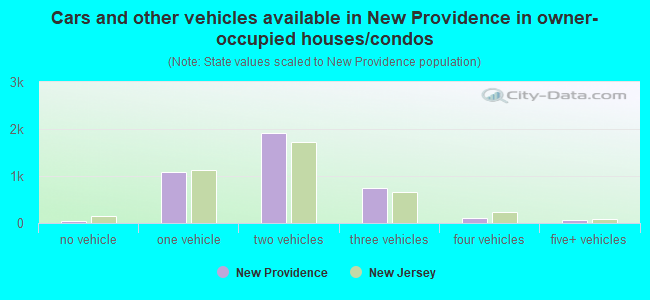
- Cars and other vehicles available in New Providence in owner-occupied houses/condos
- 51no vehicle
- 1,0851 vehicle
- 1,9162 vehicles
- 7433 vehicles
- 1084 vehicles
- 555+ vehicles
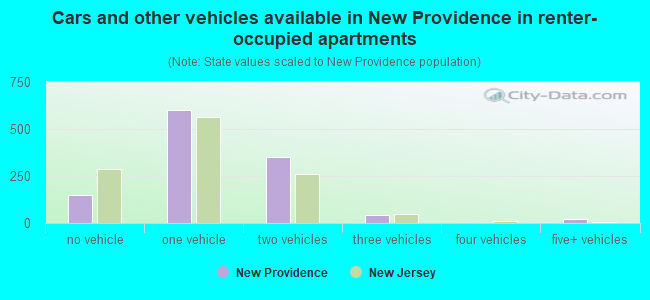
- Cars and other vehicles available in New Providence in renter-occupied apartments
- 151no vehicle
- 6031 vehicle
- 3502 vehicles
- 453 vehicles
- 04 vehicles
- 235+ vehicles
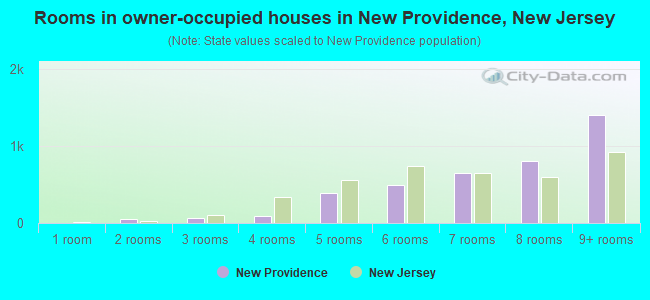
- Rooms in owner-occupied houses in New Providence, New Jersey
- 01 room
- 482 rooms
- 613 rooms
- 914 rooms
- 3925 rooms
- 4996 rooms
- 6577 rooms
- 8038 rooms
- 1,4079+ rooms
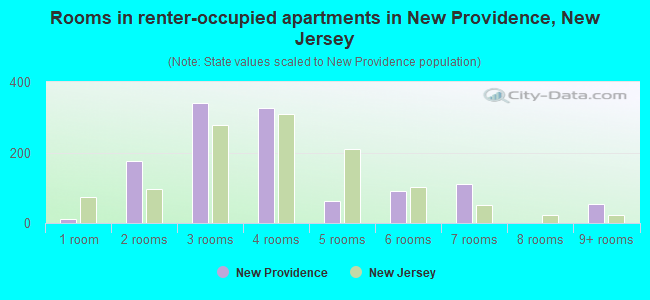
- Rooms in renter-occupied apartments in New Providence, New Jersey
- 101 room
- 1762 rooms
- 3403 rooms
- 3274 rooms
- 625 rooms
- 926 rooms
- 1107 rooms
- 08 rooms
- 549+ rooms
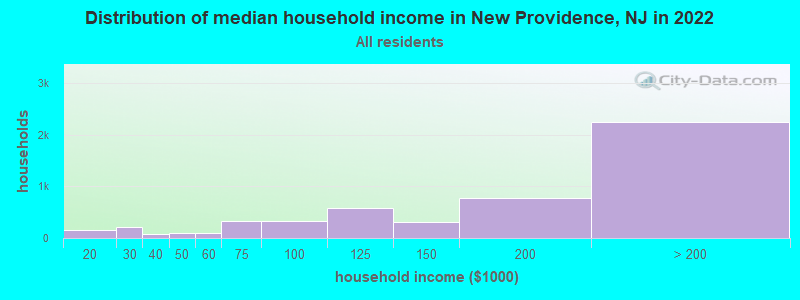
New Providence, NJ household income distribution

- 19Less than $10,000
- 159$10,000 to $19,999
- 209$20,000 to $29,999
- 74$30,000 to $39,999
- 103$40,000 to $49,999
- 106$50,000 to $59,999
- 332$60,000 to $74,999
- 333$75,000 to $99,999
- 577$100,000 to $124,999
- 311$125,000 to $149,999
- 774$150,000 to $199,999
- 2,248$200,000 or more
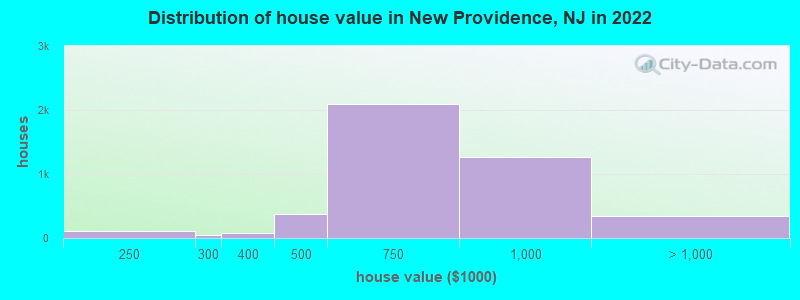
Home value of owner - occupied houses in 2022 in New Providence, NJ
-
- 13$40,000 to $49,999
- 10$125,000 to $149,999
- 3$175,000 to $199,999
- 115$200,000 to $249,999
- 46$250,000 to $299,999
- 73$300,000 to $399,999
- 373$400,000 to $499,999
- 2,089$500,000 to $749,999
- 1,268$750,000 to $999,999
- 312$1,000,000 to $1,499,999
- 25$1,500,000 to $1,999,999
- 8$2,000,000 or more
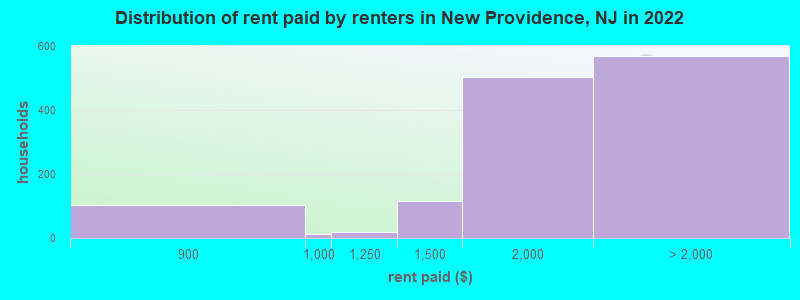
Rent paid by renters in 2022 in New Providence, NJ
-
- 103$800 to $899
- 11$900 to $999
- 19$1,000 to $1,249
- 115$1,250 to $1,499
- 503$1,500 to $1,999
- 78$2,000 to $2,499
- 258$2,500 to $2,999
- 191$3,500 or more
- 39No cash rent
Percentage of workers working in this county: 51.3%
Number of people working at home: 1,645 (26.4% of all workers)
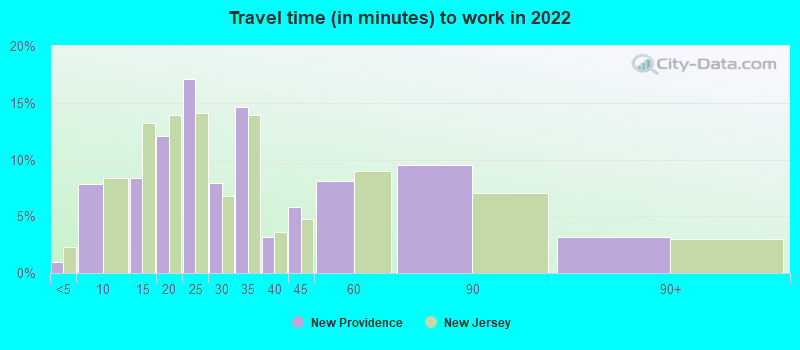
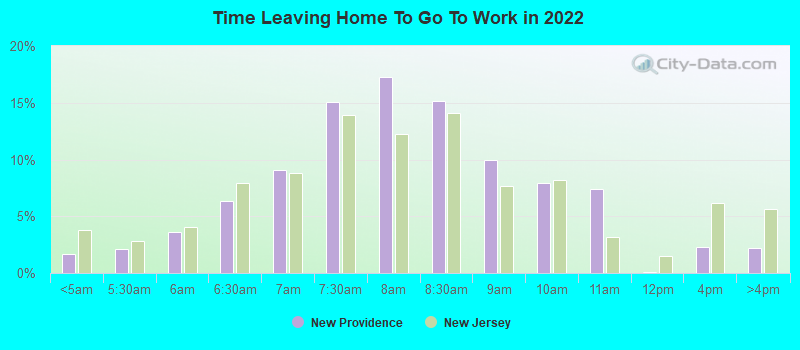
Travel time to work (commute)
- Less than 5 minutes: 64
- 5 to 9 minutes: 522
- 10 to 14 minutes: 437
- 15 to 19 minutes: 609
- 20 to 24 minutes: 386
- 25 to 29 minutes: 330
- 30 to 34 minutes: 438
- 35 to 39 minutes: 240
- 40 to 44 minutes: 265
- 45 to 59 minutes: 294
- 60 to 89 minutes: 636
- 90 or more minutes: 477
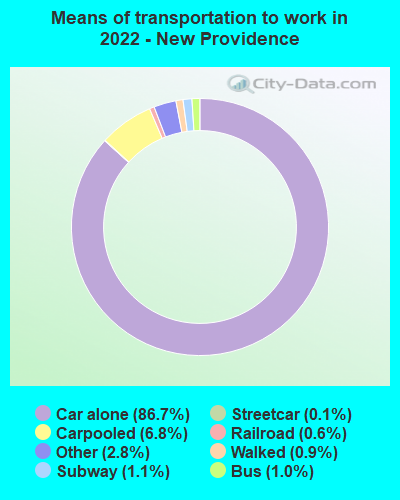
Means of transportation to work:
- Drove a car alone: 5,384 (67.9%)
- Carpooled: 510 (6.4%)
- Bus: 71 (0.9%)
- Subway or elevated rail: 5 (0.1%)
- Long-distance train or commuter rail: 86 (1.1%)
- Light rail, streetcar or trolley: 43 (0.5%)
- Taxi: 153 (1.9%)
- Walked: 63 (0.8%)
- Worked at home: 1,645 (20.7%)
- Unemployment by race in 2022
- Unemployment rate for White non-Hispanic residents
- 3.3%Males
- 1.7%Females
- Unemployment rate for Black residents
- 23.7%Females
- Unemployment rate for Asian residents
- 3.1%Males
- 4.5%Females
- Unemployment rate for two or more race residents
- 16.5%Females
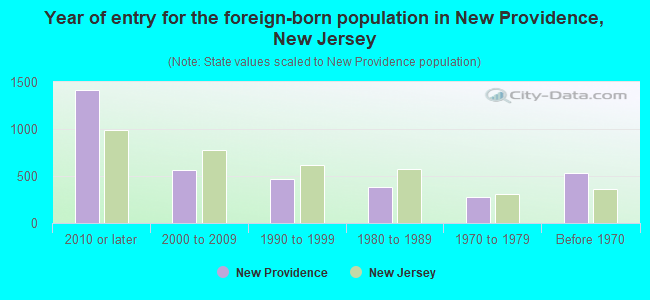
- Year of entry for the foreign-born population in New Providence, New Jersey
- 1,4112010 or later
- 5602000 to 2009
- 4641990 to 1999
- 3871980 to 1989
- 2781970 to 1979
- 536Before 1970
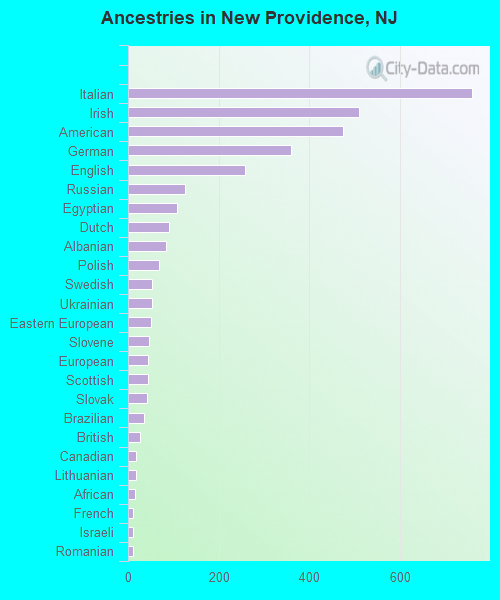
First ancestries reported:
- Italian: 758 (13.0%)
- Irish: 509 (8.7%)
- American: 473 (8.1%)
- German: 359 (6.1%)
- English: 258 (4.4%)
- Russian: 126 (2.2%)
- Egyptian: 107 (1.8%)
- Dutch: 91 (1.6%)
- Albanian: 84 (1.4%)
- Polish: 68 (1.2%)
- Swedish: 54 (0.9%)
- Ukrainian: 53 (0.9%)
- Eastern European: 50 (0.9%)
- Slovene: 46 (0.8%)
- European: 43 (0.7%)
- Scottish: 43 (0.7%)
- Slovak: 42 (0.7%)
- Brazilian: 35 (0.6%)
- British: 27 (0.5%)
- Canadian: 17 (0.3%)
- Lithuanian: 17 (0.3%)
- African: 15 (0.3%)
- French: 12 (0.2%)
- Israeli: 12 (0.2%)
- Romanian: 12 (0.2%)
- Lebanese: 11 (0.2%)
- Hungarian: 8 (0.1%)
- Jamaican: 7 (0.1%)
- Scotch-Irish: 4 (0.07%)
Most common places of birth for foreign-born residents (%):
| New Providence: | 24.7% (631) |
| New Jersey: | 12.8% (274,609) |
| New Providence: | 13.3% (340) |
| New Jersey: | 3.7% (78,969) |
| New Providence: | 7.2% (185) |
| New Jersey: | 4.0% (85,934) |
| New Providence: | 6.4% (165) |
| New Jersey: | 0.9% (20,371) |
| New Providence: | 5.8% (148) |
| New Jersey: | 2.2% (47,365) |
| New Providence: | 4.8% (124) |
| New Jersey: | 0.7% (14,848) |
| New Providence: | 3.5% (90) |
| New Jersey: | 0.7% (15,548) |
| New Providence: | 2.5% (64) |
| New Jersey: | 0.1% (2,890) |
| New Providence: | 2.4% (61) |
| New Jersey: | 1.1% (22,760) |
| New Providence: | 2.3% (59) |
| New Jersey: | 2.1% (46,020) |
| New Providence: | 2.0% (52) |
| New Jersey: | 0.2% (4,324) |
| New Providence: | 2.0% (50) |
| New Jersey: | 1.6% (33,678) |
| New Providence: | 1.6% (42) |
| New Jersey: | 0.9% (18,317) |
| New Providence: | 1.5% (39) |
| New Jersey: | 0.3% (6,882) |
Place of birth for U.S.-born residents:
- This state: 6,473
- Other state: 4,319
- Northeast: 2,906
- Midwest: 422
- South: 627
- West: 250
93.3% of New Providence residents lived in the same house 1 years ago.
Out of people who lived in different houses, 27.7% lived in this county.
Out of people who lived in different counties, 50.4% lived in New Jersey.
| New Providence: | 93.3% |
| State average: | 90.4% |
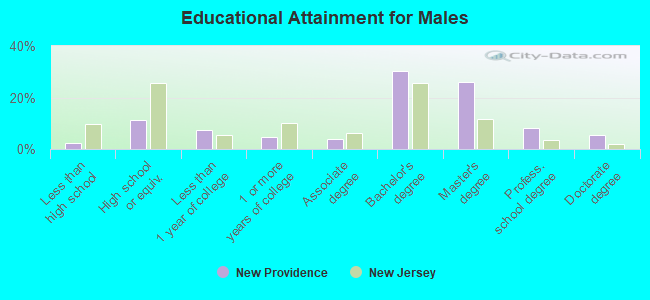
Education attainment for males 25 years and older:
- No schooling: 51
- Nursery to 4th grade: 0
- 5th and 6th grade: 0
- 7th and 8th grade: 15
- 9th grade: 0
- 10th grade: 7
- 11th grade: 11
- 12th grade, no diploma: 32
- High school graduate (or equivalency): 532
- Less than 1 year of college: 347
- Some college more than 1 year, no degree: 223
- Associate degree: 192
- Bachelor's degree: 1,442
- Master's degree: 1,242
- Professional school degree: 390
- Doctorate degree: 263
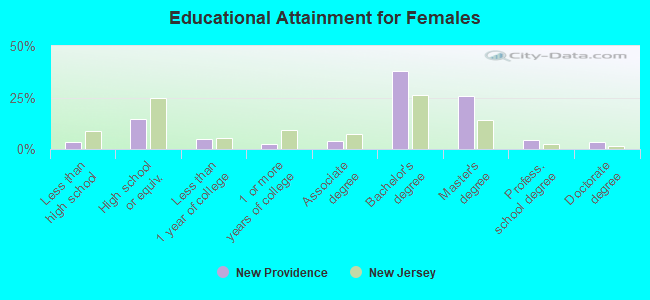
Education attainment for females 25 years and older:
- No schooling: 54
- Nursery to 4th grade: 0
- 5th and 6th grade: 7
- 7th and 8th grade: 8
- 9th grade: 19
- 10th grade: 0
- 11th grade: 31
- 12th grade, no diploma: 35
- High school graduate (or equivalency): 693
- Less than 1 year of college: 224
- Some college more than 1 year, no degree: 110
- Associate degree: 190
- Bachelor's degree: 1,807
- Master's degree: 1,214
- Professional school degree: 214
- Doctorate degree: 152
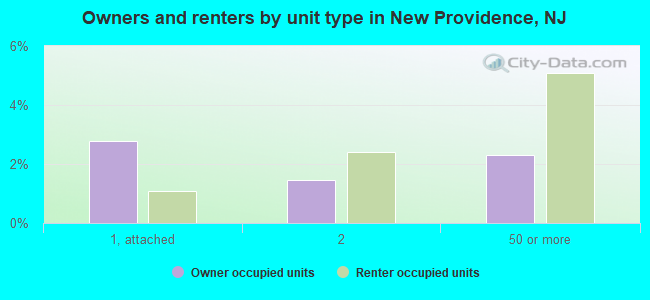
Housing units in structures:
- One, detached: 3,682
- One, attached: 181
- Two: 198
- 3 or 4: 172
- 5 to 9: 241
- 10 to 19: 189
- 20 to 49: 209
- 50 or more: 504
Housing units lacking complete kitchen facilities in 2022: 0.5%
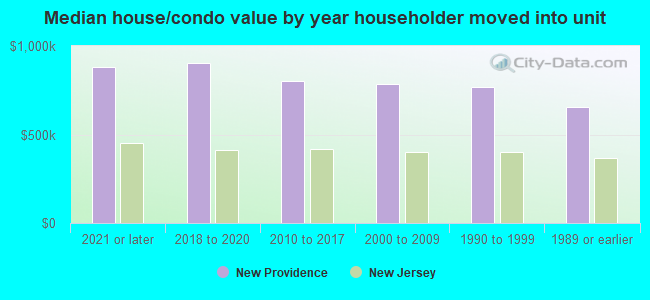
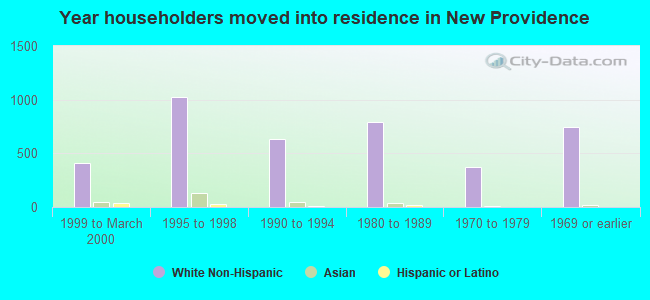
House/condo owner moved in on average 16 years ago
Renter moved in on average 1 years ago
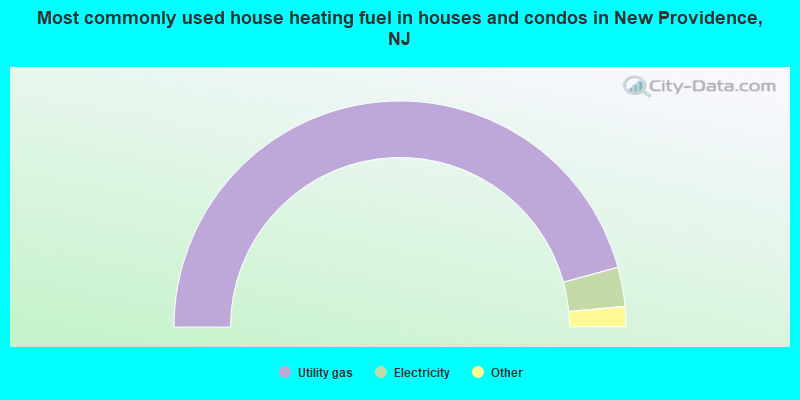
- 91.5%Utility gas
- 5.6%Electricity
- 1.5%Solar energy
- 0.5%Bottled, tank, or LP gas
- 0.4%No fuel used
- 0.3%Coal or coke
- 0.2%Fuel oil, kerosene, etc.
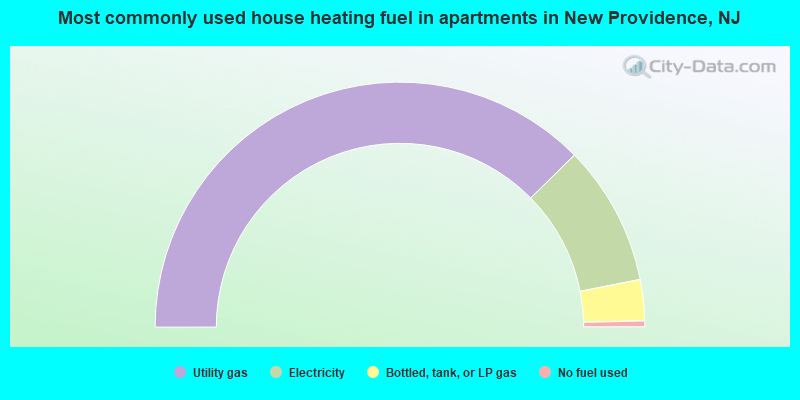
- 75.3%Utility gas
- 18.6%Electricity
- 5.4%Bottled, tank, or LP gas
- 0.8%No fuel used
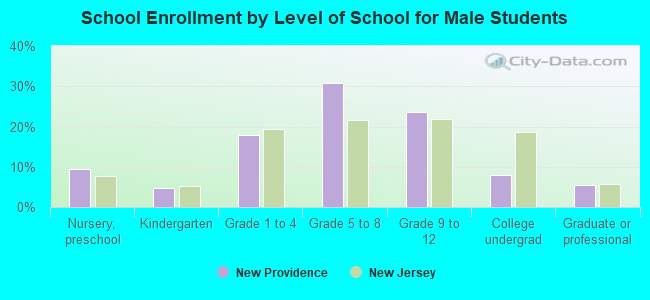
Private vs. public school enrollment:
| Here: | 10.3% |
| New Jersey: | 12.3% |
| Here: | 5.7% |
| New Jersey: | 13.1% |
| Here: | 47.2% |
| New Jersey: | 33.2% |