Median price asked for vacant for-sale houses and condos in 2022 in this county: $191,319.
Median contract rent in 2022: $813 (lower quartile is $435, upper quartile is $1,213)
Median rent asked for vacant for-rent units in 2022: $1,514
Median gross rent in New Salem, MA in 2022: $968
Housing units in New Salem with a mortgage: 185 (17 second mortgage, 19 home equity loan, 0 both second mortgage and home equity loan) Houses without a mortgage: 53
In family households: 54,236 (12,210 male householders, 6,107 female householders)
13,655 spouses, 17,750 children (16,448 natural, 543 adopted, 759 stepchildren), 917 grandchildren, 418 brothers or sisters, 464 parents, foster children, 409 other relatives, 1,987 non-relatives
In nonfamily households: 15,655 (5,446 male householders (3,978 living alone)), 6,699 female householders (5,318 living alone)), 3,510 nonrelatives
In group quarters: 1,481 (665 institutionalized population)
11,122 married couples with children.
4,422 single-parent households (1,025 men, 3,397 women).
96.1% of residents of New Salem speak English at home.
1.6% of residents speak Spanish at home (50% speak English very well, 29% speak English well, 21% speak English not well).
2.3% of residents speak other Indo-European language at home (70% speak English very well, 30% speak English not well).
Foreign born population: 31 (3.4%)
(61.3% of them are naturalized citizens)
Year of entry for the foreign-born population in New Salem, Massachusetts
51995 to March 2000
01990 to 1994
01985 to 1989
21980 to 1984
41975 to 1979
01970 to 1974
01965 to 1969
9Before 1965
First ancestries reported:
English: 228 (18.6%)
Irish: 178 (14.5%)
French: 114 (9.3%)
French Canadian: 110 (9.0%)
Other: 97 (7.9%)
German: 83 (6.8%)
Italian: 72 (5.9%)
United States: 66 (5.4%)
Scottish: 60 (4.9%)
Polish: 50 (4.1%)
Swedish: 44 (3.6%)
Dutch: 15 (1.2%)
Russian: 14 (1.1%)
Lithuanian: 12 (1.0%)
Norwegian: 12 (1.0%)
Scotch-Irish: 10 (0.8%)
Portuguese: 8 (0.7%)
Swiss: 8 (0.7%)
Arab: 7 (0.6%)
Greek: 7 (0.6%)
Welsh: 7 (0.6%)
Hungarian: 6 (0.5%)
Czech: 4 (0.3%)
Subsaharan African: 4 (0.3%)
West Indian: 4 (0.3%)
Danish: 3 (0.2%)
Ukrainian: 1 (0.08%)
Most common places of birth for foreign-born residents (%):
Poland
New Salem:
20.0% (4)
Massachusetts:
1.8% (13,543)
Trinidad and Tobago
New Salem:
20.0% (4)
Massachusetts:
0.8% (6,005)
Philippines
New Salem:
15.0% (3)
Massachusetts:
1.0% (7,414)
Canada
New Salem:
15.0% (3)
Massachusetts:
5.2% (40,247)
United Kingdom
New Salem:
10.0% (2)
Massachusetts:
3.3% (25,403)
Germany
New Salem:
10.0% (2)
Massachusetts:
1.9% (14,883)
Cuba
New Salem:
10.0% (2)
Massachusetts:
0.5% (3,868)
Place of birth for U.S.-born residents:
This state: 641
Other state: 263
Northeast: 179
Midwest: 26
South: 36
West: 22
73% of New Salem residents lived in the same house 5 years ago. Out of people who lived in different houses, 28% lived in this county. Out of people who lived in different counties, 71% lived in Massachusetts.
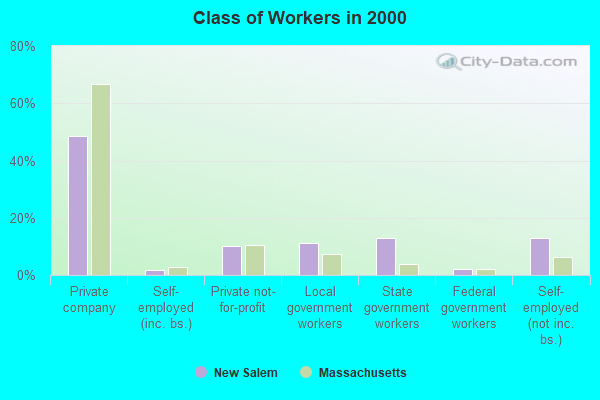
Education attainment for males 25 years and older:
No schooling: 0
Nursery to 4th grade: 0
5th and 6th grade: 0
7th and 8th grade: 10
9th grade: 5
10th grade: 2
11th grade: 4
12th grade, no diploma: 5
High school graduate (or equivalency): 88
Less than 1 year of college: 25
Some college more than 1 year, no degree: 55
Associate degree: 17
Bachelor's degree: 85
Master's degree: 28
Professional school degree: 10
Doctorate degree: 12
Education attainment for females 25 years and older:
No schooling: 0
Nursery to 4th grade: 0
5th and 6th grade: 5
7th and 8th grade: 1
9th grade: 4
10th grade: 4
11th grade: 10
12th grade, no diploma: 4
High school graduate (or equivalency): 78
Less than 1 year of college: 21
Some college more than 1 year, no degree: 42
Associate degree: 27
Bachelor's degree: 80
Master's degree: 41
Professional school degree: 2
Doctorate degree: 8
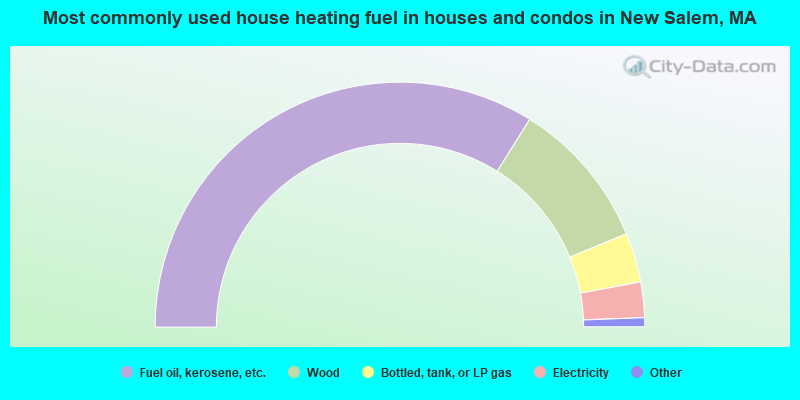
Housing units in structures:
One, detached: 404
One, attached: 5
Two: 6
3 or 4: 2
Mobile homes: 5
Housing units lacking complete plumbing facilities: 3.3%
Housing units lacking complete kitchen facilities: 2.8%