New Stanton, PA (Pennsylvania) Houses and Residents
| New Stanton: | $246,245 |
| Pennsylvania: | $245,500 |
Total population: 2,141 (Urban population: 1,575, Rural population: 327 (all nonfarm))
Houses: 1,113 (1,018 occupied: 628 owner occupied, 404 renter occupied)
| % of renters here: | 39% |
| State: | 31% |
Housing density: 283 houses/condos per square mile
Median price asked for vacant for-sale houses and condos in 2022: $143,606.
Median contract rent in 2022: $866 (lower quartile is $767, upper quartile is $944)
Median rent asked for vacant for-rent units in 2022: $567
Median gross rent in New Stanton, PA in 2022: $1,034
Housing units in New Stanton with a mortgage: 423 (29 second mortgage, 0 home equity loan, 22 both second mortgage and home equity loan)
Houses without a mortgage: 55
Median household income for houses/condos with a mortgage: $105,198
Median household income for apartments without a mortgage: $71,284
Median monthly housing costs: $1,071
Compare current foreclosures near New Stanton, PA:
| Photo | Address | Area | Beds / Baths | Price | Details |
|---|---|---|---|---|---|

|
#1
Pagano Dr
New Stanton, PA 15672
|
2,560 sq. feet
|
- baths - beds |
show details | |

|
#2
Madison Heights Rd
New Stanton, PA 15672
|
- sq. feet
|
- baths - beds |
show details | |

|
#3
Collins St
Mckeesport, PA 15132
|
1,176 sq. feet
|
1 baths 3 beds |
$34,500
|
show details |

|
#4
Wheeler Ln
Latrobe, PA 15650
|
2,212 sq. feet
|
2 baths 3 beds |
$42,500
|
show details |

|
#5
Pittsburgh St
West Newton, PA 15089
|
1,193 sq. feet
|
1 baths 3 beds |
$187,500
|
show details |

|
#6
Coal St
Dunlevy, PA 15432
|
1,740 sq. feet
|
1 baths 3 beds |
$114,500
|
show details |

|
#7
S 4th St
West Newton, PA 15089
|
1,850 sq. feet
|
1 baths 4 beds |
$197,900
|
show details |

|
#8
Blind Ln
Belle Vernon, PA 15012
|
1,548 sq. feet
|
2 baths 3 beds |
$67,500
|
show details |

|
#9
S Pittsburgh St
Connellsville, PA 15425
|
4,572 sq. feet
|
3 baths 5 beds |
$59,900
|
show details |

|
#10
Leslie St
East Mc Keesport, PA 15035
|
1,144 sq. feet
|
1 baths 2 beds |
$54,900
|
show details |
| Photo | Address | Area | Beds / Baths | Price | Details |
|---|---|---|---|---|---|

|
#11
Washington St
Mount Pleasant, PA 15666
|
1,472 sq. feet
|
1 baths 3 beds |
$79,900
|
show details |

|
#12
Punta Gorda St
East Mc Keesport, PA 15035
|
1,200 sq. feet
|
1 baths 3 beds |
$165,500
|
show details |

|
#13
9th Ave
Elizabeth, PA 15037
|
1,554 sq. feet
|
1 baths 3 beds |
$165,000
|
show details |

|
#14
Chanticleer Cir
New Stanton, PA 15672
|
- sq. feet
|
- baths - beds |
show details | |

|
#15
25th St
Mckeesport, PA 15132
|
1,024 sq. feet
|
1 baths 2 beds |
$44,900
|
show details |

|
#16
Old Concord Rd
Monroeville, PA 15146
|
1,467 sq. feet
|
2 baths 3 beds |
show details | |

|
#17
Hillsdale Dr
Monroeville, PA 15146
|
1,728 sq. feet
|
3 baths 3 beds |
show details | |

|
#18
Diehl Dr
Mckeesport, PA 15132
|
1,007 sq. feet
|
1 baths 3 beds |
show details | |

|
#19
Fawcett Ave
Mckeesport, PA 15131
|
1,318 sq. feet
|
2 baths 3 beds |
show details | |

|
#20
Highland Ave
Pitcairn, PA 15140
|
928 sq. feet
|
1 baths 2 beds |
show details |
| Photo | Address | Area | Beds / Baths | Price | Details |
|---|---|---|---|---|---|

|
#21
Wylie Ave
Clairton, PA 15025
|
1,134 sq. feet
|
1 baths 2 beds |
show details | |

|
#22
Fawcett Ave
Mckeesport, PA 15131
|
2,092 sq. feet
|
2 baths 3 beds |
show details | |

|
#23
S Water St
Elizabeth, PA 15037
|
2,172 sq. feet
|
1 baths 3 beds |
show details | |

|
#24
Cedarhurst Dr
North Versailles, PA 15137
|
1,415 sq. feet
|
1 baths 3 beds |
show details | |

|
#25
2nd St
Mckeesport, PA 15132
|
1,504 sq. feet
|
1 baths 3 beds |
show details | |

|
#26
8th Ave
Elizabeth, PA 15037
|
1,016 sq. feet
|
2 baths 3 beds |
show details | |

|
#27
Foxboro Dr
Monroeville, PA 15146
|
1,182 sq. feet
|
2 baths 3 beds |
show details | |

|
#28
Educational Dr
Mckeesport, PA 15131
|
1,514 sq. feet
|
2 baths 3 beds |
show details | |

|
#29
Baker Ave
Clairton, PA 15025
|
1,248 sq. feet
|
1 baths 3 beds |
show details | |

|
#30
Maryellen Dr
North Versailles, PA 15137
|
1,163 sq. feet
|
1 baths 3 beds |
show details |
| Photo | Address | Area | Beds / Baths | Price | Details |
|---|---|---|---|---|---|

|
#31
Scenery Dr
Elizabeth, PA 15037
|
1,329 sq. feet
|
1 baths 2 beds |
show details | |

|
#32
Cypress Dr
Mckeesport, PA 15131
|
1,039 sq. feet
|
1 baths 2 beds |
show details | |

|
#33
Walnut St
Mckeesport, PA 15132
|
1,012 sq. feet
|
1 baths 2 beds |
show details | |

|
#34
N Broadway Ave
North Versailles, PA 15137
|
1,200 sq. feet
|
1 baths 4 beds |
show details | |

|
#35
Main St
Latrobe, PA 15650
|
1,256 sq. feet
|
1 baths 3 beds |
show details | |

|
#36
Thompson Ave
Clairton, PA 15025
|
1,200 sq. feet
|
2 baths 3 beds |
show details | |

|
#37
Manown Rd
Monongahela, PA 15063
|
936 sq. feet
|
1 baths 3 beds |
show details | |

|
#38
Old Trail Rd
Irwin, PA 15642
|
1,490 sq. feet
|
2 baths 4 beds |
show details | |

|
#39
Constitution Cir
Clairton, PA 15025
|
1,064 sq. feet
|
1 baths 3 beds |
show details | |

|
#40
Riverview St
Mckeesport, PA 15132
|
1,670 sq. feet
|
1 baths 2 beds |
show details |
| Photo | Address | Area | Beds / Baths | Price | Details |
|---|---|---|---|---|---|

|
#41
Hemlock Rd
Trafford, PA 15085
|
- sq. feet
|
1 baths 3 beds |
show details | |

|
#42
Flagler St
Mckeesport, PA 15132
|
1,132 sq. feet
|
2 baths 3 beds |
show details | |

|
#43
Broadway Ave
North Versailles, PA 15137
|
1,536 sq. feet
|
2 baths 3 beds |
show details | |

|
#44
8th St
Pitcairn, PA 15140
|
2,502 sq. feet
|
2 baths 6 beds |
show details | |

|
#45
Broadway St
East Mc Keesport, PA 15035
|
1,100 sq. feet
|
2 baths 2 beds |
show details | |

|
#46
Halcomb Ave
Clairton, PA 15025
|
2,790 sq. feet
|
4 baths 8 beds |
show details | |

|
#47
Catalina Dr
Monroeville, PA 15146
|
2,189 sq. feet
|
3 baths 4 beds |
show details | |

|
#48
Elm St
Mckeesport, PA 15133
|
1,446 sq. feet
|
2 baths 2 beds |
show details | |

|
#49
9th Ave
Elizabeth, PA 15037
|
1,794 sq. feet
|
2 baths 3 beds |
show details | |

|
Check over 1 million property listings on Foreclosure.com!
|
browse all offers | |||


 | Exurb of the Week: New Stanton (16 replies) |
| Are people in Pennsylvania happy about infrastructure? (38 replies) |
| Pittsburgh Metro Automotive Manufacturing History (48 replies) |
| PA 2020 Census Population (79 replies) |
| More Allegheny County Homicides Outside Than In The City 2019 (70 replies) |
| Exurb of the Week: Youngwood (9 replies) |

Median year apartment built: 1980
Household type by relationship:
Households: 2,416- Male householders: 562 (122 living alone), Female householders: 445 (111 living alone)
538 spouses (538 opposite-sex spouses), 129 unmarried partners, (124 opposite-sex unmarried partners), 620 children (581 natural, 33 adopted, 5 stepchildren), 12 grandchildren, 4 brothers or sisters, 58 parents, 0 foster children, 4 other relatives, 37 non-relatives
- In group quarters: 1
Size of family households: 331 2-persons, 109 3-persons, 162 4-persons, 42 5-persons, 3 6-persons.
Size of nonfamily households: 227 1-person, 158 2-persons, 2 3-persons.
430 married couples with children.
54 single-parent households (30 men, 24 women).
96.8% of residents of New Stanton speak English at home.
0.3% of residents speak Spanish at home (100% don't speak English at all).
1.9% of residents speak other Indo-European language at home (100% speak English very well).
0.2% of residents speak Asian or Pacific Island language at home (100% speak English very well).
Foreign born population: 68 (2.8%)
(86.8% of them are naturalized citizens)
| Here: | 8.0 |
| State: | 6.8 |
| Here: | 4.9 |
| State: | 4.3 |

- Bedrooms in owner-occupied houses and condos in New Stanton, Pennsylvania
- 0no bedroom
- 91 bedroom
- 652 bedrooms
- 2983 bedrooms
- 2274 bedrooms
- 305+ bedrooms

- Bedrooms in renter-occupied apartments in New Stanton, Pennsylvania
- 0no bedroom
- 961 bedroom
- 3002 bedrooms
- 43 bedrooms
- 54 bedrooms
- 05+ bedrooms

- Cars and other vehicles available in New Stanton in owner-occupied houses/condos
- 12no vehicle
- 1031 vehicle
- 2942 vehicles
- 1653 vehicles
- 254 vehicles
- 295+ vehicles

- Cars and other vehicles available in New Stanton in renter-occupied apartments
- 42no vehicle
- 2031 vehicle
- 1252 vehicles
- 253 vehicles
- 04 vehicles
- 95+ vehicles

- Rooms in owner-occupied houses in New Stanton, Pennsylvania
- 01 room
- 02 rooms
- 03 rooms
- 234 rooms
- 445 rooms
- 836 rooms
- 1097 rooms
- 1148 rooms
- 2569+ rooms

- Rooms in renter-occupied apartments in New Stanton, Pennsylvania
- 01 room
- 112 rooms
- 783 rooms
- 804 rooms
- 1565 rooms
- 466 rooms
- 287 rooms
- 08 rooms
- 59+ rooms


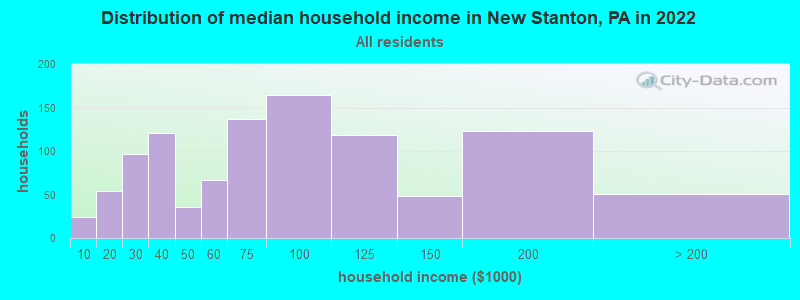
New Stanton, PA household income distribution

- 24Less than $10,000
- 54$10,000 to $19,999
- 96$20,000 to $29,999
- 121$30,000 to $39,999
- 36$40,000 to $49,999
- 67$50,000 to $59,999
- 137$60,000 to $74,999
- 164$75,000 to $99,999
- 118$100,000 to $124,999
- 48$125,000 to $149,999
- 123$150,000 to $199,999
- 51$200,000 or more
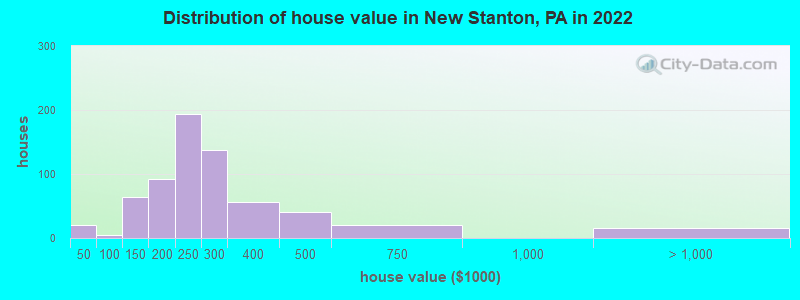
Home value of owner - occupied houses in 2022 in New Stanton, PA
-
- 7Less than $10,000
- 3$10,000 to $14,999
- 6$15,000 to $19,999
- 2$30,000 to $34,999
- 4$50,000 to $59,999
- 38$100,000 to $124,999
- 26$125,000 to $149,999
- 12$150,000 to $174,999
- 79$175,000 to $199,999
- 194$200,000 to $249,999
- 137$250,000 to $299,999
- 56$300,000 to $399,999
- 39$400,000 to $499,999
- 20$500,000 to $749,999
- 14$1,000,000 to $1,499,999
Rent paid by renters in 2022 in New Stanton, PA
-
- 17$150 to $199
- 2$350 to $399
- 6$400 to $449
- 10$450 to $499
- 7$500 to $549
- 1$550 to $599
- 15$600 to $649
- 13$650 to $699
- 19$700 to $749
- 27$750 to $799
- 122$800 to $899
- 65$900 to $999
- 27$1,000 to $1,249
- 24No cash rent


Percentage of workers working in this county: 80.2%
Number of people working at home: 164 (13.1% of all workers)
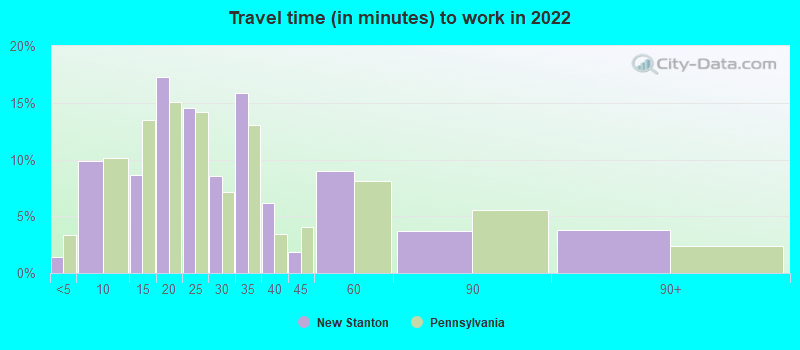
Travel time to work (commute)
- Less than 5 minutes: 38
- 5 to 9 minutes: 122
- 10 to 14 minutes: 105
- 15 to 19 minutes: 111
- 20 to 24 minutes: 236
- 25 to 29 minutes: 112
- 30 to 34 minutes: 139
- 35 to 39 minutes: 56
- 40 to 44 minutes: 44
- 45 to 59 minutes: 49
- 60 to 89 minutes: 50
- 90 or more minutes: 22
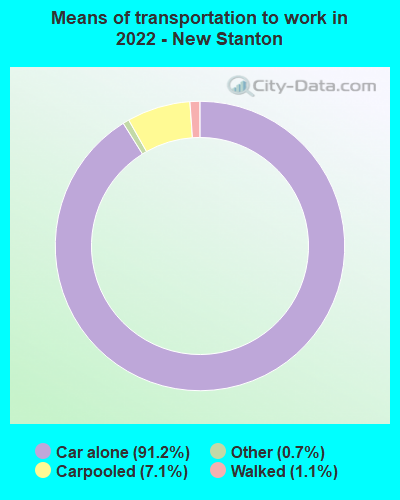
Means of transportation to work:
- Drove a car alone: 3,812 (84.3%)
- Carpooled: 312 (6.9%)
- Bus: 2 (0.0%)
- Taxi: 21 (0.5%)
- Walked: 53 (1.2%)
- Worked at home: 164 (3.6%)

- Unemployment by race in 2022
- Unemployment rate for White non-Hispanic residents
- 5.6%Males
- 1.6%Females

- Year of entry for the foreign-born population in New Stanton, Pennsylvania
- 102010 or later
- 132000 to 2009
- 101990 to 1999
- 01980 to 1989
- 121970 to 1979
- 5Before 1970

First ancestries reported:
- Italian: 223 (23.0%)
- German: 138 (14.2%)
- Irish: 126 (13.0%)
- American: 87 (9.0%)
- English: 69 (7.1%)
- Scottish: 47 (4.8%)
- Slovak: 38 (3.9%)
- Czechoslovakian: 22 (2.3%)
- French: 22 (2.3%)
- Polish: 17 (1.8%)
- Hungarian: 12 (1.2%)
- European: 10 (1.0%)
- Ukrainian: 8 (0.8%)
- Lithuanian: 6 (0.6%)
- Croatian: 4 (0.4%)
- Pennsylvania German: 4 (0.4%)
- Swiss: 4 (0.4%)
Most common places of birth for foreign-born residents (%):
| New Stanton: | 35.9% (23) |
| Pennsylvania: | 0.3% (2,427) |
| New Stanton: | 20.3% (13) |
| Pennsylvania: | 7.2% (67,704) |
| New Stanton: | 15.6% (10) |
| Pennsylvania: | 3.3% (31,542) |
| New Stanton: | 14.1% (9) |
| Pennsylvania: | 0.1% (645) |
| New Stanton: | 10.9% (7) |
| Pennsylvania: | 1.5% (13,823) |
| New Stanton: | 7.8% (5) |
| Pennsylvania: | 0.1% (564) |
Place of birth for U.S.-born residents:
- This state: 1,852
- Other state: 524
- Northeast: 118
- Midwest: 174
- South: 198
- West: 33
92.1% of New Stanton residents lived in the same house 1 years ago.
Out of people who lived in different houses, 38.1% lived in this county.
Out of people who lived in different counties, 69.1% lived in Pennsylvania.
| New Stanton: | 92.1% |
| State average: | 89.3% |
Education attainment for males 25 years and older:
- No schooling: 0
- Nursery to 4th grade: 0
- 5th and 6th grade: 0
- 7th and 8th grade: 0
- 9th grade: 12
- 10th grade: 0
- 11th grade: 9
- 12th grade, no diploma: 13
- High school graduate (or equivalency): 199
- Less than 1 year of college: 25
- Some college more than 1 year, no degree: 108
- Associate degree: 120
- Bachelor's degree: 251
- Master's degree: 105
- Professional school degree: 6
- Doctorate degree: 31

Education attainment for females 25 years and older:
- No schooling: 3
- Nursery to 4th grade: 0
- 5th and 6th grade: 0
- 7th and 8th grade: 0
- 9th grade: 2
- 10th grade: 0
- 11th grade: 5
- 12th grade, no diploma: 3
- High school graduate (or equivalency): 267
- Less than 1 year of college: 32
- Some college more than 1 year, no degree: 63
- Associate degree: 147
- Bachelor's degree: 196
- Master's degree: 61
- Professional school degree: 13
- Doctorate degree: 118


Housing units in structures:
- One, detached: 668
- One, attached: 63
- Two: 33
- 3 or 4: 47
- 5 to 9: 116
- 10 to 19: 80
- 20 to 49: 76
- 50 or more: 4
- Mobile homes: 24
Median worth of mobile homes: $57,865
Housing units lacking complete kitchen facilities in 2022: 1.7%
House/condo owner moved in on average 12 years ago
Renter moved in on average 3 years ago

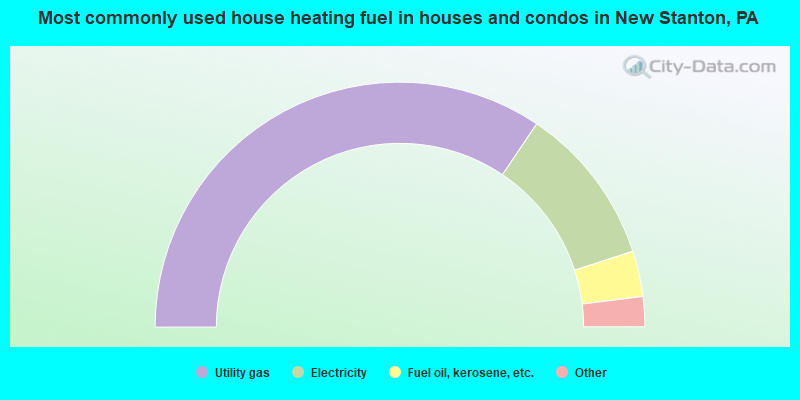
- 69.0%Utility gas
- 21.2%Electricity
- 6.0%Fuel oil, kerosene, etc.
- 2.3%Bottled, tank, or LP gas
- 1.5%Wood
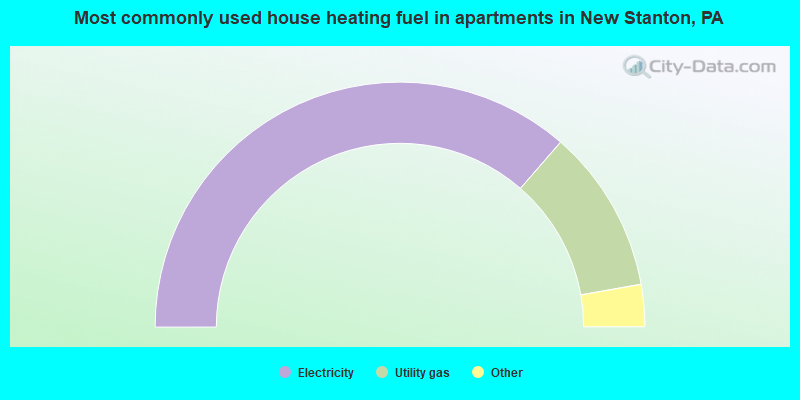
- 73.0%Electricity
- 21.7%Utility gas
- 3.0%Bottled, tank, or LP gas
- 1.3%No fuel used
- 1.0%Fuel oil, kerosene, etc.
Private vs. public school enrollment:
| Here: | 0.0% |
| Pennsylvania: | 15.7% |
| Here: | 2.8% |
| Pennsylvania: | 13.4% |
| Here: | 38.2% |
| Pennsylvania: | 39.8% |


