New Tulsa, OK (Oklahoma) Houses and Residents
| New Tulsa: | $170,476 |
| Oklahoma: | $191,700 |
Total population: 661 (Urban population: 515, Rural population: 21 (all nonfarm))
Houses: 191 (185 occupied: 159 owner occupied, 26 renter occupied)
| % of renters here: | 14% |
| State: | 35% |
Housing density: 227 houses/condos per square mile
Median price asked for vacant for-sale houses and condos in 2022 in this county: $209,080.
Median contract rent in 2022: $980 (lower quartile is $604, upper quartile is $1,145)
Median gross rent in New Tulsa, OK in 2022: $1,124
Housing units in New Tulsa with a mortgage: 27 (0 second mortgage, 4 home equity loan, 0 both second mortgage and home equity loan)
Houses without a mortgage: 13


 | Relocating to Tulsa - HELP PLEASE!! (20 replies) |
| Interracial Tulsa (26 replies) |

Household type by relationship:
Households: 72,766- In family households: 65,197 (15,784 male householders, 4,921 female householders)
16,642 spouses, 22,340 children (19,991 natural, 769 adopted, 1,580 stepchildren), 1,851 grandchildren, 432 brothers or sisters, 548 parents, foster children, 726 other relatives, 1,465 non-relatives
- In nonfamily households: 7,569 (3,045 male householders (2,386 living alone)), 3,128 female householders (2,673 living alone)), 1,396 nonrelatives
- In group quarters: 319 (273 institutionalized population)
11,675 married couples with children.
2,970 single-parent households (768 men, 2,202 women).
89.1% of residents of New Tulsa speak English at home.
8.0% of residents speak Spanish at home (87% speak English very well, 13% speak English well).
2.9% of residents speak other Indo-European language at home (50% speak English very well, 50% speak English well).
Foreign born population: 60 (7.4%)
(51.7% of them are naturalized citizens)
| Here: | 6.2 |
| State: | 6.1 |
| Here: | 6.0 |
| State: | 4.5 |

- Bedrooms in owner-occupied houses and condos in New Tulsa, Oklahoma
- 0no bedroom
- 61 bedroom
- 282 bedrooms
- 893 bedrooms
- 314 bedrooms
- 55+ bedrooms

- Bedrooms in renter-occupied apartments in New Tulsa, Oklahoma
- 0no bedroom
- 31 bedroom
- 62 bedrooms
- 83 bedrooms
- 64 bedrooms
- 35+ bedrooms

- Cars and other vehicles available in New Tulsa in owner-occupied houses/condos
- 8no vehicle
- 341 vehicle
- 902 vehicles
- 253 vehicles
- 04 vehicles
- 25+ vehicles

- Cars and other vehicles available in New Tulsa in renter-occupied apartments
- 0no vehicle
- 121 vehicle
- 92 vehicles
- 53 vehicles
- 04 vehicles
- 05+ vehicles

- Rooms in owner-occupied houses in New Tulsa, Oklahoma
- 01 room
- 22 rooms
- 63 rooms
- 274 rooms
- 525 rooms
- 216 rooms
- 207 rooms
- 228 rooms
- 99+ rooms

- Rooms in renter-occupied apartments in New Tulsa, Oklahoma
- 01 room
- 32 rooms
- 03 rooms
- 34 rooms
- 115 rooms
- 06 rooms
- 07 rooms
- 98 rooms
- 09+ rooms


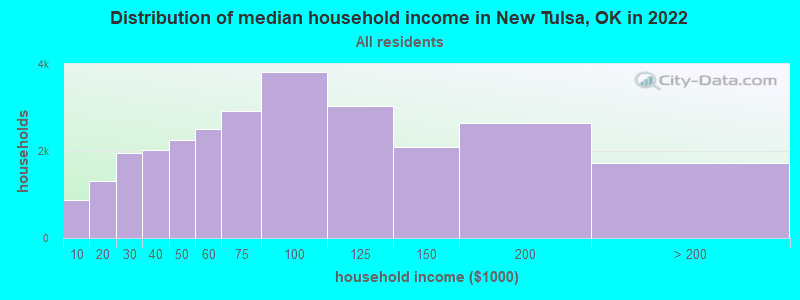
New Tulsa, OK household income distribution

- 876Less than $10,000
- 1,313$10,000 to $19,999
- 1,953$20,000 to $29,999
- 2,013$30,000 to $39,999
- 2,260$40,000 to $49,999
- 2,507$50,000 to $59,999
- 2,925$60,000 to $74,999
- 3,809$75,000 to $99,999
- 3,029$100,000 to $124,999
- 2,088$125,000 to $149,999
- 2,650$150,000 to $199,999
- 1,720$200,000 or more
Percentage of workers working in this county: 4.8%
Number of people working at home: 26 (9.8% of all workers)
Travel time to work (commute)
- Less than 5 minutes: 0
- 5 to 9 minutes: 12
- 10 to 14 minutes: 21
- 15 to 19 minutes: 27
- 20 to 24 minutes: 52
- 25 to 29 minutes: 22
- 30 to 34 minutes: 64
- 35 to 39 minutes: 6
- 40 to 44 minutes: 7
- 45 to 59 minutes: 3
- 60 to 89 minutes: 2
- 90 or more minutes: 4
Means of transportation to work:
- Drove a car alone: 196 (89.1%)
- Carpooled: 22 (10.0%)
- Motorcycle: 2 (0.9%)


- Year of entry for the foreign-born population in New Tulsa, Oklahoma
- 01995 to March 2000
- 01990 to 1994
- 41985 to 1989
- 31980 to 1984
- 01975 to 1979
- 61970 to 1974
- 01965 to 1969
- 0Before 1965

First ancestries reported:
- Other: 224 (42.4%)
- German: 84 (15.9%)
- Irish: 80 (15.2%)
- United States: 26 (4.9%)
- Dutch: 23 (4.4%)
- French: 23 (4.4%)
- Italian: 19 (3.6%)
- English: 16 (3.0%)
- Swedish: 9 (1.7%)
- Polish: 7 (1.3%)
- French Canadian: 4 (0.8%)
- Portuguese: 3 (0.6%)
- Scotch-Irish: 3 (0.6%)
- Czech: 2 (0.4%)
- Welsh: 2 (0.4%)
- West Indian: 2 (0.4%)
- Russian: 1 (0.2%)
Most common places of birth for foreign-born residents (%):
| New Tulsa: | 61.5% (8) |
| Oklahoma: | 42.5% (55,971) |
| New Tulsa: | 23.1% (3) |
| Oklahoma: | 0.4% (542) |
| New Tulsa: | 15.4% (2) |
| Oklahoma: | 0.4% (546) |
Place of birth for U.S.-born residents:
- This state: 292
- Other state: 228
- Northeast: 20
- Midwest: 58
- South: 78
- West: 72
38% of New Tulsa residents lived in the same house 5 years ago.
Out of people who lived in different houses, 14% lived in this county.
Out of people who lived in different counties, 70% lived in Oklahoma.
Education attainment for males 25 years and older:
- No schooling: 0
- Nursery to 4th grade: 0
- 5th and 6th grade: 4
- 7th and 8th grade: 6
- 9th grade: 2
- 10th grade: 10
- 11th grade: 12
- 12th grade, no diploma: 5
- High school graduate (or equivalency): 48
- Less than 1 year of college: 24
- Some college more than 1 year, no degree: 32
- Associate degree: 5
- Bachelor's degree: 7
- Master's degree: 0
- Professional school degree: 0
- Doctorate degree: 0

Education attainment for females 25 years and older:
- No schooling: 0
- Nursery to 4th grade: 0
- 5th and 6th grade: 0
- 7th and 8th grade: 2
- 9th grade: 4
- 10th grade: 8
- 11th grade: 8
- 12th grade, no diploma: 13
- High school graduate (or equivalency): 47
- Less than 1 year of college: 26
- Some college more than 1 year, no degree: 18
- Associate degree: 16
- Bachelor's degree: 7
- Master's degree: 0
- Professional school degree: 0
- Doctorate degree: 0


Housing units in structures:
- One, detached: 43
- One, attached: 2
- Mobile homes: 146
Median worth of mobile homes: $122,870

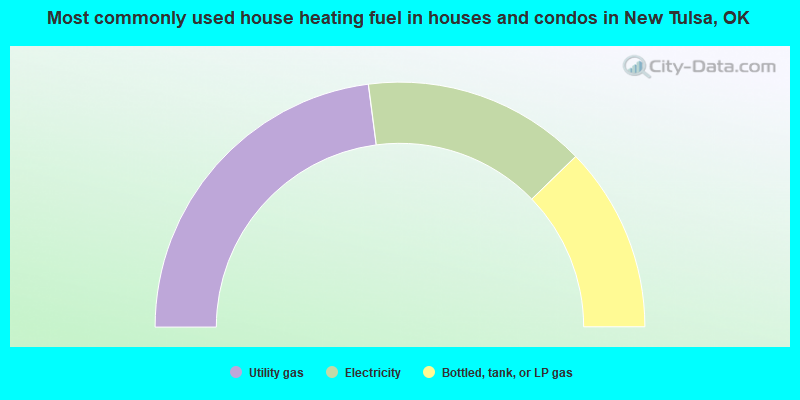
- 45.9%Utility gas
- 29.6%Electricity
- 24.5%Bottled, tank, or LP gas
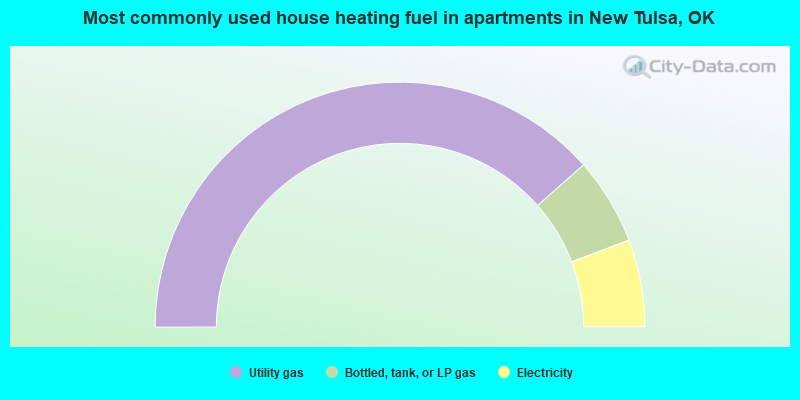
- 76.9%Utility gas
- 11.5%Bottled, tank, or LP gas
- 11.5%Electricity
Private vs. public school enrollment:
| Here: | 0.0% |
| Oklahoma: | 6.4% |
| Here: | 0.0% |
| Oklahoma: | 6.2% |
| Here: | 0.0% |
| Oklahoma: | 16.6% |


