Newark, IL (Illinois) Houses and Residents
| Newark: | $225,327 |
| Illinois: | $251,600 |
Mean price in 2022:
Detached houses: $452,715
Here: $452,715 State: $310,164
Total population: 1,017 (Urban population: 0, Rural population: 910 (all nonfarm))
Houses: 443 (423 occupied: 363 owner occupied, 59 renter occupied)
| % of renters here: | 14% |
| State: | 33% |
Housing density: 391 houses/condos per square mile
Median price asked for vacant for-sale houses and condos in 2022: $1,306,338.
Median contract rent in 2022: $694 (lower quartile is $529, upper quartile is $924)
Median gross rent in Newark, IL in 2022: $886
Housing units in Newark with a mortgage: 204 (15 second mortgage, 1 home equity loan, 10 both second mortgage and home equity loan)
Houses without a mortgage: 4
Median household income for houses/condos with a mortgage: $125,484
Median household income for apartments without a mortgage: $122,441
Median monthly housing costs: $1,087
Compare current foreclosures near Newark, IL:
| Photo | Address | Area | Beds / Baths | Price | Details |
|---|---|---|---|---|---|

|
#1
Plattville Rd
Newark, IL 60541
|
- sq. feet
|
- baths - beds |
show details | |

|
#2
E Liberty St
Newark, IL 60541
|
- sq. feet
|
- baths - beds |
show details | |

|
#3
Amsterdam Cir
Montgomery, IL 60538
|
2,793 sq. feet
|
2 baths 4 beds |
$459,900
|
show details |

|
#4
Whipple Pl
Newark, IL 60541
|
- sq. feet
|
- baths - beds |
show details | |

|
#5
Hollenback Rd
Newark, IL 60541
|
- sq. feet
|
- baths - beds |
show details | |

|
#6
Coy Park Dr
Newark, IL 60541
|
- sq. feet
|
- baths - beds |
show details | |

|
#7
Big Rock Ave
Plano, IL 60545
|
2,021 sq. feet
|
2 baths 3 beds |
show details | |

|
#8
Hearthstone Ave
Yorkville, IL 60560
|
2,282 sq. feet
|
3 baths 3 beds |
show details | |

|
#9
Kate Dr
Montgomery, IL 60538
|
2,667 sq. feet
|
3 baths 4 beds |
show details | |

|
#10
Stoneridge Ct
Yorkville, IL 60560
|
- sq. feet
|
2 baths 3 beds |
show details |
| Photo | Address | Area | Beds / Baths | Price | Details |
|---|---|---|---|---|---|

|
#11
Tamaira St
Plano, IL 60545
|
2,072 sq. feet
|
2 baths 4 beds |
show details | |

|
#12
Light Rd Apt 106
Oswego, IL 60543
|
724 sq. feet
|
1 baths 2 beds |
show details | |

|
#13
W Nettle Creek Dr
Morris, IL 60450
|
2,613 sq. feet
|
2 baths 4 beds |
show details | |

|
#14
S Cherry St
Somonauk, IL 60552
|
- sq. feet
|
2 baths 3 beds |
show details | |

|
#15
N Wolfe St
Sandwich, IL 60548
|
1,120 sq. feet
|
1 baths 3 beds |
show details | |

|
#16
Willoughby Ct Unit D
Yorkville, IL 60560
|
1,590 sq. feet
|
2 baths 3 beds |
show details | |

|
#17
Kristen Ct
Plano, IL 60545
|
2,500 sq. feet
|
3 baths 4 beds |
show details | |

|
#18
N 3739th Rd
Sheridan, IL 60551
|
- sq. feet
|
2 baths 4 beds |
show details | |

|
#19
Candlelight Cir
Montgomery, IL 60538
|
- sq. feet
|
2 baths 2 beds |
show details | |

|
#20
W Barberry Cir
Yorkville, IL 60560
|
- sq. feet
|
2 baths 3 beds |
show details |
| Photo | Address | Area | Beds / Baths | Price | Details |
|---|---|---|---|---|---|

|
#21
Homestead Dr
Yorkville, IL 60560
|
- sq. feet
|
3 baths 4 beds |
show details | |

|
#22
W Waverly St
Morris, IL 60450
|
1 sq. feet
|
1 baths 3 beds |
show details | |

|
#23
N State Route 23
Ottawa, IL 61350
|
- sq. feet
|
- baths - beds |
show details | |

|
#24
Mchugh Rd
Yorkville, IL 60560
|
- sq. feet
|
- baths - beds |
show details | |

|
#25
Artesian Way
Montgomery, IL 60538
|
- sq. feet
|
- baths - beds |
show details | |

|
#26
Fields Dr
Yorkville, IL 60560
|
- sq. feet
|
- baths - beds |
show details | |

|
#27
Aberdeen Dr
Montgomery, IL 60538
|
- sq. feet
|
- baths - beds |
show details | |

|
#28
E Kendall Dr Unit 207
Yorkville, IL 60560
|
- sq. feet
|
- baths - beds |
show details | |

|
#29
Mulhern Ct Apt 6
Yorkville, IL 60560
|
- sq. feet
|
- baths - beds |
show details | |

|
#30
Market Place Dr Unit 4212
Yorkville, IL 60560
|
- sq. feet
|
- baths - beds |
show details |
| Photo | Address | Area | Beds / Baths | Price | Details |
|---|---|---|---|---|---|

|
#31
Vaughey St Apt 3
Seneca, IL 61360
|
- sq. feet
|
- baths - beds |
show details | |

|
#32
E 2250th Rd
Ottawa, IL 61350
|
- sq. feet
|
- baths - beds |
show details | |

|
#33
E 2250th Rd
Ottawa, IL 61350
|
- sq. feet
|
- baths - beds |
show details | |

|
#34
Tower Ln Apt A
Yorkville, IL 60560
|
- sq. feet
|
- baths - beds |
show details | |

|
#35
Shadowbrook Ct
Oswego, IL 60543
|
- sq. feet
|
- baths - beds |
show details | |

|
#36
Church St
Yorkville, IL 60560
|
- sq. feet
|
- baths - beds |
show details | |

|
#37
E Main St
Yorkville, IL 60560
|
- sq. feet
|
- baths - beds |
show details | |

|
#38
Hawk Hollow Dr
Yorkville, IL 60560
|
- sq. feet
|
- baths - beds |
show details | |

|
#39
Hawk Hollow Dr
Yorkville, IL 60560
|
- sq. feet
|
- baths - beds |
show details | |

|
#40
Hawk Hollow Dr
Yorkville, IL 60560
|
- sq. feet
|
- baths - beds |
show details |
| Photo | Address | Area | Beds / Baths | Price | Details |
|---|---|---|---|---|---|

|
#41
Bluebird Ln
Yorkville, IL 60560
|
- sq. feet
|
- baths - beds |
show details | |

|
#42
Hydraulic St
Yorkville, IL 60560
|
- sq. feet
|
- baths - beds |
show details | |

|
#43
Violet Ln
Joliet, IL 60431
|
- sq. feet
|
- baths - beds |
show details | |

|
#44
Caddlelight Cir
Montgomery, IL 60538
|
- sq. feet
|
- baths - beds |
show details | |

|
#45
Mill St
Yorkville, IL 60560
|
- sq. feet
|
- baths - beds |
show details | |

|
#46
Clarence Rd
Joliet, IL 60431
|
- sq. feet
|
- baths - beds |
show details | |

|
#47
Walter St Apt A
Yorkville, IL 60560
|
- sq. feet
|
- baths - beds |
show details | |

|
#48
Wellington Dr
Joliet, IL 60431
|
- sq. feet
|
- baths - beds |
show details | |

|
#49
Eva Ave
Joliet, IL 60431
|
- sq. feet
|
- baths - beds |
show details | |

|
Check over 1 million property listings on Foreclosure.com!
|
browse all offers | |||

Latest news about housing in Newark, IL collected exclusively by city-data.com from local newspapers, TV, and radio stations

 | Naperville, IL versus Doylestown, PA (7 replies) |
| Would you consider NW Indiana if transit to Chicago improved? (133 replies) |
| Suburbia, the next slum? (303 replies) |
| acreage + good school district (15 replies) |
| Small town help near Chicago (9 replies) |

Median year apartment built: 1970
Household type by relationship:
Households: 1,194- Male householders: 174 (32 living alone), Female householders: 250 (46 living alone)
297 spouses (297 opposite-sex spouses), 54 unmarried partners, (54 opposite-sex unmarried partners), 370 children (363 natural, 6 adopted, 0 stepchildren), 7 grandchildren, 19 brothers or sisters, 10 parents, 0 foster children, 0 other relatives, 10 non-relatives
Size of family households: 164 2-persons, 90 3-persons, 47 4-persons, 16 5-persons, 5 6-persons, 9 7-or-more-persons.
Size of nonfamily households: 90 1-person, 8 2-persons.
162 married couples with children.
27 single-parent households (0 men, 27 women).
92.3% of residents of Newark speak English at home.
5.1% of residents speak Spanish at home (89% speak English very well, 11% speak English well).
2.2% of residents speak other Indo-European language at home (100% speak English very well).
Foreign born population: 34 (2.8%)
(100.0% of them are naturalized citizens)
| Here: | 7.5 |
| State: | 6.4 |
| Here: | 4.2 |
| State: | 4.1 |

- Bedrooms in owner-occupied houses and condos in Newark, Illinois
- 3no bedroom
- 31 bedroom
- 352 bedrooms
- 2243 bedrooms
- 664 bedrooms
- 325+ bedrooms

- Bedrooms in renter-occupied apartments in Newark, Illinois
- 0no bedroom
- 241 bedroom
- 152 bedrooms
- 113 bedrooms
- 74 bedrooms
- 25+ bedrooms

- Cars and other vehicles available in Newark in owner-occupied houses/condos
- 5no vehicle
- 461 vehicle
- 1792 vehicles
- 973 vehicles
- 154 vehicles
- 215+ vehicles

- Cars and other vehicles available in Newark in renter-occupied apartments
- 8no vehicle
- 271 vehicle
- 192 vehicles
- 53 vehicles
- 14 vehicles
- 05+ vehicles

- Rooms in owner-occupied houses in Newark, Illinois
- 31 room
- 02 rooms
- 03 rooms
- 144 rooms
- 175 rooms
- 956 rooms
- 617 rooms
- 518 rooms
- 1219+ rooms

- Rooms in renter-occupied apartments in Newark, Illinois
- 01 room
- 72 rooms
- 163 rooms
- 74 rooms
- 85 rooms
- 36 rooms
- 77 rooms
- 28 rooms
- 89+ rooms


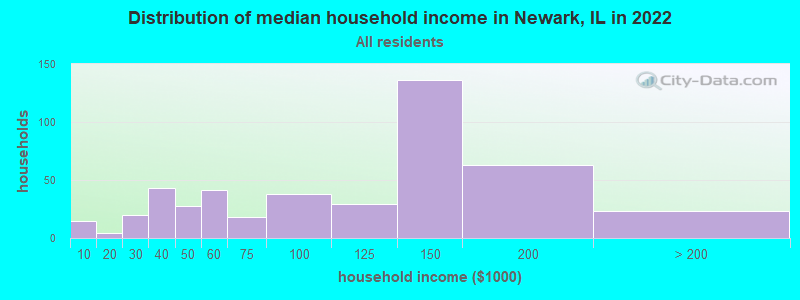
Newark, IL household income distribution

- 15Less than $10,000
- 4$10,000 to $19,999
- 20$20,000 to $29,999
- 43$30,000 to $39,999
- 28$40,000 to $49,999
- 41$50,000 to $59,999
- 18$60,000 to $74,999
- 38$75,000 to $99,999
- 29$100,000 to $124,999
- 136$125,000 to $149,999
- 63$150,000 to $199,999
- 23$200,000 or more
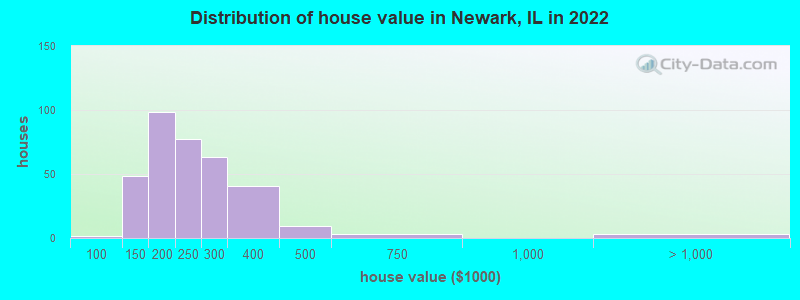
Home value of owner - occupied houses in 2022 in Newark, IL
-
- 1$50,000 to $59,999
- 9$100,000 to $124,999
- 39$125,000 to $149,999
- 19$150,000 to $174,999
- 78$175,000 to $199,999
- 77$200,000 to $249,999
- 63$250,000 to $299,999
- 40$300,000 to $399,999
- 9$400,000 to $499,999
- 3$500,000 to $749,999
- 3$2,000,000 or more
Rent paid by renters in 2022 in Newark, IL
-
- 2$250 to $299
- 6$400 to $449
- 1$450 to $499
- 8$600 to $649
- 5$650 to $699
- 1$750 to $799
- 10$800 to $899
- 3$900 to $999
- 5$1,000 to $1,249
- 4$1,500 to $1,999
- 12No cash rent


Percentage of workers working in this county: 71.3%
Number of people working at home: 131 (20.1% of all workers)
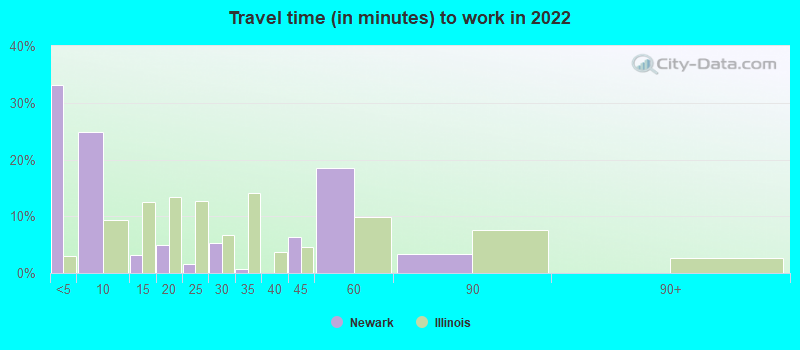
Travel time to work (commute)
- Less than 5 minutes: 99
- 5 to 9 minutes: 33
- 10 to 14 minutes: 1
- 15 to 19 minutes: 110
- 20 to 24 minutes: 57
- 25 to 29 minutes: 22
- 30 to 34 minutes: 110
- 35 to 39 minutes: 6
- 40 to 44 minutes: 25
- 45 to 59 minutes: 44
- 60 to 89 minutes: 33
- 90 or more minutes: 25
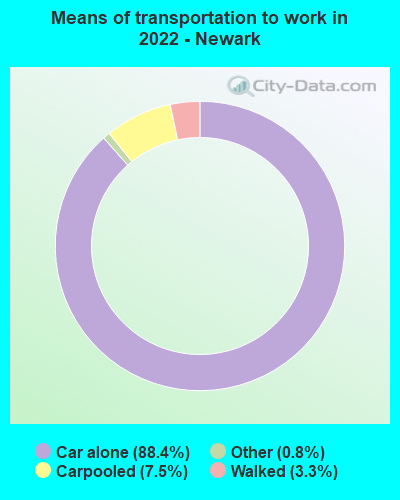
Means of transportation to work:
- Drove a car alone: 308 (66.7%)
- Carpooled: 27 (5.8%)
- Taxi: 3 (0.6%)
- Walked: 11 (2.4%)
- Worked at home: 131 (28.4%)

- Unemployment by race in 2022
- Unemployment rate for White non-Hispanic residents
- 0.8%Males
- 1.3%Females

- Year of entry for the foreign-born population in Newark, Illinois
- 12010 or later
- 62000 to 2009
- 111990 to 1999
- 121980 to 1989
- 21970 to 1979
- 4Before 1970

First ancestries reported:
- German: 98 (23.2%)
- English: 95 (22.5%)
- Norwegian: 69 (16.4%)
- European: 31 (7.3%)
- Albanian: 25 (5.9%)
- American: 25 (5.9%)
- Irish: 17 (4.0%)
- Italian: 7 (1.7%)
- Russian: 6 (1.4%)
- Latvian: 5 (1.2%)
- Polish: 5 (1.2%)
- Hungarian: 4 (0.9%)
- Croatian: 3 (0.7%)
- Dutch: 1 (0.2%)
Most common places of birth for foreign-born residents (%):
| Newark: | 20.0% (7) |
| Illinois: | 0.2% (4,211) |
| Newark: | 14.3% (5) |
| Illinois: | 0.1% (1,568) |
| Newark: | 14.3% (5) |
| Illinois: | 9.2% (166,409) |
| Newark: | 14.3% (5) |
| Illinois: | 0.5% (9,834) |
| Newark: | 14.3% (5) |
| Illinois: | 1.3% (22,793) |
| Newark: | 14.3% (5) |
| Illinois: | 34.7% (626,958) |
Place of birth for U.S.-born residents:
- This state: 901
- Other state: 279
- Northeast: 11
- Midwest: 152
- South: 41
- West: 63
93.8% of Newark residents lived in the same house 1 years ago.
Out of people who lived in different houses, 32.4% lived in this county.
Out of people who lived in different counties, 64.1% lived in Illinois.
| Newark: | 93.8% |
| State average: | 88.3% |
Education attainment for males 25 years and older:
- No schooling: 15
- Nursery to 4th grade: 0
- 5th and 6th grade: 0
- 7th and 8th grade: 5
- 9th grade: 0
- 10th grade: 6
- 11th grade: 2
- 12th grade, no diploma: 4
- High school graduate (or equivalency): 124
- Less than 1 year of college: 27
- Some college more than 1 year, no degree: 72
- Associate degree: 47
- Bachelor's degree: 33
- Master's degree: 23
- Professional school degree: 0
- Doctorate degree: 0

Education attainment for females 25 years and older:
- No schooling: 5
- Nursery to 4th grade: 0
- 5th and 6th grade: 0
- 7th and 8th grade: 0
- 9th grade: 0
- 10th grade: 1
- 11th grade: 0
- 12th grade, no diploma: 10
- High school graduate (or equivalency): 135
- Less than 1 year of college: 48
- Some college more than 1 year, no degree: 33
- Associate degree: 54
- Bachelor's degree: 163
- Master's degree: 13
- Professional school degree: 0
- Doctorate degree: 2


Housing units in structures:
- One, detached: 403
- Two: 3
- 10 to 19: 7
- 20 to 49: 29
Housing units lacking complete kitchen facilities in 2022: 1.9%
House/condo owner moved in on average 18 years ago
Renter moved in on average 9 years ago

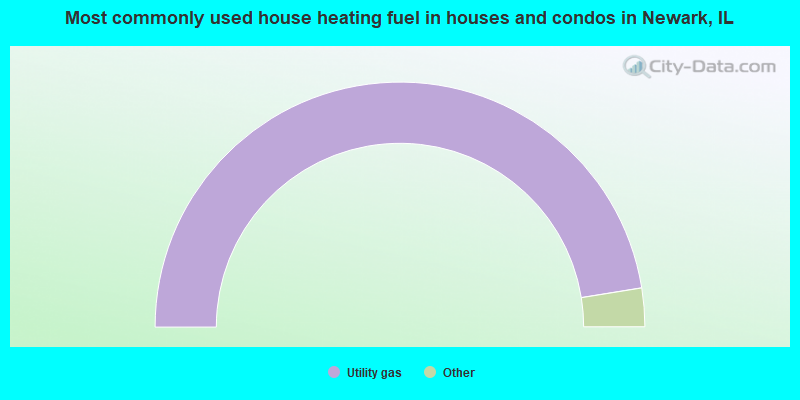
- 94.9%Utility gas
- 3.1%Electricity
- 1.4%Bottled, tank, or LP gas
- 0.6%Wood
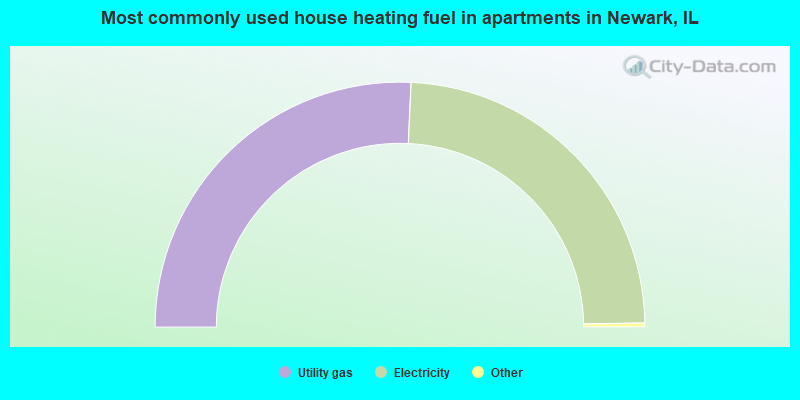
- 51.7%Utility gas
- 48.3%Electricity
Private vs. public school enrollment:
| Here: | 33.8% |
| Illinois: | 13.3% |
| Here: | 40.4% |
| Illinois: | 9.9% |
| Here: | 19.6% |
| Illinois: | 27.4% |


