Newark, OH (Ohio) Houses and Residents
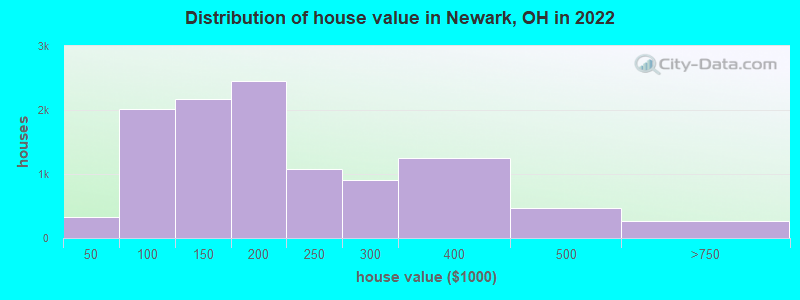
Estimated median house or condo value in 2022: $185,855 (it was $84,900 in 2000 )
Newark:
$185,855Ohio:
$204,100
Lower value quartile - upper value quartile: $122,847 - $260,953Mean price in 2022: Detached houses: $192,474 Here:
$192,474State:
$254,366
Townhouses or other attached units: $244,845 Here:
$244,845State:
$225,733
In 2-unit structures: $162,573 Here:
$162,573State:
$144,384
In 3-to-4-unit structures: $211,891 Here:
$211,891State:
$203,002
In 5-or-more-unit structures: $100,821 Here:
$100,821State:
$211,593
Mobile homes: $45,646 Here:
$45,646State:
$62,719
Total population: 47,839 (Urban population: 45,745, Rural population: 370 (all nonfarm) )
Houses: 22,372 (20,370 occupied: 11,512 owner occupied, 9,542 renter occupied )
% of renters here:
45%State:
33%
Housing density: 1,144 houses/condos per square mile
Median price asked for vacant for-sale houses and condos in 2022: $184,665.
Median contract rent in 2022: $685 (lower quartile is $520, upper quartile is $936)
Median rent asked for vacant for-rent units in 2022: $686
Median gross rent in Newark, OH in 2022: $863
Housing units in Newark with a mortgage: 7,278 (826 second mortgage, 4 home equity loan, 776 both second mortgage and home equity loan )Houses without a mortgage: 174
Median household income for houses/condos with a mortgage: $80,375
Median household income for apartments without a mortgage: $58,990
Median monthly housing costs: $908
Data:
Median house or condo value ($)
Median house or condo value ($ change since 2000)
Median house or condo value ($) - White
Median house or condo value ($) - Black or African American
Median house or condo value ($) - Asian
Median house or condo value ($) - Hispanic or Latino
Median house or condo value ($) - American Indian and Alaska Native
Median house or condo value ($) - Multirace
Median house or condo value ($) - Other Race
Median price asked for mobile homes ($)
Household density (households per square mile)
Mean house or condo value by units in structure - 1, detached ($)
Mean house or condo value by units in structure - 1, attached ($)
Mean house or condo value by units in structure - 2 ($)
Mean house or condo value by units in structure by units in structure - 3 or 4 ($)
Mean house or condo value by units in structure - 5 or more ($)
Mean house or condo value by units in structure - Boat, RV, van, etc. ($)
Mean house or condo value by units in structure - Mobile home ($)
Median contract rent ($)
Median contract rent - Lower quartile ($)
Median contract rent - Upper quartile ($)
Median gross rent ($)
Urban houses (%)
Rural houses (%)
Houses occupied (%)
Houses occupied (% change since 2000)
Houses owner occupied (%)
Houses owner occupied (% change since 2000)
Houses renter occupied (%)
Houses renter occupied (% change since 2000)
Vacant housing units - For rent (%)
Vacant housing units - For rent (% change since 2000)
Vacant housing units - For sale only (%)
Vacant housing units - For sale only (% change since 2000)
Vacant housing units - Rented or sold, not occupied (%)
Vacant housing units - Rented or sold, not occupied (% change since 2000)
Vacant housing units - For seasonal, recreational, or occasional use (%)
Vacant housing units - For seasonal, recreational, or occasional use (% change since 2000)
Vacant housing units - For migrant workers (%)
Vacant housing units - For migrant workers (% change since 2000)
Vacant housing units - Other vacant (%)
Vacant housing units - Other vacant (% change since 2000)
Median monthly housing costs ($)
Median household income for houses/condos with a mortgage ($)
Median household income for houses/condos without a mortgage ($)
Median household income ($)
Median household income ($) - White
Median household income ($) - Black or African American
Median household income ($) - Asian
Median household income ($) - Hispanic or Latino
Median household income ($) - American Indian and Alaska Native
Median household income ($) - Multirace
Median household income ($) - Other Race
Mortgage status - with mortgage (%)
Mortgage status - with second mortgage (%)
Mortgage status - with home equity loan (%)
Mortgage status - with both second mortgage and home equity loan (%)
Mortgage status - without a mortgage (%)
Median year house/condo built
Median year apartment built
Household type by relationship - Male householder living alone (%)
Household type by relationship - Male householder not living alone (%)
Household type by relationship - Female householder living alone (%)
Household type by relationship - Female householder not living alone (%)
Household type by relationship - Opposite-Sex spouse (%)
Household type by relationship - Same-Sex spouse (%)
Household type by relationship - Opposite-Sex unmarried partner (%)
Household type by relationship - Same-Sex unmarried partner (%)
Household type by relationship - In group quarters (%)
Size of family households - 2-person household (%)
Size of family households - 3-person household (%)
Size of family households - 4-person household (%)
Size of family households - 5-person household (%)
Size of family households - 6-person household (%)
Size of family households - 7-or-more-person household (%)
Size of nonfamily households - 1-person household (%)
Size of nonfamily households - 2-person household (%)
Size of nonfamily households - 3-person household (%)
Size of nonfamily households - 4-person household (%)
Size of nonfamily households - 5-person household (%)
Size of nonfamily households - 6-person household (%)
Size of nonfamily households - 7-or-moreperson household (%)
Year house built - Built 2010 or later (%)
Year house built - Built 2000 to 2009 (%)
Year house built - Built 1990 to 1999 (%)
Year house built - Built 1980 to 1989 (%)
Year house built - Built 1970 to 1979 (%)
Year house built - Built 1960 to 1969 (%)
Year house built - Built 1950 to 1959 (%)
Year house built - Built 1940 to 1949 (%)
Year house built - Built 1939 or earlier (%)
Median number of rooms in houses and condos
Median number of rooms in apartments
Median number of bedrooms in owner occupied houses
Mean number of bedrooms in owner occupied houses
Median number of bedrooms in renter occupied houses
Mean number of bedrooms in renter occupied houses
Median number of vehichles in owner occupied houses
Mean number of vehichles in owner occupied houses
Median number of vehichles in renter occupied houses
Mean number of vehichles in renter occupied houses
Rooms in owner-occupied houses - 1 room (%)
Rooms in owner-occupied houses - 2 rooms (%)
Rooms in owner-occupied houses - 3 rooms (%)
Rooms in owner-occupied houses - 4 rooms (%)
Rooms in owner-occupied houses - 5 rooms (%)
Rooms in owner-occupied houses - 6 rooms (%)
Rooms in owner-occupied houses - 7 rooms (%)
Rooms in owner-occupied houses - 8 rooms (%)
Rooms in owner-occupied houses - 9+ rooms (%)
Rooms in renter-occupied houses - 1 room (%)
Rooms in renter-occupied houses - 2 rooms (%)
Rooms in renter-occupied houses - 3 rooms (%)
Rooms in renter-occupied houses - 4 rooms (%)
Rooms in renter-occupied houses - 5 rooms (%)
Rooms in renter-occupied houses - 6 rooms (%)
Rooms in renter-occupied houses - 7 rooms (%)
Rooms in renter-occupied houses - 8 rooms (%)
Rooms in renter-occupied houses - 9+ rooms (%)
Bedrooms in owner-occupied houses - no bedrooms (%)
Bedrooms in owner-occupied houses - 1 bedroom (%)
Bedrooms in owner-occupied houses - 2 bedrooms (%)
Bedrooms in owner-occupied houses - 3 bedrooms (%)
Bedrooms in owner-occupied houses - 4 bedrooms (%)
Bedrooms in owner-occupied houses - 5+ bedrooms (%)
Bedrooms in renter-occupied houses - no bedrooms (%)
Bedrooms in renter-occupied houses - 1 bedroom (%)
Bedrooms in renter-occupied houses - 2 bedrooms (%)
Bedrooms in renter-occupied houses - 3 bedrooms (%)
Bedrooms in renter-occupied houses - 4 bedrooms (%)
Bedrooms in renter-occupied houses - 5+ bedrooms (%)
Vehicles available in owner-occupied houses - no vehicle available (%)
Vehicles available in owner-occupied houses - 1 vehicle available(%)
Vehicles available in owner-occupied houses - 2 Vehicles available (%)
Vehicles available in owner-occupied houses - 3 Vehicles available (%)
Vehicles available in owner-occupied houses - 4 Vehicles available (%)
Vehicles available in owner-occupied houses - 5+ Vehicles available (%)
Vehicles available in renter-occupied houses - no vehicle available (%)
Vehicles available in renter-occupied houses - 1 vehicle available (%)
Vehicles available in renter-occupied houses - 2 Vehicles available (%)
Vehicles available in renter-occupied houses - 3 Vehicles available (%)
Vehicles available in renter-occupied houses - 4 Vehicles available (%)
Vehicles available in renter-occupied houses - 5+ Vehicles available (%)
Housing units in structures - 1, detached (%)
Housing units in structures - 1, attached (%)
Housing units in structures - 2 (%)
Housing units in structures - 3 or 4 (%)
Housing units in structures - 5 to 9 (%)
Housing units in structures - 10 to 19 (%)
Housing units in structures - 20 to 49 (%)
Housing units in structures - 50 or more (%)
Housing units in structures - Mobile home (%)
Housing units in structures - Boat, RV, van, etc. (%)
Housing units in structures - Owners - 1, detached (%)
Housing units in structures - Owners - 1, attached (%)
Housing units in structures - Owners - 2 (%)
Housing units in structures - Owners - 3 or 4 (%)
Housing units in structures - Owners - 5 to 9 (%)
Housing units in structures - Owners - 10 to 19 (%)
Housing units in structures - Owners - 20 to 49 (%)
Housing units in structures - Owners - 50 or more (%)
Housing units in structures - Owners - Mobile home (%)
Housing units in structures - Owners - Boat, RV, van, etc. (%)
Housing units in structures - Renters - 1, detached (%)
Housing units in structures - Renters - 1, attached (%)
Housing units in structures - Renters - 2 (%)
Housing units in structures - Renters - 3 or 4 (%)
Housing units in structures - Renters - 5 to 9 (%)
Housing units in structures - Renters - 10 to 19 (%)
Housing units in structures - Renters - 20 to 49 (%)
Housing units in structures - Renters - 50 or more (%)
Housing units in structures - Renters - Mobile home (%)
Housing units in structures - Renters - Boat, RV, van, etc. (%)
House/condo owner moved in on average (years ago)
Renter moved in on average (years ago)
Year householder moved into unit - Moved in 1999 to March 2000 (%)
Year householder moved into unit - Moved in 1999 to March 2000 (%) - White
Year householder moved into unit - Moved in 1999 to March 2000 (%) - Black or African American
Year householder moved into unit - Moved in 1999 to March 2000 (%) - Asian
Year householder moved into unit - Moved in 1999 to March 2000 (%) - Hispanic or Latino
Year householder moved into unit - Moved in 1999 to March 2000 (%) - American Indian and Alaska Native
Year householder moved into unit - Moved in 1999 to March 2000 (%) - Multirace
Year householder moved into unit - Moved in 1999 to March 2000 (%) - Other Race
Year householder moved into unit - Moved in 1995 to 1998 (%)
Year householder moved into unit - Moved in 1995 to 1998 (%) - White
Year householder moved into unit - Moved in 1995 to 1998 (%) - Black or African American
Year householder moved into unit - Moved in 1995 to 1998 (%) - Asian
Year householder moved into unit - Moved in 1995 to 1998 (%) - Hispanic or Latino
Year householder moved into unit - Moved in 1995 to 1998 (%) - American Indian and Alaska Native
Year householder moved into unit - Moved in 1995 to 1998 (%) - Multirace
Year householder moved into unit - Moved in 1995 to 1998 (%) - Other Race
Year householder moved into unit - Moved in 1990 to 1994 (%)
Year householder moved into unit - Moved in 1990 to 1994 (%) - White
Year householder moved into unit - Moved in 1990 to 1994 (%) - Black or African American
Year householder moved into unit - Moved in 1990 to 1994 (%) - Asian
Year householder moved into unit - Moved in 1990 to 1994 (%) - Hispanic or Latino
Year householder moved into unit - Moved in 1990 to 1994 (%) - American Indian and Alaska Native
Year householder moved into unit - Moved in 1990 to 1994 (%) - Multirace
Year householder moved into unit - Moved in 1990 to 1994 (%) - Other Race
Year householder moved into unit - Moved in 1980 to 1989 (%)
Year householder moved into unit - Moved in 1980 to 1989 (%) - White
Year householder moved into unit - Moved in 1980 to 1989 (%) - Black or African American
Year householder moved into unit - Moved in 1980 to 1989 (%) - Asian
Year householder moved into unit - Moved in 1980 to 1989 (%) - Hispanic or Latino
Year householder moved into unit - Moved in 1980 to 1989 (%) - American Indian and Alaska Native
Year householder moved into unit - Moved in 1980 to 1989 (%) - Multirace
Year householder moved into unit - Moved in 1980 to 1989 (%) - Other Race
Year householder moved into unit - Moved in 1970 to 1979 (%)
Year householder moved into unit - Moved in 1970 to 1979 (%) - White
Year householder moved into unit - Moved in 1970 to 1979 (%) - Black or African American
Year householder moved into unit - Moved in 1970 to 1979 (%) - Asian
Year householder moved into unit - Moved in 1970 to 1979 (%) - Hispanic or Latino
Year householder moved into unit - Moved in 1970 to 1979 (%) - American Indian and Alaska Native
Year householder moved into unit - Moved in 1970 to 1979 (%) - Multirace
Year householder moved into unit - Moved in 1970 to 1979 (%) - Other Race
Year householder moved into unit - Moved in 1969 or earlier (%)
Year householder moved into unit - Moved in 1969 or earlier (%) - White
Year householder moved into unit - Moved in 1969 or earlier (%) - Black or African American
Year householder moved into unit - Moved in 1969 or earlier (%) - Asian
Year householder moved into unit - Moved in 1969 or earlier (%) - Hispanic or Latino
Year householder moved into unit - Moved in 1969 or earlier (%) - American Indian and Alaska Native
Year householder moved into unit - Moved in 1969 or earlier (%) - Multirace
Year householder moved into unit - Moved in 1969 or earlier (%) - Other Race
Housing units lacking complete plumbing facilities (%)
Housing units lacking complete kitchen facilities (%)
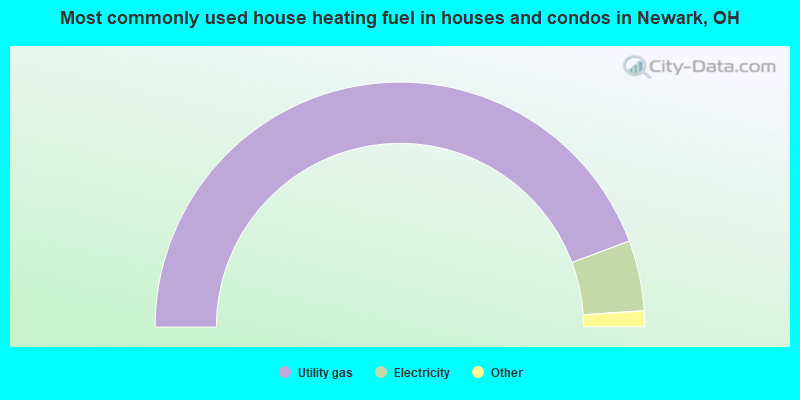
House heating fuel used in houses and condos - Utility gas (%)
House heating fuel used in houses and condos - Bottled, tank, or LP gas (%)
House heating fuel used in houses and condos - Electricity (%)
House heating fuel used in houses and condos - Fuel oil, kerosene, etc. (%)
House heating fuel used in houses and condos - Coal or coke (%)
House heating fuel used in houses and condos - Wood (%)
House heating fuel used in houses and condos - Solar energy (%)
House heating fuel used in houses and condos - Other fuel (%)
House heating fuel used in houses and condos - No fuel used (%)
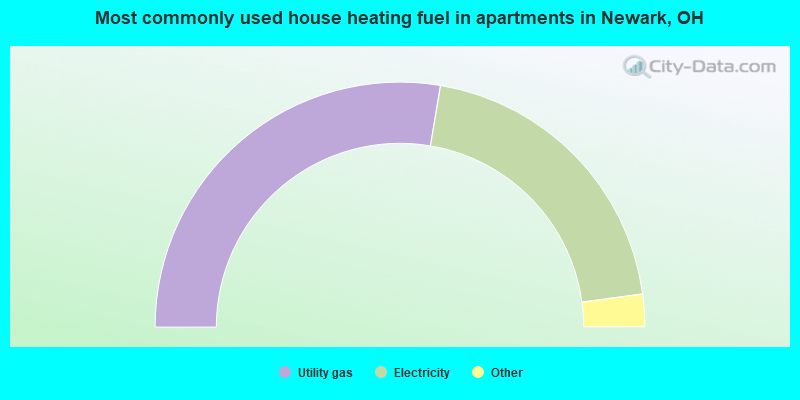
House heating fuel used in apartments - Utility gas (%)
House heating fuel used in apartments - Bottled, tank, or LP gas (%)
House heating fuel used in apartments - Electricity (%)
House heating fuel used in apartments - Fuel oil, kerosene, etc. (%)
House heating fuel used in apartments - Coal or coke (%)
House heating fuel used in apartments - Wood (%)
House heating fuel used in apartments - Solar energy (%)
House heating fuel used in apartments - Other fuel (%)
House heating fuel used in apartments - No fuel used (%)
Latest news about housing in Newark, OH collected exclusively by city-data.com from local newspapers, TV, and radio stations
Median year house/condo built: 1960Median year apartment built: 1971Household type by relationship:
Households: 50,765
Male householders: 9,776 (2,983 living alone ), Female householders: 10,713 (3,619 living alone )8,363 spouses (8,306 opposite-sex spouses ), 1,772 unmarried partners , (1,712 opposite-sex unmarried partners ), 14,434 children (13,045 natural , 310 adopted , 1,077 stepchildren ), 925 grandchildren , 450 brothers or sisters , 675 parents , 38 foster children , 759 other relatives , 1,683 non-relatives In group quarters: 1,172
Size of family households: 5,505 2-persons , 2,883 3-persons , 2,505 4-persons , 1,014 5-persons , 469 6-persons , 216 7-or-more-persons .
Size of nonfamily households: 6,507 1-person , 1,446 2-persons , 260 3-persons , 166 4-persons .
5,964 married couples with children. single-parent households (1,308 men , 2,622 women ).
95.4% of residents of Newark speak English at home. of residents speak Spanish at home (70% speak English very well , 20% speak English well , 10% speak English not well , 1% don't speak English at all ).of residents speak other Indo-European language at home (60% speak English very well , 28% speak English well , 13% speak English not well ).of residents speak Asian or Pacific Island language at home (75% speak English very well , 7% speak English well , 11% speak English not well , 7% don't speak English at all ).of residents speak other language at home (47% speak English very well , 43% speak English well , 10% speak English not well ).
Foreign born population: 1,424 (2.8%)of them are naturalized citizens )
Median number of rooms in houses and condos:
Median number of rooms in apartments
Owner-occupied Renter-occupied
Rooms in owner-occupied houses in Newark, Ohio
16 1 room 0 2 rooms 160 3 rooms 828 4 rooms 1,880 5 rooms 2,722 6 rooms 2,271 7 rooms 1,499 8 rooms 2,136 9+ rooms
Rooms in renter-occupied apartments in Newark, Ohio
495 1 room 374 2 rooms 1,602 3 rooms 2,374 4 rooms 1,712 5 rooms 1,589 6 rooms 875 7 rooms 317 8 rooms 205 9+ rooms
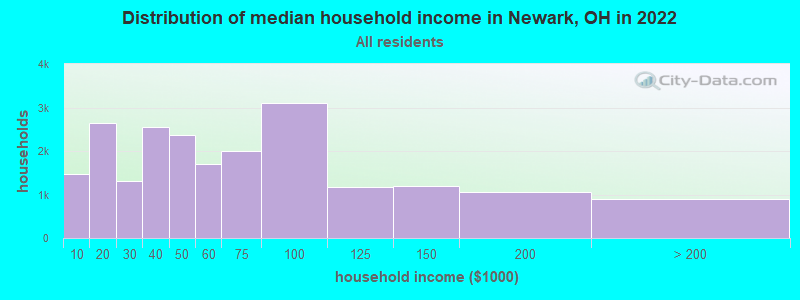
Newark, OH household income distribution 1,470 Less than $10,0002,651 $10,000 to $19,9991,318 $20,000 to $29,9992,545 $30,000 to $39,9992,357 $40,000 to $49,9991,707 $50,000 to $59,9992,010 $60,000 to $74,9993,094 $75,000 to $99,9991,175 $100,000 to $124,9991,206 $125,000 to $149,9991,066 $150,000 to $199,999901 $200,000 or more
Home value of owner - occupied houses in 2022 in Newark, OH 23 Less than $10,000101 $10,000 to $14,9996 $15,000 to $19,99931 $20,000 to $24,99913 $25,000 to $29,99917 $30,000 to $34,99963 $35,000 to $39,99973 $40,000 to $49,999157 $50,000 to $59,999200 $60,000 to $69,999720 $70,000 to $79,999553 $80,000 to $89,999303 $90,000 to $99,9991,133 $100,000 to $124,9991,037 $125,000 to $149,9991,566 $150,000 to $174,999886 $175,000 to $199,9991,076 $200,000 to $249,999899 $250,000 to $299,9991,252 $300,000 to $399,999470 $400,000 to $499,999226 $500,000 to $749,99926 $750,000 to $999,9996 $1,500,000 to $1,999,999Rent paid by renters in 2022 in Newark, OH 248 Less than $10091 $100 to $14935 $150 to $199101 $200 to $249196 $250 to $299159 $300 to $349115 $350 to $399546 $400 to $449482 $450 to $499840 $500 to $549530 $550 to $599569 $600 to $649742 $650 to $699953 $700 to $749534 $750 to $799742 $800 to $899431 $900 to $999955 $1,000 to $1,249135 $1,250 to $1,499146 $1,500 to $1,99949 $2,000 to $2,499497 No cash rent
Percentage of workers working in this county: 83.5%Number of people working at home: 2,880 (12.3% of all workers )
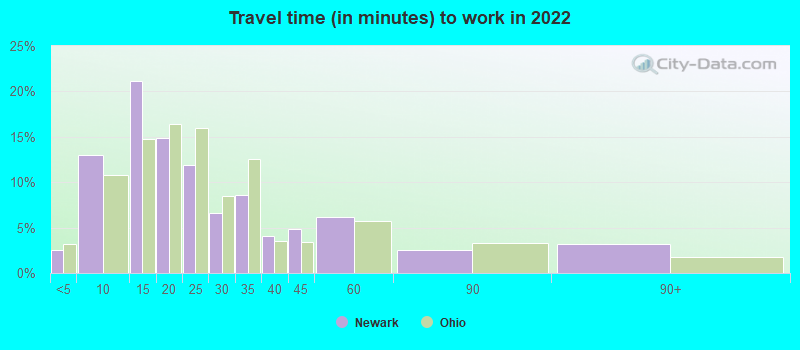
Travel time to work (commute)
Less than 5 minutes: 5185 to 9 minutes: 3,05910 to 14 minutes: 5,03515 to 19 minutes: 3,24720 to 24 minutes: 1,68625 to 29 minutes: 83430 to 34 minutes: 1,25735 to 39 minutes: 76840 to 44 minutes: 92945 to 59 minutes: 2,08560 to 89 minutes: 67390 or more minutes: 343
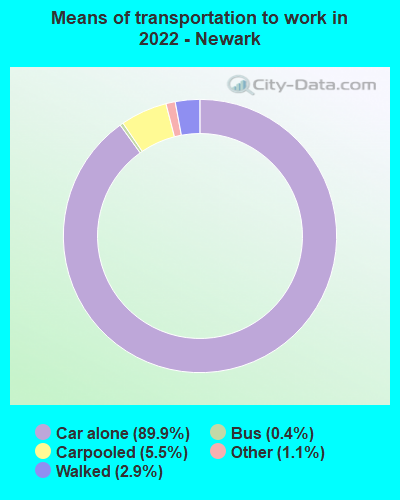
Means of transportation to work:
Drove a car alone: 18,173 (78.4%)Carpooled: 1,187 (5.1%)Bus : 68 (0.3%)Light rail, streetcar or trolley : 13 (0.1%)Taxi: 277 (1.2%)Bicycle: 17 (0.1%)Walked: 596 (2.6%)Worked at home: 2,735 (11.8%)
Unemployment by race in 2022
Unemployment rate for White non-Hispanic residents 4.3% Males2.1% FemalesUnemployment rate for Black residents 12.7% Males6.3% FemalesUnemployment rate for two or more race residents 0.6% FemalesUnemployment rate for Hispanic or Latino residents 0.7% Males
Year of entry for the foreign-born population in Newark, Ohio
325 2010 or later 368 2000 to 2009 221 1990 to 1999 119 1980 to 1989 38 1970 to 1979 170 Before 1970
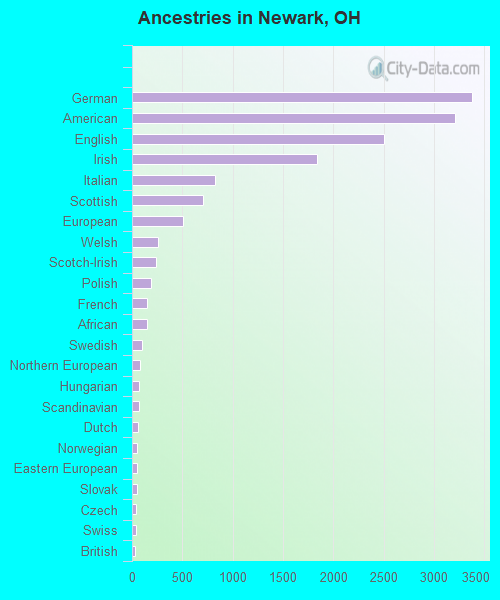
First ancestries reported:
German: 3,378 (17.5%)
American: 3,211 (16.7%)
English: 2,503 (13.0%)
Irish: 1,839 (9.6%)
Italian: 829 (4.3%)
Scottish: 706 (3.7%)
European: 502 (2.6%)
Welsh: 255 (1.3%)
Scotch-Irish: 243 (1.3%)
Polish: 187 (1.0%)
French: 151 (0.8%)
African: 147 (0.8%)
Swedish: 101 (0.5%)
Northern European: 76 (0.4%)
Hungarian: 71 (0.4%)
Scandinavian: 65 (0.3%)
Dutch: 61 (0.3%)
Norwegian: 50 (0.3%)
Eastern European: 49 (0.3%)
Slovak: 46 (0.2%)
Czech: 44 (0.2%)
Swiss: 42 (0.2%)
British: 34 (0.2%)
Belgian: 21 (0.1%)
Portuguese: 21 (0.1%)
Barbadian: 18 (0.09%)
Pennsylvania German: 17 (0.09%)
Greek: 16 (0.08%)
Canadian: 14 (0.07%)
Ukrainian: 11 (0.06%)
Romanian: 10 (0.05%)
Czechoslovakian: 9 (0.05%)
French Canadian: 8 (0.04%)
Armenian: 6 (0.03%)
Russian: 5 (0.03%)
Arab: 4 (0.02%)
Macedonian: 4 (0.02%) Most common places of birth for foreign-born residents (%): Israel Newark:
18.5% (225)Ohio:
0.5% (2,631)
Mexico Newark:
17.1% (208)Ohio:
7.8% (44,796)
Ivory Coast Newark:
8.9% (109)Ohio:
0.3% (1,682)
India Newark:
7.9% (96)Ohio:
11.6% (66,525)
Nicaragua Newark:
6.2% (76)Ohio:
0.2% (1,250)
Dominican Republic Newark:
5.2% (63)Ohio:
1.1% (6,549)
Canada Newark:
5.0% (61)Ohio:
2.6% (14,988)
Kazakhstan Newark:
4.4% (53)Ohio:
0.1% (640)
Philippines Newark:
3.9% (47)Ohio:
3.1% (17,818)
England Newark:
3.5% (43)Ohio:
1.0% (5,979)
Kuwait Newark:
2.8% (34)Ohio:
0.2% (1,210)
Belgium Newark:
2.8% (34)Ohio:
0.1% (700)
Germany Newark:
2.5% (31)Ohio:
2.2% (12,846)
Panama Newark:
2.5% (30)Ohio:
0.2% (1,224)
China, excluding Hong Kong and Taiwan Newark:
2.2% (27)Ohio:
6.2% (35,703)
St. Vincent and the Grenadines Newark:
1.9% (23)Ohio:
0.0% (69)
Scotland Newark:
1.8% (22)Ohio:
0.2% (1,424)
Uruguay Newark:
1.8% (22)Ohio:
0.1% (362)
Place of birth for U.S.-born residents:
This state: 40,282Other state: 8,528Northeast: 1,731Midwest: 2,242South: 3,652West: 916 89.7% of Newark residents lived in the same house 1 years ago.
Out of people who lived in different houses, 35.9% lived in this county.
Out of people who lived in different counties, 92.8% lived in Ohio.
Newark:
89.7%State average:
87.8%
Education attainment for males 25 years and older:
No schooling: 138Nursery to 4th grade: 05th and 6th grade: 77th and 8th grade: 889th grade: 11210th grade: 40411th grade: 23612th grade, no diploma: 427High school graduate (or equivalency): 6,718Less than 1 year of college: 1,246Some college more than 1 year, no degree: 2,064Associate degree: 1,029Bachelor's degree: 2,931Master's degree: 793Professional school degree: 215Doctorate degree: 68
Education attainment for females 25 years and older:
No schooling: 130Nursery to 4th grade: 55th and 6th grade: 87th and 8th grade: 4079th grade: 14710th grade: 34511th grade: 22712th grade, no diploma: 659High school graduate (or equivalency): 6,742Less than 1 year of college: 1,267Some college more than 1 year, no degree: 1,756Associate degree: 1,822Bachelor's degree: 2,883Master's degree: 1,155Professional school degree: 73Doctorate degree: 50
Housing units in structures:
One, detached: 14,695One, attached: 818Two: 8473 or 4: 2,4475 to 9: 1,67610 to 19: 55320 to 49: 52050 or more: 638Mobile homes: 174Housing units lacking complete plumbing facilities in 2022: 1.8%Housing units lacking complete kitchen facilities in 2022: 3.9%House/condo owner moved in on average 13 years ago
Renter moved in on average 3 years ago
Private vs. public school enrollment:
Students in private schools in grades 1 to 8 (elementary and middle school): 483 Students in private schools in grades 9 to 12 (high school): 265 Students in private undergraduate colleges: 371