Newaukum, WA (Washington) Houses and Residents
| Newaukum: | $449,594 |
| Washington: | $569,500 |
Total population: 2,269 (Urban population: 55 (all inside urban clusters), Rural population: 2,073 (159 farm, 1,914 nonfarm))
Houses: 847 (805 occupied: 672 owner occupied, 133 renter occupied)
| % of renters here: | 17% |
| State: | 36% |
Housing density: 40 houses/condos per square mile
Median price asked for vacant for-sale houses and condos in 2022 in this county: $1,414,732.
Median contract rent in 2022: $945 (lower quartile is $712, upper quartile is $1,120)
Median rent asked for vacant for-rent units in 2022: $1,055
Median gross rent in Newaukum, WA in 2022: $1,064
Housing units in Newaukum with a mortgage: 303 (53 second mortgage, 29 home equity loan, 0 both second mortgage and home equity loan)
Houses without a mortgage: 72


Household type by relationship:
Households: 74,514- In family households: 62,315 (14,631 male householders, 5,473 female householders)
15,241 spouses, 20,171 children (17,964 natural, 698 adopted, 1,509 stepchildren), 1,774 grandchildren, 602 brothers or sisters, 508 parents, foster children, 917 other relatives, 2,553 non-relatives
- In nonfamily households: 12,199 (4,888 male householders (3,616 living alone)), 4,751 female householders (4,028 living alone)), 2,560 nonrelatives
- In group quarters: 941 (689 institutionalized population)
11,774 married couples with children.
4,346 single-parent households (1,292 men, 3,054 women).
93.8% of residents of Newaukum speak English at home.
2.3% of residents speak Spanish at home (57% speak English very well, 22% speak English well, 22% speak English not well).
2.3% of residents speak other Indo-European language at home (72% speak English very well, 13% speak English well, 15% speak English not well).
1.3% of residents speak Asian or Pacific Island language at home (50% speak English very well, 35% speak English well, 15% speak English not well).
0.2% of residents speak other language at home (100% speak English very well).
Foreign born population: 91 (3.4%)
(80.2% of them are naturalized citizens)
| Here: | 7.3 |
| State: | 6.5 |
| Here: | 4.1 |
| State: | 3.9 |

- Bedrooms in owner-occupied houses and condos in Newaukum, Washington
- 5no bedroom
- 181 bedroom
- 1022 bedrooms
- 4253 bedrooms
- 974 bedrooms
- 255+ bedrooms

- Bedrooms in renter-occupied apartments in Newaukum, Washington
- 0no bedroom
- 31 bedroom
- 852 bedrooms
- 343 bedrooms
- 84 bedrooms
- 35+ bedrooms

- Cars and other vehicles available in Newaukum in owner-occupied houses/condos
- 8no vehicle
- 781 vehicle
- 2832 vehicles
- 2073 vehicles
- 774 vehicles
- 195+ vehicles

- Cars and other vehicles available in Newaukum in renter-occupied apartments
- 3no vehicle
- 511 vehicle
- 622 vehicles
- 143 vehicles
- 34 vehicles
- 05+ vehicles

- Rooms in owner-occupied houses in Newaukum, Washington
- 01 room
- 102 rooms
- 153 rooms
- 404 rooms
- 775 rooms
- 1956 rooms
- 1797 rooms
- 978 rooms
- 599+ rooms

- Rooms in renter-occupied apartments in Newaukum, Washington
- 01 room
- 32 rooms
- 43 rooms
- 484 rooms
- 385 rooms
- 146 rooms
- 117 rooms
- 108 rooms
- 59+ rooms


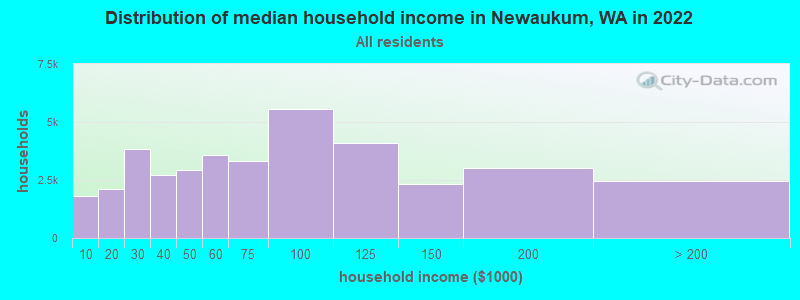
Newaukum, WA household income distribution

- 1,827Less than $10,000
- 2,099$10,000 to $19,999
- 3,825$20,000 to $29,999
- 2,727$30,000 to $39,999
- 2,919$40,000 to $49,999
- 3,586$50,000 to $59,999
- 3,313$60,000 to $74,999
- 5,546$75,000 to $99,999
- 4,095$100,000 to $124,999
- 2,310$125,000 to $149,999
- 3,017$150,000 to $199,999
- 2,477$200,000 or more
Percentage of workers working in this county: 69.8%
Number of people working at home: 183 (16.0% of all workers)
Travel time to work (commute)
- Less than 5 minutes: 53
- 5 to 9 minutes: 69
- 10 to 14 minutes: 217
- 15 to 19 minutes: 144
- 20 to 24 minutes: 133
- 25 to 29 minutes: 38
- 30 to 34 minutes: 57
- 35 to 39 minutes: 30
- 40 to 44 minutes: 26
- 45 to 59 minutes: 62
- 60 to 89 minutes: 20
- 90 or more minutes: 37
Means of transportation to work:
- Drove a car alone: 783 (82.7%)
- Carpooled: 86 (9.1%)
- Walked: 17 (1.8%)
- Worked at home: 61 (6.4%)


- Year of entry for the foreign-born population in Newaukum, Washington
- 01995 to March 2000
- 41990 to 1994
- 71985 to 1989
- 41980 to 1984
- 01975 to 1979
- 01970 to 1974
- 61965 to 1969
- 32Before 1965
Most common places of birth for foreign-born residents (%):
| Newaukum: | 34.0% (18) |
| Washington: | 3.4% (21,167) |
| Newaukum: | 22.6% (12) |
| Washington: | 7.7% (47,568) |
| Newaukum: | 20.8% (11) |
| Washington: | 6.2% (38,172) |
| Newaukum: | 9.4% (5) |
| Washington: | 2.8% (16,936) |
| Newaukum: | 7.5% (4) |
| Washington: | 24.1% (148,115) |
| Newaukum: | 5.7% (3) |
| Washington: | 0.6% (3,795) |
Place of birth for U.S.-born residents:
- This state: 1,358
- Other state: 704
- Northeast: 48
- Midwest: 166
- South: 114
- West: 376
54% of Newaukum residents lived in the same house 5 years ago.
Out of people who lived in different houses, 46% lived in this county.
Out of people who lived in different counties, 76% lived in Washington.
Education attainment for males 25 years and older:
- No schooling: 0
- Nursery to 4th grade: 0
- 5th and 6th grade: 10
- 7th and 8th grade: 16
- 9th grade: 14
- 10th grade: 37
- 11th grade: 13
- 12th grade, no diploma: 26
- High school graduate (or equivalency): 251
- Less than 1 year of college: 65
- Some college more than 1 year, no degree: 128
- Associate degree: 78
- Bachelor's degree: 73
- Master's degree: 19
- Professional school degree: 15
- Doctorate degree: 0

Education attainment for females 25 years and older:
- No schooling: 0
- Nursery to 4th grade: 0
- 5th and 6th grade: 0
- 7th and 8th grade: 22
- 9th grade: 11
- 10th grade: 17
- 11th grade: 12
- 12th grade, no diploma: 12
- High school graduate (or equivalency): 278
- Less than 1 year of college: 45
- Some college more than 1 year, no degree: 154
- Associate degree: 73
- Bachelor's degree: 31
- Master's degree: 33
- Professional school degree: 5
- Doctorate degree: 0


Housing units in structures:
- One, detached: 601
- One, attached: 14
- 3 or 4: 14
- 5 to 9: 26
- Mobile homes: 192
Median worth of mobile homes: $195,898
Housing units lacking complete kitchen facilities: 0.5%

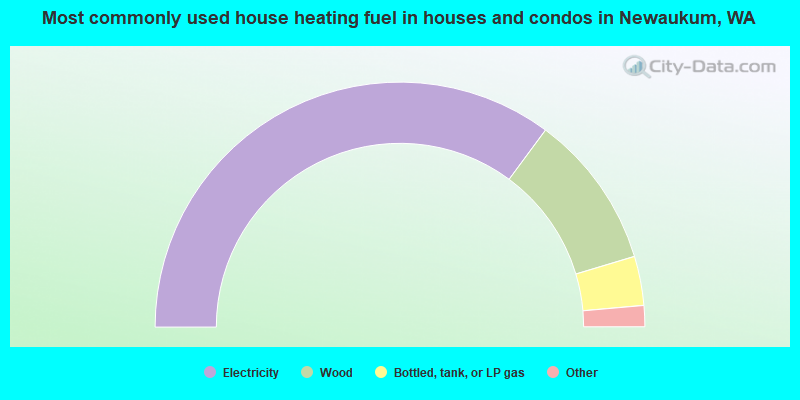
- 70.2%Electricity
- 20.4%Wood
- 6.5%Bottled, tank, or LP gas
- 1.6%Other fuel
- 1.2%Utility gas
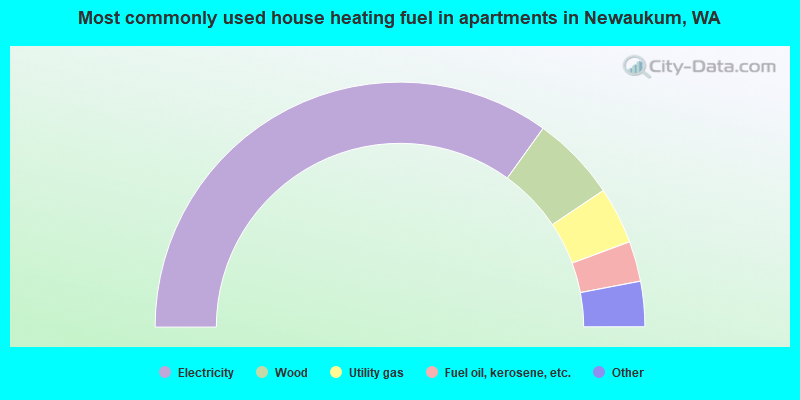
- 69.9%Electricity
- 11.3%Wood
- 7.5%Utility gas
- 5.3%Fuel oil, kerosene, etc.
- 3.8%No fuel used
- 2.3%Bottled, tank, or LP gas
Private vs. public school enrollment:
| Here: | 22.6% |
| Washington: | 9.2% |
| Here: | 2.0% |
| Washington: | 7.0% |
| Here: | 16.1% |
| Washington: | 15.7% |


