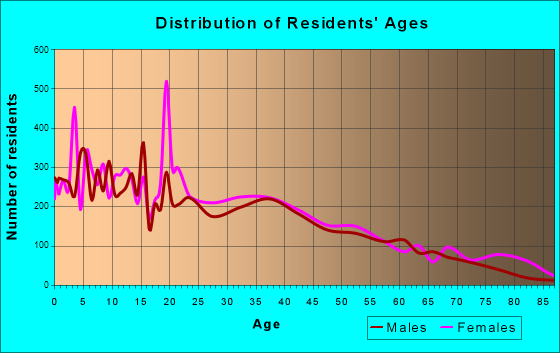
Newburgh, NY (New York) Houses and Residents
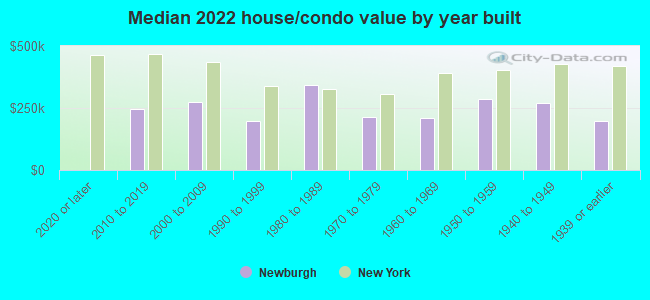
Estimated median house or condo value in 2022: $209,891 (it was $93,200 in 2000 )
Newburgh:
$209,891New York:
$400,400
Lower value quartile - upper value quartile: $168,052 - $294,135Mean price in 2022: Detached houses: $230,746 Here:
$230,746State:
$476,719
Townhouses or other attached units: $204,835 Here:
$204,835State:
$699,270
In 2-unit structures: $333,874 Here:
$333,874State:
$713,077
In 3-to-4-unit structures: $211,647 Here:
$211,647State:
$764,568
In 5-or-more-unit structures: $252,603 Here:
$252,603State:
$912,009
Total population: 28,358 (Urban population: 28,233, Rural population: 0)
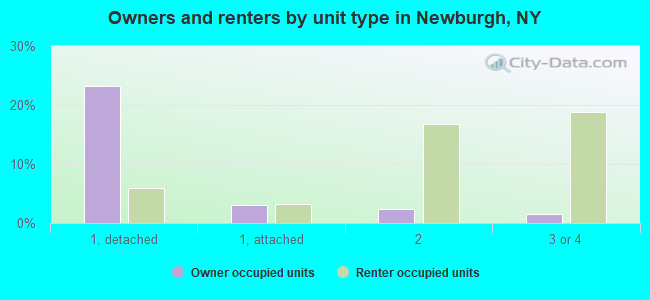
Houses: 12,229 (10,700 occupied: 3,650 owner occupied, 7,213 renter occupied )
% of renters here:
66%State:
46%
Housing density: 3,200 houses/condos per square mile
Median price asked for vacant for-sale houses and condos in 2022: $109,482.
Median contract rent in 2022: $1,130 (lower quartile is $900, upper quartile is $1,383)
Median rent asked for vacant for-rent units in 2022: $566
Median gross rent in Newburgh, NY in 2022: $1,354
Housing units in Newburgh with a mortgage: 2,411 (178 second mortgage, 0 home equity loan, 119 both second mortgage and home equity loan )Houses without a mortgage: 68
Median household income for houses/condos with a mortgage: $90,503
Median household income for apartments without a mortgage: $67,945
Median monthly housing costs: $1,357
Data:
Median house or condo value ($)
Median house or condo value ($ change since 2000)
Median house or condo value ($) - White
Median house or condo value ($) - Black or African American
Median house or condo value ($) - Asian
Median house or condo value ($) - Hispanic or Latino
Median house or condo value ($) - American Indian and Alaska Native
Median house or condo value ($) - Multirace
Median house or condo value ($) - Other Race
Median price asked for mobile homes ($)
Household density (households per square mile)
Mean house or condo value by units in structure - 1, detached ($)
Mean house or condo value by units in structure - 1, attached ($)
Mean house or condo value by units in structure - 2 ($)
Mean house or condo value by units in structure by units in structure - 3 or 4 ($)
Mean house or condo value by units in structure - 5 or more ($)
Mean house or condo value by units in structure - Boat, RV, van, etc. ($)
Mean house or condo value by units in structure - Mobile home ($)
Median contract rent ($)
Median contract rent - Lower quartile ($)
Median contract rent - Upper quartile ($)
Median gross rent ($)
Urban houses (%)
Rural houses (%)
Houses occupied (%)
Houses occupied (% change since 2000)
Houses owner occupied (%)
Houses owner occupied (% change since 2000)
Houses renter occupied (%)
Houses renter occupied (% change since 2000)
Vacant housing units - For rent (%)
Vacant housing units - For rent (% change since 2000)
Vacant housing units - For sale only (%)
Vacant housing units - For sale only (% change since 2000)
Vacant housing units - Rented or sold, not occupied (%)
Vacant housing units - Rented or sold, not occupied (% change since 2000)
Vacant housing units - For seasonal, recreational, or occasional use (%)
Vacant housing units - For seasonal, recreational, or occasional use (% change since 2000)
Vacant housing units - For migrant workers (%)
Vacant housing units - For migrant workers (% change since 2000)
Vacant housing units - Other vacant (%)
Vacant housing units - Other vacant (% change since 2000)
Median monthly housing costs ($)
Median household income for houses/condos with a mortgage ($)
Median household income for houses/condos without a mortgage ($)
Median household income ($)
Median household income ($) - White
Median household income ($) - Black or African American
Median household income ($) - Asian
Median household income ($) - Hispanic or Latino
Median household income ($) - American Indian and Alaska Native
Median household income ($) - Multirace
Median household income ($) - Other Race
Mortgage status - with mortgage (%)
Mortgage status - with second mortgage (%)
Mortgage status - with home equity loan (%)
Mortgage status - with both second mortgage and home equity loan (%)
Mortgage status - without a mortgage (%)
Median year house/condo built
Median year apartment built
Household type by relationship - Male householder living alone (%)
Household type by relationship - Male householder not living alone (%)
Household type by relationship - Female householder living alone (%)
Household type by relationship - Female householder not living alone (%)
Household type by relationship - Opposite-Sex spouse (%)
Household type by relationship - Same-Sex spouse (%)
Household type by relationship - Opposite-Sex unmarried partner (%)
Household type by relationship - Same-Sex unmarried partner (%)
Household type by relationship - In group quarters (%)
Size of family households - 2-person household (%)
Size of family households - 3-person household (%)
Size of family households - 4-person household (%)
Size of family households - 5-person household (%)
Size of family households - 6-person household (%)
Size of family households - 7-or-more-person household (%)
Size of nonfamily households - 1-person household (%)
Size of nonfamily households - 2-person household (%)
Size of nonfamily households - 3-person household (%)
Size of nonfamily households - 4-person household (%)
Size of nonfamily households - 5-person household (%)
Size of nonfamily households - 6-person household (%)
Size of nonfamily households - 7-or-moreperson household (%)
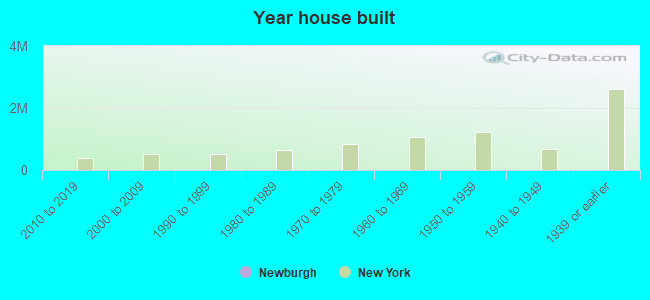
Year house built - Built 2010 or later (%)
Year house built - Built 2000 to 2009 (%)
Year house built - Built 1990 to 1999 (%)
Year house built - Built 1980 to 1989 (%)
Year house built - Built 1970 to 1979 (%)
Year house built - Built 1960 to 1969 (%)
Year house built - Built 1950 to 1959 (%)
Year house built - Built 1940 to 1949 (%)
Year house built - Built 1939 or earlier (%)
Median number of rooms in houses and condos
Median number of rooms in apartments
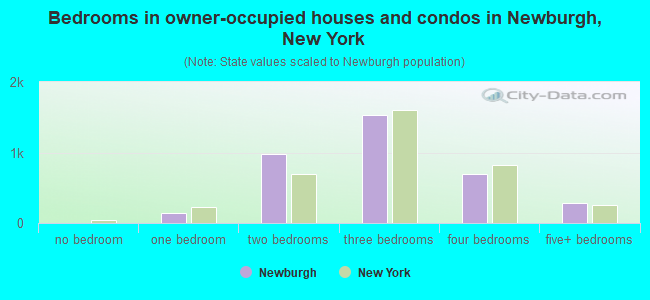
Median number of bedrooms in owner occupied houses
Mean number of bedrooms in owner occupied houses
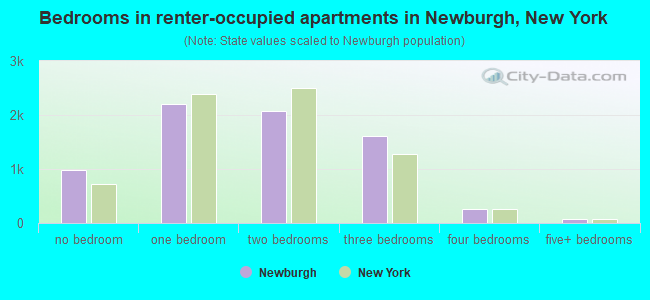
Median number of bedrooms in renter occupied houses
Mean number of bedrooms in renter occupied houses
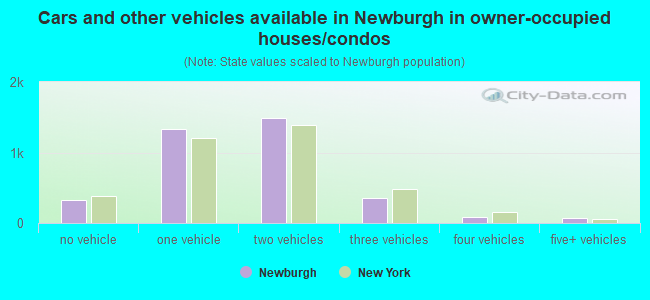
Median number of vehichles in owner occupied houses
Mean number of vehichles in owner occupied houses
Median number of vehichles in renter occupied houses
Mean number of vehichles in renter occupied houses
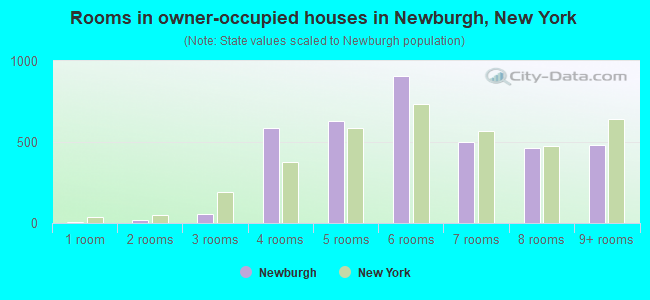
Rooms in owner-occupied houses - 1 room (%)
Rooms in owner-occupied houses - 2 rooms (%)
Rooms in owner-occupied houses - 3 rooms (%)
Rooms in owner-occupied houses - 4 rooms (%)
Rooms in owner-occupied houses - 5 rooms (%)
Rooms in owner-occupied houses - 6 rooms (%)
Rooms in owner-occupied houses - 7 rooms (%)
Rooms in owner-occupied houses - 8 rooms (%)
Rooms in owner-occupied houses - 9+ rooms (%)
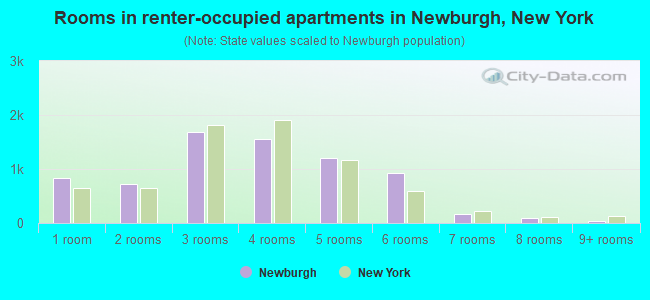
Rooms in renter-occupied houses - 1 room (%)
Rooms in renter-occupied houses - 2 rooms (%)
Rooms in renter-occupied houses - 3 rooms (%)
Rooms in renter-occupied houses - 4 rooms (%)
Rooms in renter-occupied houses - 5 rooms (%)
Rooms in renter-occupied houses - 6 rooms (%)
Rooms in renter-occupied houses - 7 rooms (%)
Rooms in renter-occupied houses - 8 rooms (%)
Rooms in renter-occupied houses - 9+ rooms (%)
Bedrooms in owner-occupied houses - no bedrooms (%)
Bedrooms in owner-occupied houses - 1 bedroom (%)
Bedrooms in owner-occupied houses - 2 bedrooms (%)
Bedrooms in owner-occupied houses - 3 bedrooms (%)
Bedrooms in owner-occupied houses - 4 bedrooms (%)
Bedrooms in owner-occupied houses - 5+ bedrooms (%)
Bedrooms in renter-occupied houses - no bedrooms (%)
Bedrooms in renter-occupied houses - 1 bedroom (%)
Bedrooms in renter-occupied houses - 2 bedrooms (%)
Bedrooms in renter-occupied houses - 3 bedrooms (%)
Bedrooms in renter-occupied houses - 4 bedrooms (%)
Bedrooms in renter-occupied houses - 5+ bedrooms (%)
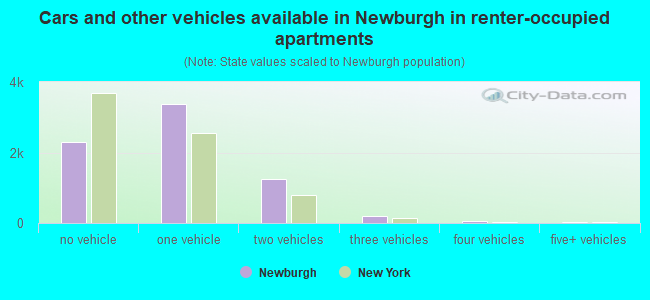
Vehicles available in owner-occupied houses - no vehicle available (%)
Vehicles available in owner-occupied houses - 1 vehicle available(%)
Vehicles available in owner-occupied houses - 2 Vehicles available (%)
Vehicles available in owner-occupied houses - 3 Vehicles available (%)
Vehicles available in owner-occupied houses - 4 Vehicles available (%)
Vehicles available in owner-occupied houses - 5+ Vehicles available (%)
Vehicles available in renter-occupied houses - no vehicle available (%)
Vehicles available in renter-occupied houses - 1 vehicle available (%)
Vehicles available in renter-occupied houses - 2 Vehicles available (%)
Vehicles available in renter-occupied houses - 3 Vehicles available (%)
Vehicles available in renter-occupied houses - 4 Vehicles available (%)
Vehicles available in renter-occupied houses - 5+ Vehicles available (%)
Housing units in structures - 1, detached (%)
Housing units in structures - 1, attached (%)
Housing units in structures - 2 (%)
Housing units in structures - 3 or 4 (%)
Housing units in structures - 5 to 9 (%)
Housing units in structures - 10 to 19 (%)
Housing units in structures - 20 to 49 (%)
Housing units in structures - 50 or more (%)
Housing units in structures - Mobile home (%)
Housing units in structures - Boat, RV, van, etc. (%)
Housing units in structures - Owners - 1, detached (%)
Housing units in structures - Owners - 1, attached (%)
Housing units in structures - Owners - 2 (%)
Housing units in structures - Owners - 3 or 4 (%)
Housing units in structures - Owners - 5 to 9 (%)
Housing units in structures - Owners - 10 to 19 (%)
Housing units in structures - Owners - 20 to 49 (%)
Housing units in structures - Owners - 50 or more (%)
Housing units in structures - Owners - Mobile home (%)
Housing units in structures - Owners - Boat, RV, van, etc. (%)
Housing units in structures - Renters - 1, detached (%)
Housing units in structures - Renters - 1, attached (%)
Housing units in structures - Renters - 2 (%)
Housing units in structures - Renters - 3 or 4 (%)
Housing units in structures - Renters - 5 to 9 (%)
Housing units in structures - Renters - 10 to 19 (%)
Housing units in structures - Renters - 20 to 49 (%)
Housing units in structures - Renters - 50 or more (%)
Housing units in structures - Renters - Mobile home (%)
Housing units in structures - Renters - Boat, RV, van, etc. (%)
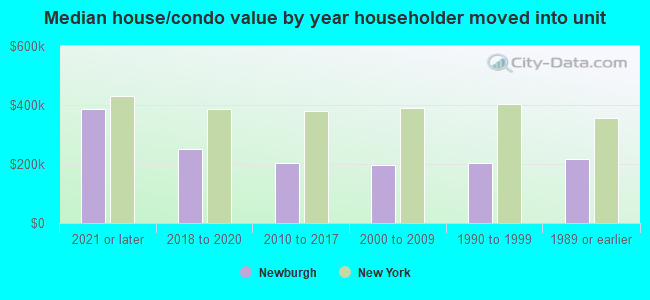
House/condo owner moved in on average (years ago)
Renter moved in on average (years ago)
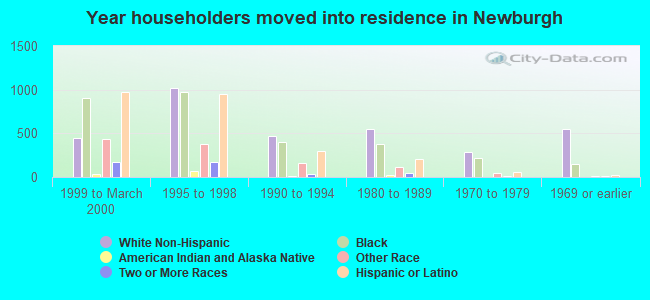
Year householder moved into unit - Moved in 1999 to March 2000 (%)
Year householder moved into unit - Moved in 1999 to March 2000 (%) - White
Year householder moved into unit - Moved in 1999 to March 2000 (%) - Black or African American
Year householder moved into unit - Moved in 1999 to March 2000 (%) - Asian
Year householder moved into unit - Moved in 1999 to March 2000 (%) - Hispanic or Latino
Year householder moved into unit - Moved in 1999 to March 2000 (%) - American Indian and Alaska Native
Year householder moved into unit - Moved in 1999 to March 2000 (%) - Multirace
Year householder moved into unit - Moved in 1999 to March 2000 (%) - Other Race
Year householder moved into unit - Moved in 1995 to 1998 (%)
Year householder moved into unit - Moved in 1995 to 1998 (%) - White
Year householder moved into unit - Moved in 1995 to 1998 (%) - Black or African American
Year householder moved into unit - Moved in 1995 to 1998 (%) - Asian
Year householder moved into unit - Moved in 1995 to 1998 (%) - Hispanic or Latino
Year householder moved into unit - Moved in 1995 to 1998 (%) - American Indian and Alaska Native
Year householder moved into unit - Moved in 1995 to 1998 (%) - Multirace
Year householder moved into unit - Moved in 1995 to 1998 (%) - Other Race
Year householder moved into unit - Moved in 1990 to 1994 (%)
Year householder moved into unit - Moved in 1990 to 1994 (%) - White
Year householder moved into unit - Moved in 1990 to 1994 (%) - Black or African American
Year householder moved into unit - Moved in 1990 to 1994 (%) - Asian
Year householder moved into unit - Moved in 1990 to 1994 (%) - Hispanic or Latino
Year householder moved into unit - Moved in 1990 to 1994 (%) - American Indian and Alaska Native
Year householder moved into unit - Moved in 1990 to 1994 (%) - Multirace
Year householder moved into unit - Moved in 1990 to 1994 (%) - Other Race
Year householder moved into unit - Moved in 1980 to 1989 (%)
Year householder moved into unit - Moved in 1980 to 1989 (%) - White
Year householder moved into unit - Moved in 1980 to 1989 (%) - Black or African American
Year householder moved into unit - Moved in 1980 to 1989 (%) - Asian
Year householder moved into unit - Moved in 1980 to 1989 (%) - Hispanic or Latino
Year householder moved into unit - Moved in 1980 to 1989 (%) - American Indian and Alaska Native
Year householder moved into unit - Moved in 1980 to 1989 (%) - Multirace
Year householder moved into unit - Moved in 1980 to 1989 (%) - Other Race
Year householder moved into unit - Moved in 1970 to 1979 (%)
Year householder moved into unit - Moved in 1970 to 1979 (%) - White
Year householder moved into unit - Moved in 1970 to 1979 (%) - Black or African American
Year householder moved into unit - Moved in 1970 to 1979 (%) - Asian
Year householder moved into unit - Moved in 1970 to 1979 (%) - Hispanic or Latino
Year householder moved into unit - Moved in 1970 to 1979 (%) - American Indian and Alaska Native
Year householder moved into unit - Moved in 1970 to 1979 (%) - Multirace
Year householder moved into unit - Moved in 1970 to 1979 (%) - Other Race
Year householder moved into unit - Moved in 1969 or earlier (%)
Year householder moved into unit - Moved in 1969 or earlier (%) - White
Year householder moved into unit - Moved in 1969 or earlier (%) - Black or African American
Year householder moved into unit - Moved in 1969 or earlier (%) - Asian
Year householder moved into unit - Moved in 1969 or earlier (%) - Hispanic or Latino
Year householder moved into unit - Moved in 1969 or earlier (%) - American Indian and Alaska Native
Year householder moved into unit - Moved in 1969 or earlier (%) - Multirace
Year householder moved into unit - Moved in 1969 or earlier (%) - Other Race
Housing units lacking complete plumbing facilities (%)
Housing units lacking complete kitchen facilities (%)
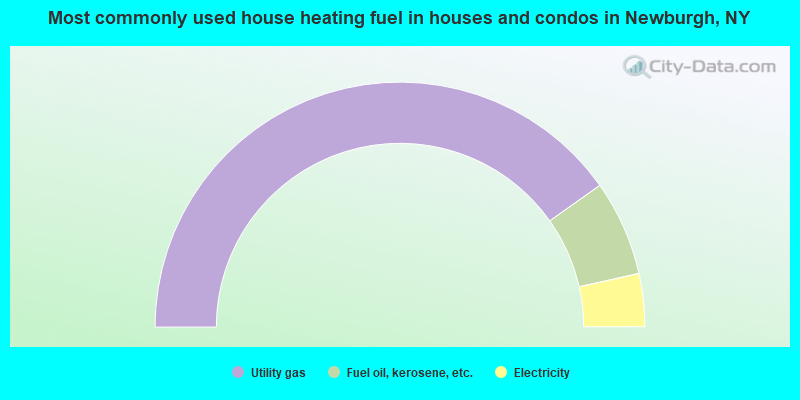
House heating fuel used in houses and condos - Utility gas (%)
House heating fuel used in houses and condos - Bottled, tank, or LP gas (%)
House heating fuel used in houses and condos - Electricity (%)
House heating fuel used in houses and condos - Fuel oil, kerosene, etc. (%)
House heating fuel used in houses and condos - Coal or coke (%)
House heating fuel used in houses and condos - Wood (%)
House heating fuel used in houses and condos - Solar energy (%)
House heating fuel used in houses and condos - Other fuel (%)
House heating fuel used in houses and condos - No fuel used (%)
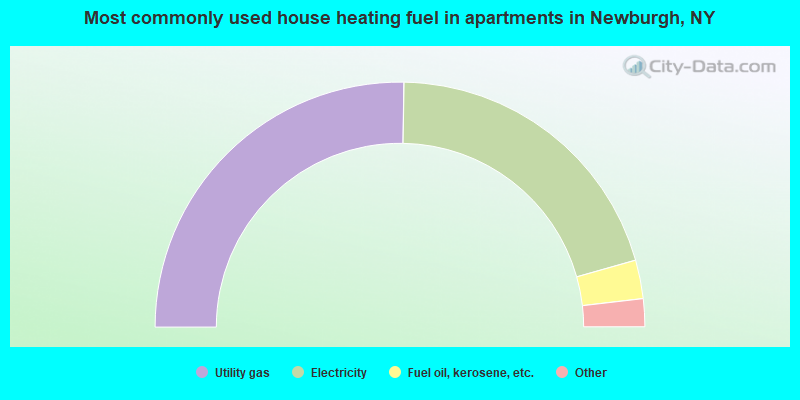
House heating fuel used in apartments - Utility gas (%)
House heating fuel used in apartments - Bottled, tank, or LP gas (%)
House heating fuel used in apartments - Electricity (%)
House heating fuel used in apartments - Fuel oil, kerosene, etc. (%)
House heating fuel used in apartments - Coal or coke (%)
House heating fuel used in apartments - Wood (%)
House heating fuel used in apartments - Solar energy (%)
House heating fuel used in apartments - Other fuel (%)
House heating fuel used in apartments - No fuel used (%)
Latest news about housing in Newburgh, NY collected exclusively by city-data.com from local newspapers, TV, and radio stations
Median year house/condo built: 1939Median year apartment built: 1941Household type by relationship:
Households: 29,088
Male householders: 3,992 (1,389 living alone ), Female householders: 6,635 (2,056 living alone )3,080 spouses (3,037 opposite-sex spouses ), 1,069 unmarried partners , (1,052 opposite-sex unmarried partners ), 9,356 children (9,126 natural , 63 adopted , 165 stepchildren ), 488 grandchildren , 683 brothers or sisters , 946 parents , 0 foster children , 1,131 other relatives , 783 non-relatives In group quarters: 919
Size of family households: 1,957 2-persons , 1,764 3-persons , 1,079 4-persons , 1,224 5-persons , 429 6-persons , 166 7-or-more-persons .
Size of nonfamily households: 3,476 1-person , 755 2-persons , 23 3-persons , 9 4-persons , 19 6-persons .
2,184 married couples with children. single-parent households (1,141 men , 3,102 women ).
55.6% of residents of Newburgh speak English at home. of residents speak Spanish at home (55% speak English very well , 20% speak English well , 20% speak English not well , 5% don't speak English at all ).of residents speak other Indo-European language at home (82% speak English very well , 1% speak English well , 17% speak English not well ).of residents speak Asian or Pacific Island language at home (100% speak English very well ).of residents speak other language at home (66% speak English very well , 34% speak English well ).
Foreign born population: 6,259 (21.5%)of them are naturalized citizens )
Median number of rooms in houses and condos:
Median number of rooms in apartments
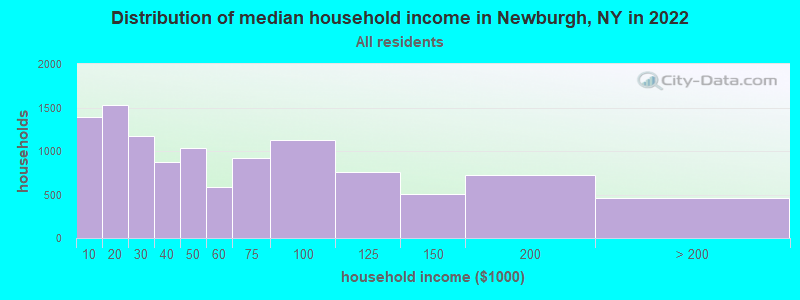
Newburgh, NY household income distribution 1,394 Less than $10,0001,529 $10,000 to $19,9991,177 $20,000 to $29,999875 $30,000 to $39,9991,033 $40,000 to $49,999585 $50,000 to $59,999919 $60,000 to $74,9991,131 $75,000 to $99,999756 $100,000 to $124,999507 $125,000 to $149,999722 $150,000 to $199,999460 $200,000 or more
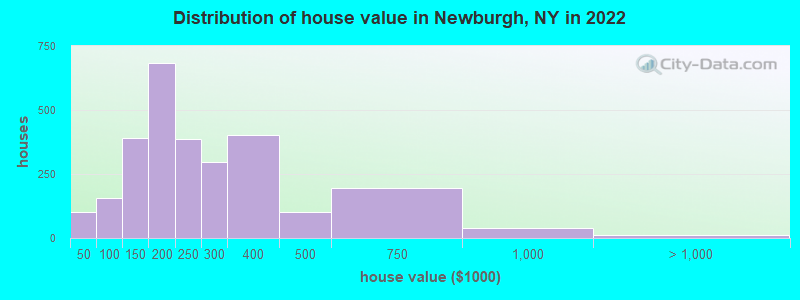
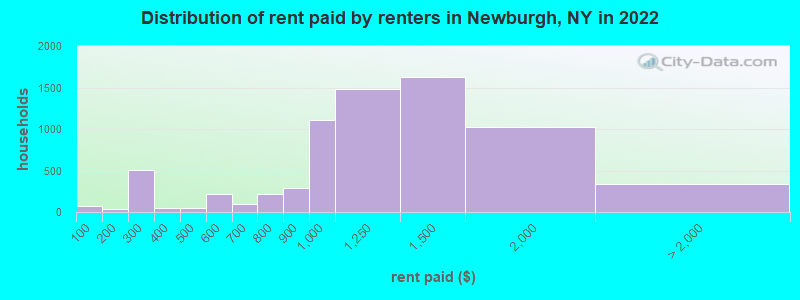
Home value of owner - occupied houses in 2022 in Newburgh, NY 61 $15,000 to $19,99928 $20,000 to $24,9999 $35,000 to $39,99919 $60,000 to $69,99979 $80,000 to $89,99957 $90,000 to $99,99999 $100,000 to $124,999292 $125,000 to $149,999372 $150,000 to $174,999308 $175,000 to $199,999387 $200,000 to $249,999298 $250,000 to $299,999402 $300,000 to $399,999103 $400,000 to $499,999195 $500,000 to $749,99941 $750,000 to $999,99912 $1,500,000 to $1,999,999Rent paid by renters in 2022 in Newburgh, NY 75 Less than $10040 $150 to $199305 $200 to $249195 $250 to $29915 $300 to $34934 $350 to $39942 $400 to $4499 $450 to $49963 $500 to $549147 $550 to $59992 $600 to $64919 $700 to $749197 $750 to $799294 $800 to $8991,104 $900 to $9991,481 $1,000 to $1,2491,628 $1,250 to $1,4991,021 $1,500 to $1,99960 $2,000 to $2,49979 $2,500 to $2,99920 $3,500 or more175 No cash rent
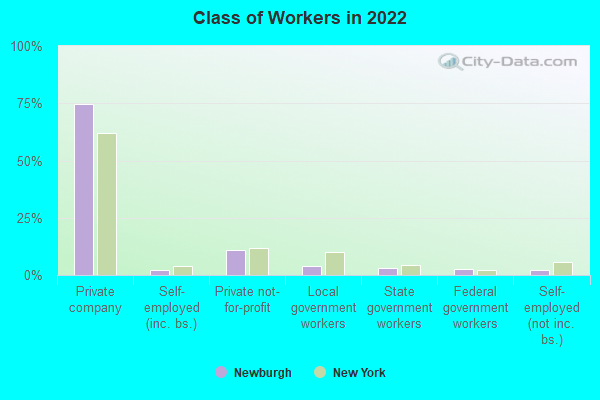
Percentage of workers working in this county: 75.9%Number of people working at home: 990 (7.9% of all workers )
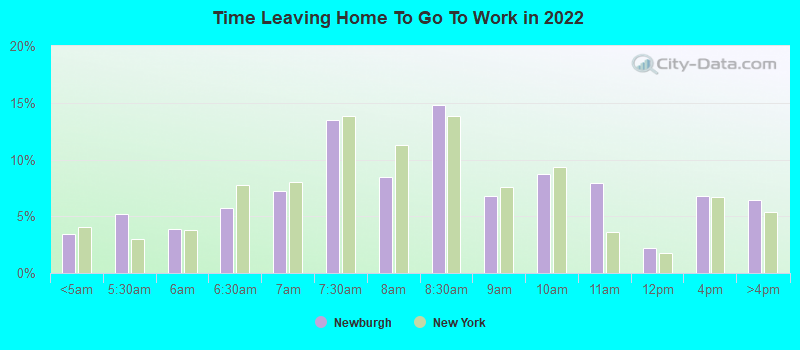
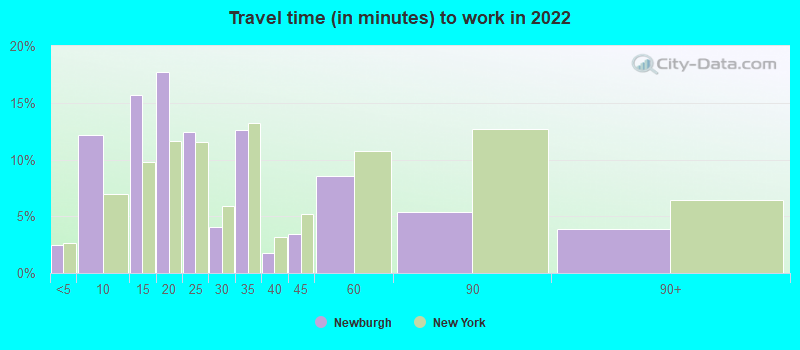
Travel time to work (commute)
Less than 5 minutes: 1075 to 9 minutes: 1,96110 to 14 minutes: 1,38515 to 19 minutes: 2,35320 to 24 minutes: 1,59025 to 29 minutes: 68930 to 34 minutes: 1,31435 to 39 minutes: 14840 to 44 minutes: 33845 to 59 minutes: 72060 to 89 minutes: 44490 or more minutes: 396
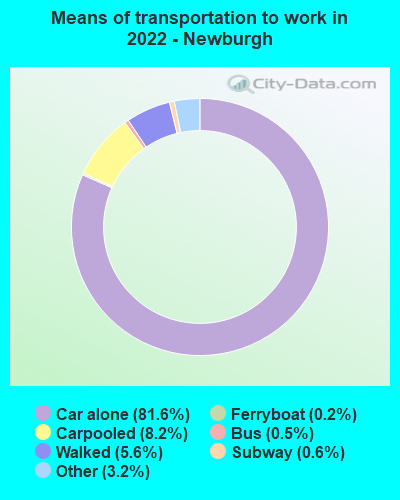
Means of transportation to work:
Drove a car alone: 10,208 (72.2%)Carpooled: 1,272 (9.0%)Bus : 87 (0.6%)Subway or elevated rail : 5 (0.0%)Long-distance train or commuter rail : 113 (0.8%)Ferryboat: 50 (0.4%)Taxi: 492 (3.5%)Bicycle: 13 (0.1%)Walked: 779 (5.5%)Worked at home: 990 (7.0%)
Unemployment by race in 2022
Unemployment rate for White non-Hispanic residents 6.8% Males6.2% FemalesUnemployment rate for Black residents 7.4% Males14.3% FemalesUnemployment rate for other race residents 6.7% Males2.5% FemalesUnemployment rate for two or more race residents 4.9% Males3.1% FemalesUnemployment rate for Hispanic or Latino residents 4.3% Males7.4% Females
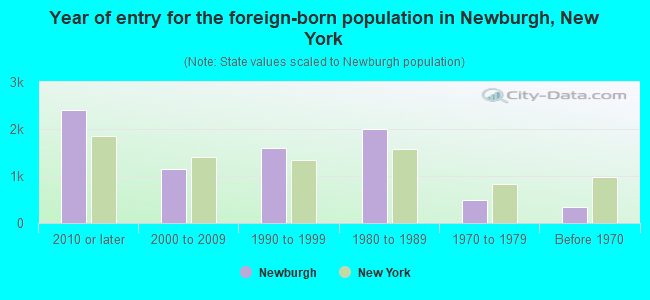
Year of entry for the foreign-born population in Newburgh, New York
2,398 2010 or later 1,154 2000 to 2009 1,593 1990 to 1999 1,991 1980 to 1989 484 1970 to 1979 345 Before 1970
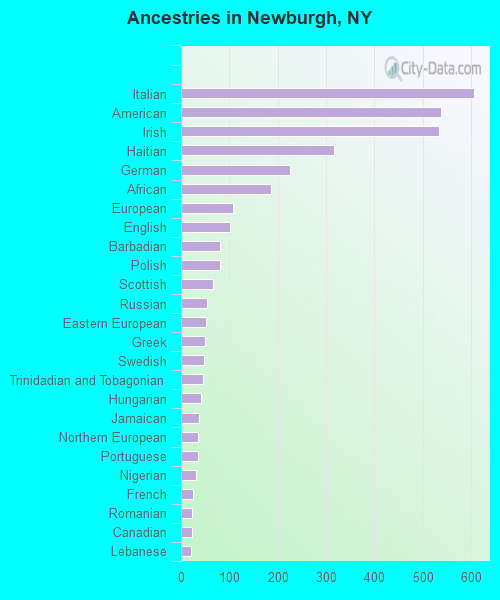
First ancestries reported:
Italian: 607 (3.7%)
American: 538 (3.3%)
Irish: 533 (3.2%)
Haitian: 316 (1.9%)
German: 225 (1.4%)
African: 186 (1.1%)
European: 108 (0.7%)
English: 101 (0.6%)
Barbadian: 81 (0.5%)
Polish: 80 (0.5%)
Scottish: 66 (0.4%)
Russian: 53 (0.3%)
Eastern European: 51 (0.3%)
Greek: 49 (0.3%)
Swedish: 47 (0.3%)
Trinidadian and Tobagonian: 45 (0.3%)
Hungarian: 41 (0.2%)
Jamaican: 37 (0.2%)
Northern European: 35 (0.2%)
Portuguese: 35 (0.2%)
Nigerian: 32 (0.2%)
French: 25 (0.2%)
Romanian: 23 (0.1%)
Canadian: 22 (0.1%)
Lebanese: 21 (0.1%)
Dutch: 20 (0.1%)
French Canadian: 17 (0.1%)
Slovak: 17 (0.1%)
Scotch-Irish: 15 (0.09%)
Ghanaian: 15 (0.09%)
Australian: 11 (0.07%) Most common places of birth for foreign-born residents (%): Mexico Newburgh:
49.1% (2,787)New York:
4.8% (214,559)
Honduras Newburgh:
13.4% (763)New York:
1.2% (55,571)
Ecuador Newburgh:
6.5% (369)New York:
3.9% (177,448)
Peru Newburgh:
5.6% (317)New York:
1.2% (54,759)
Guatemala Newburgh:
4.4% (250)New York:
1.4% (61,245)
Nicaragua Newburgh:
3.3% (185)New York:
0.2% (9,597)
Spain Newburgh:
2.7% (156)New York:
0.3% (14,949)
Trinidad and Tobago Newburgh:
2.4% (135)New York:
2.0% (91,428)
Brazil Newburgh:
1.7% (98)New York:
0.7% (30,658)
Colombia Newburgh:
1.5% (87)New York:
2.5% (111,920)
Place of birth for U.S.-born residents:
This state: 18,647Other state: 3,075Northeast: 1,305Midwest: 304South: 1,118West: 319 89.4% of Newburgh residents lived in the same house 1 years ago.
Out of people who lived in different houses, 24.7% lived in this county.
Out of people who lived in different counties, 78.0% lived in New York.
Newburgh:
89.4%State average:
89.6%
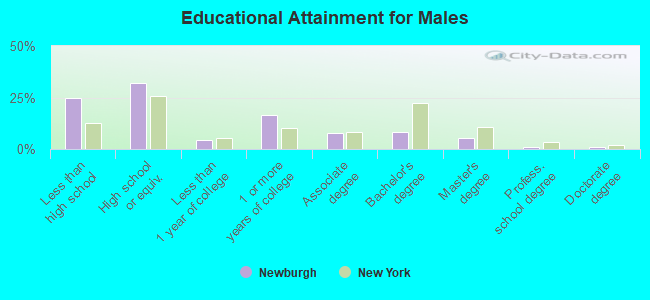
Education attainment for males 25 years and older:
No schooling: 338Nursery to 4th grade: 435th and 6th grade: 6667th and 8th grade: 989th grade: 24310th grade: 47411th grade: 20812th grade, no diploma: 41High school graduate (or equivalency): 2,713Less than 1 year of college: 352Some college more than 1 year, no degree: 1,378Associate degree: 639Bachelor's degree: 678Master's degree: 440Professional school degree: 90Doctorate degree: 67
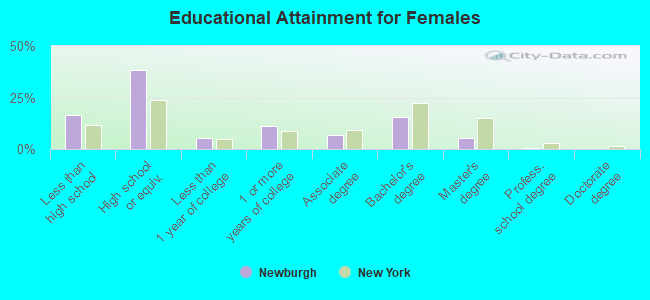
Education attainment for females 25 years and older:
No schooling: 36Nursery to 4th grade: 475th and 6th grade: 3247th and 8th grade: 2749th grade: 24210th grade: 27911th grade: 35812th grade, no diploma: 141High school graduate (or equivalency): 3,942Less than 1 year of college: 525Some college more than 1 year, no degree: 1,132Associate degree: 709Bachelor's degree: 1,601Master's degree: 569Professional school degree: 27Doctorate degree: 22
Housing units in structures:
One, detached: 3,402One, attached: 769Two: 2,4073 or 4: 2,7525 to 9: 41810 to 19: 34520 to 49: 44650 or more: 1,623Mobile homes: 64Housing units lacking complete plumbing facilities in 2022: 3.7%Housing units lacking complete kitchen facilities in 2022: 4.0%House/condo owner moved in on average 12 years ago
Renter moved in on average 3 years ago
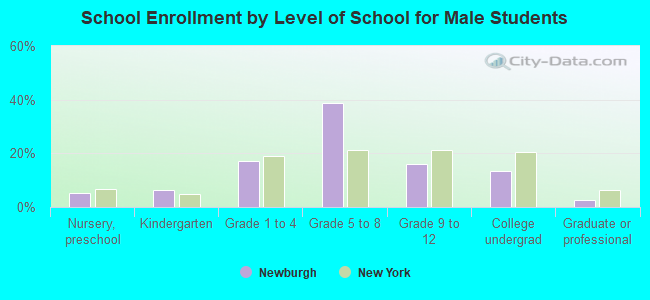
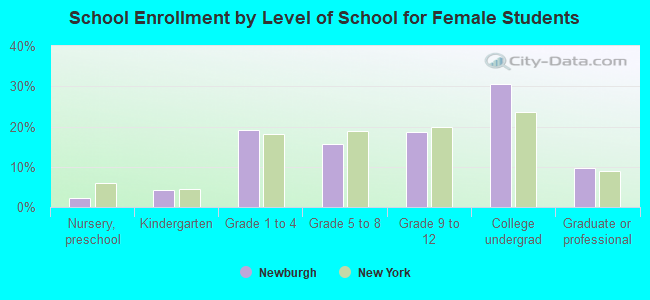
Private vs. public school enrollment:
Students in private schools in grades 1 to 8 (elementary and middle school): 344 Students in private schools in grades 9 to 12 (high school): 55 Students in private undergraduate colleges: 1,098