Newington, VA (Virginia) Houses and Residents
Estimated median house or condo value in 2022: $537,090 (it was $192,300 in 2000 )
Newington:
$537,090Virginia:
$365,700
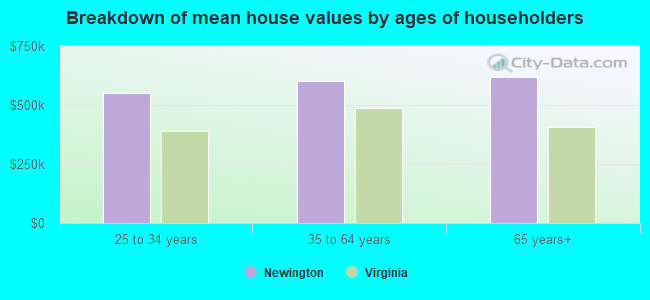
Lower value quartile - upper value quartile: $466,254 - $701,733Mean price in 2022: Detached houses: $750,257 Here:
$750,257State:
$472,865
Townhouses or other attached units: $485,313 Here:
$485,313State:
$457,437
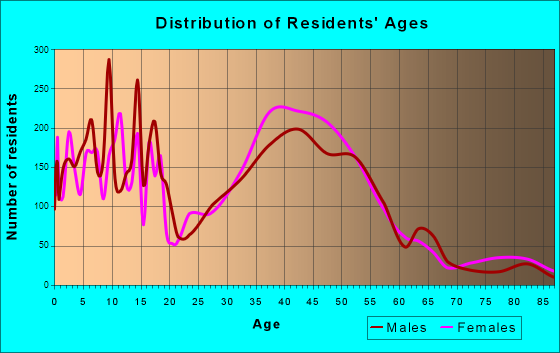
Total population: 12,943 (All urban)
Houses: 4,721 (4,641 occupied: 4,060 owner occupied, 606 renter occupied )
% of renters here:
13%State:
33%
Housing density: 711 houses/condos per square mile
Median price asked for vacant for-sale houses and condos in 2022: $1,474,584.
Median contract rent in 2022: over $2,000 (lower quartile is over $2,000, upper quartile is over $2,000)
Median rent asked for vacant for-rent units in 2022: $3,217
Median gross rent in Newington, VA in 2022: over $2,000
Housing units in Newington with a mortgage: 3,181 (291 second mortgage, 0 home equity loan, 264 both second mortgage and home equity loan )Houses without a mortgage: 121
Median household income for houses/condos with a mortgage: $162,303
Median household income for apartments without a mortgage: $146,584
Median monthly housing costs: $2,443
Data:
Median house or condo value ($)
Median house or condo value ($ change since 2000)
Median house or condo value ($) - White
Median house or condo value ($) - Black or African American
Median house or condo value ($) - Asian
Median house or condo value ($) - Hispanic or Latino
Median house or condo value ($) - American Indian and Alaska Native
Median house or condo value ($) - Multirace
Median house or condo value ($) - Other Race
Median price asked for mobile homes ($)
Household density (households per square mile)
Mean house or condo value by units in structure - 1, detached ($)
Mean house or condo value by units in structure - 1, attached ($)
Mean house or condo value by units in structure - 2 ($)
Mean house or condo value by units in structure by units in structure - 3 or 4 ($)
Mean house or condo value by units in structure - 5 or more ($)
Mean house or condo value by units in structure - Boat, RV, van, etc. ($)
Mean house or condo value by units in structure - Mobile home ($)
Median contract rent ($)
Median contract rent - Lower quartile ($)
Median contract rent - Upper quartile ($)
Median gross rent ($)
Urban houses (%)
Rural houses (%)
Houses occupied (%)
Houses occupied (% change since 2000)
Houses owner occupied (%)
Houses owner occupied (% change since 2000)
Houses renter occupied (%)
Houses renter occupied (% change since 2000)
Vacant housing units - For rent (%)
Vacant housing units - For rent (% change since 2000)
Vacant housing units - For sale only (%)
Vacant housing units - For sale only (% change since 2000)
Vacant housing units - Rented or sold, not occupied (%)
Vacant housing units - Rented or sold, not occupied (% change since 2000)
Vacant housing units - For seasonal, recreational, or occasional use (%)
Vacant housing units - For seasonal, recreational, or occasional use (% change since 2000)
Vacant housing units - For migrant workers (%)
Vacant housing units - For migrant workers (% change since 2000)
Vacant housing units - Other vacant (%)
Vacant housing units - Other vacant (% change since 2000)
Median monthly housing costs ($)
Median household income for houses/condos with a mortgage ($)
Median household income for houses/condos without a mortgage ($)
Median household income ($)
Median household income ($) - White
Median household income ($) - Black or African American
Median household income ($) - Asian
Median household income ($) - Hispanic or Latino
Median household income ($) - American Indian and Alaska Native
Median household income ($) - Multirace
Median household income ($) - Other Race
Mortgage status - with mortgage (%)
Mortgage status - with second mortgage (%)
Mortgage status - with home equity loan (%)
Mortgage status - with both second mortgage and home equity loan (%)
Mortgage status - without a mortgage (%)
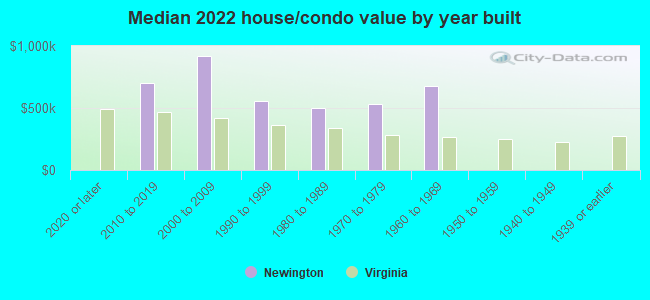
Median year house/condo built
Median year apartment built
Household type by relationship - Male householder living alone (%)
Household type by relationship - Male householder not living alone (%)
Household type by relationship - Female householder living alone (%)
Household type by relationship - Female householder not living alone (%)
Household type by relationship - Opposite-Sex spouse (%)
Household type by relationship - Same-Sex spouse (%)
Household type by relationship - Opposite-Sex unmarried partner (%)
Household type by relationship - Same-Sex unmarried partner (%)
Household type by relationship - In group quarters (%)
Size of family households - 2-person household (%)
Size of family households - 3-person household (%)
Size of family households - 4-person household (%)
Size of family households - 5-person household (%)
Size of family households - 6-person household (%)
Size of family households - 7-or-more-person household (%)
Size of nonfamily households - 1-person household (%)
Size of nonfamily households - 2-person household (%)
Size of nonfamily households - 3-person household (%)
Size of nonfamily households - 4-person household (%)
Size of nonfamily households - 5-person household (%)
Size of nonfamily households - 6-person household (%)
Size of nonfamily households - 7-or-moreperson household (%)
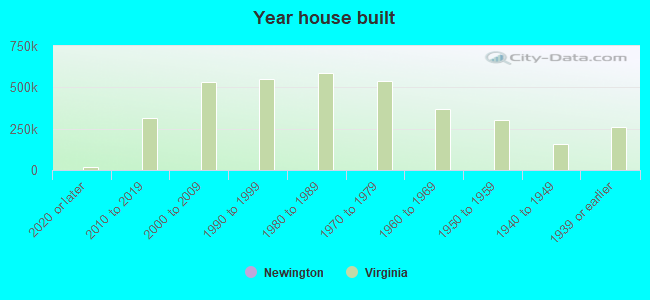
Year house built - Built 2010 or later (%)
Year house built - Built 2000 to 2009 (%)
Year house built - Built 1990 to 1999 (%)
Year house built - Built 1980 to 1989 (%)
Year house built - Built 1970 to 1979 (%)
Year house built - Built 1960 to 1969 (%)
Year house built - Built 1950 to 1959 (%)
Year house built - Built 1940 to 1949 (%)
Year house built - Built 1939 or earlier (%)
Median number of rooms in houses and condos
Median number of rooms in apartments
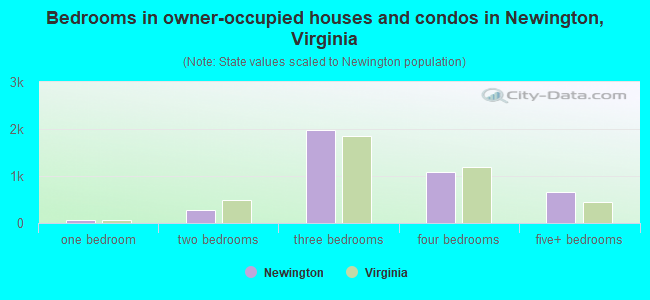
Median number of bedrooms in owner occupied houses
Mean number of bedrooms in owner occupied houses
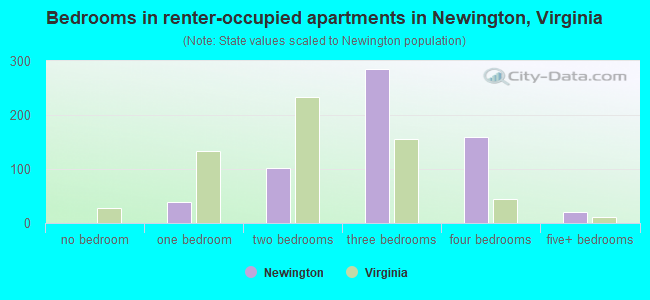
Median number of bedrooms in renter occupied houses
Mean number of bedrooms in renter occupied houses
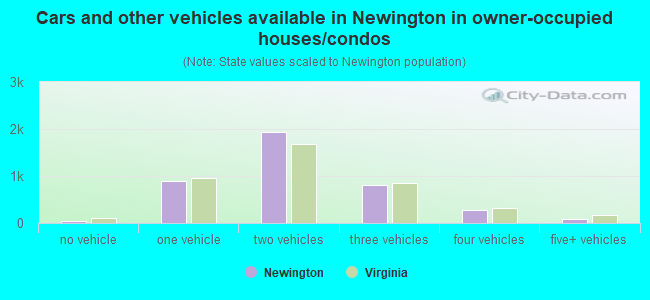
Median number of vehichles in owner occupied houses
Mean number of vehichles in owner occupied houses
Median number of vehichles in renter occupied houses
Mean number of vehichles in renter occupied houses
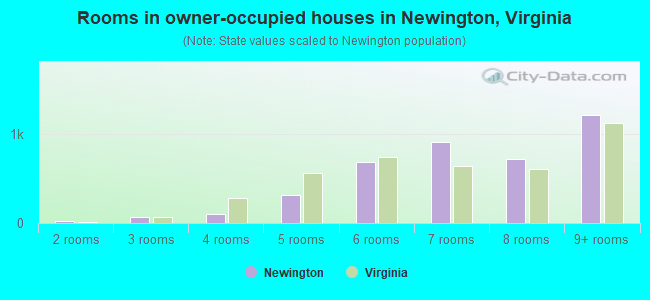
Rooms in owner-occupied houses - 1 room (%)
Rooms in owner-occupied houses - 2 rooms (%)
Rooms in owner-occupied houses - 3 rooms (%)
Rooms in owner-occupied houses - 4 rooms (%)
Rooms in owner-occupied houses - 5 rooms (%)
Rooms in owner-occupied houses - 6 rooms (%)
Rooms in owner-occupied houses - 7 rooms (%)
Rooms in owner-occupied houses - 8 rooms (%)
Rooms in owner-occupied houses - 9+ rooms (%)
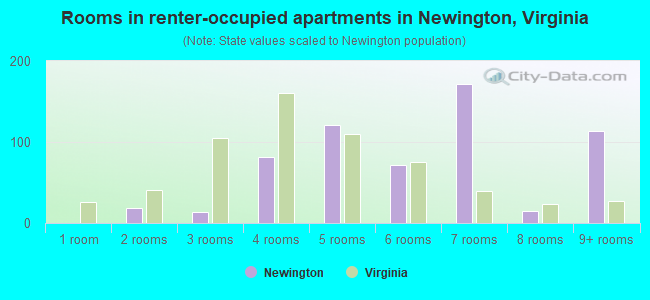
Rooms in renter-occupied houses - 1 room (%)
Rooms in renter-occupied houses - 2 rooms (%)
Rooms in renter-occupied houses - 3 rooms (%)
Rooms in renter-occupied houses - 4 rooms (%)
Rooms in renter-occupied houses - 5 rooms (%)
Rooms in renter-occupied houses - 6 rooms (%)
Rooms in renter-occupied houses - 7 rooms (%)
Rooms in renter-occupied houses - 8 rooms (%)
Rooms in renter-occupied houses - 9+ rooms (%)
Bedrooms in owner-occupied houses - no bedrooms (%)
Bedrooms in owner-occupied houses - 1 bedroom (%)
Bedrooms in owner-occupied houses - 2 bedrooms (%)
Bedrooms in owner-occupied houses - 3 bedrooms (%)
Bedrooms in owner-occupied houses - 4 bedrooms (%)
Bedrooms in owner-occupied houses - 5+ bedrooms (%)
Bedrooms in renter-occupied houses - no bedrooms (%)
Bedrooms in renter-occupied houses - 1 bedroom (%)
Bedrooms in renter-occupied houses - 2 bedrooms (%)
Bedrooms in renter-occupied houses - 3 bedrooms (%)
Bedrooms in renter-occupied houses - 4 bedrooms (%)
Bedrooms in renter-occupied houses - 5+ bedrooms (%)
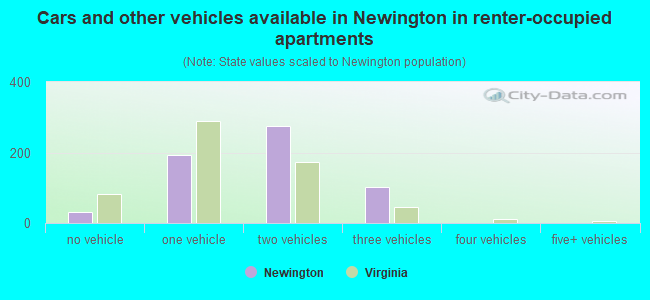
Vehicles available in owner-occupied houses - no vehicle available (%)
Vehicles available in owner-occupied houses - 1 vehicle available(%)
Vehicles available in owner-occupied houses - 2 Vehicles available (%)
Vehicles available in owner-occupied houses - 3 Vehicles available (%)
Vehicles available in owner-occupied houses - 4 Vehicles available (%)
Vehicles available in owner-occupied houses - 5+ Vehicles available (%)
Vehicles available in renter-occupied houses - no vehicle available (%)
Vehicles available in renter-occupied houses - 1 vehicle available (%)
Vehicles available in renter-occupied houses - 2 Vehicles available (%)
Vehicles available in renter-occupied houses - 3 Vehicles available (%)
Vehicles available in renter-occupied houses - 4 Vehicles available (%)
Vehicles available in renter-occupied houses - 5+ Vehicles available (%)
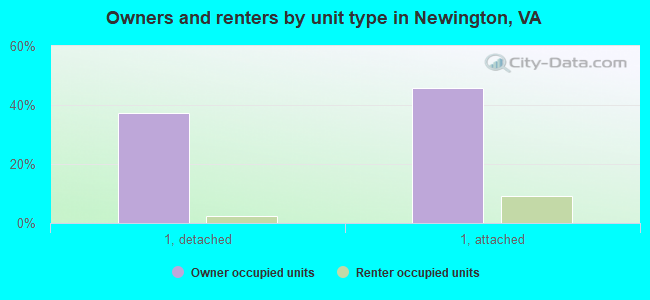
Housing units in structures - 1, detached (%)
Housing units in structures - 1, attached (%)
Housing units in structures - 2 (%)
Housing units in structures - 3 or 4 (%)
Housing units in structures - 5 to 9 (%)
Housing units in structures - 10 to 19 (%)
Housing units in structures - 20 to 49 (%)
Housing units in structures - 50 or more (%)
Housing units in structures - Mobile home (%)
Housing units in structures - Boat, RV, van, etc. (%)
Housing units in structures - Owners - 1, detached (%)
Housing units in structures - Owners - 1, attached (%)
Housing units in structures - Owners - 2 (%)
Housing units in structures - Owners - 3 or 4 (%)
Housing units in structures - Owners - 5 to 9 (%)
Housing units in structures - Owners - 10 to 19 (%)
Housing units in structures - Owners - 20 to 49 (%)
Housing units in structures - Owners - 50 or more (%)
Housing units in structures - Owners - Mobile home (%)
Housing units in structures - Owners - Boat, RV, van, etc. (%)
Housing units in structures - Renters - 1, detached (%)
Housing units in structures - Renters - 1, attached (%)
Housing units in structures - Renters - 2 (%)
Housing units in structures - Renters - 3 or 4 (%)
Housing units in structures - Renters - 5 to 9 (%)
Housing units in structures - Renters - 10 to 19 (%)
Housing units in structures - Renters - 20 to 49 (%)
Housing units in structures - Renters - 50 or more (%)
Housing units in structures - Renters - Mobile home (%)
Housing units in structures - Renters - Boat, RV, van, etc. (%)
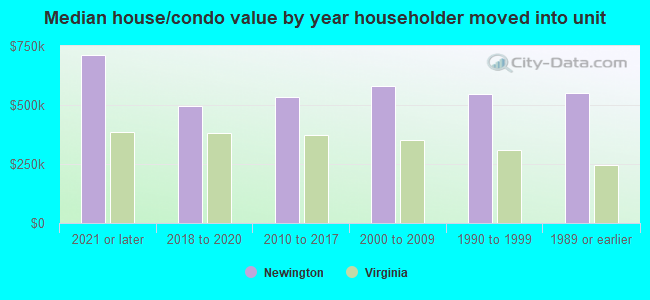
House/condo owner moved in on average (years ago)
Renter moved in on average (years ago)
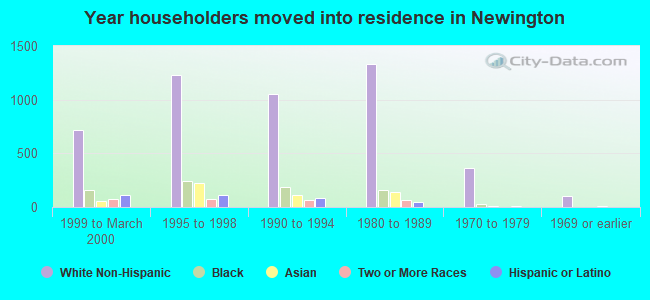
Year householder moved into unit - Moved in 1999 to March 2000 (%)
Year householder moved into unit - Moved in 1999 to March 2000 (%) - White
Year householder moved into unit - Moved in 1999 to March 2000 (%) - Black or African American
Year householder moved into unit - Moved in 1999 to March 2000 (%) - Asian
Year householder moved into unit - Moved in 1999 to March 2000 (%) - Hispanic or Latino
Year householder moved into unit - Moved in 1999 to March 2000 (%) - American Indian and Alaska Native
Year householder moved into unit - Moved in 1999 to March 2000 (%) - Multirace
Year householder moved into unit - Moved in 1999 to March 2000 (%) - Other Race
Year householder moved into unit - Moved in 1995 to 1998 (%)
Year householder moved into unit - Moved in 1995 to 1998 (%) - White
Year householder moved into unit - Moved in 1995 to 1998 (%) - Black or African American
Year householder moved into unit - Moved in 1995 to 1998 (%) - Asian
Year householder moved into unit - Moved in 1995 to 1998 (%) - Hispanic or Latino
Year householder moved into unit - Moved in 1995 to 1998 (%) - American Indian and Alaska Native
Year householder moved into unit - Moved in 1995 to 1998 (%) - Multirace
Year householder moved into unit - Moved in 1995 to 1998 (%) - Other Race
Year householder moved into unit - Moved in 1990 to 1994 (%)
Year householder moved into unit - Moved in 1990 to 1994 (%) - White
Year householder moved into unit - Moved in 1990 to 1994 (%) - Black or African American
Year householder moved into unit - Moved in 1990 to 1994 (%) - Asian
Year householder moved into unit - Moved in 1990 to 1994 (%) - Hispanic or Latino
Year householder moved into unit - Moved in 1990 to 1994 (%) - American Indian and Alaska Native
Year householder moved into unit - Moved in 1990 to 1994 (%) - Multirace
Year householder moved into unit - Moved in 1990 to 1994 (%) - Other Race
Year householder moved into unit - Moved in 1980 to 1989 (%)
Year householder moved into unit - Moved in 1980 to 1989 (%) - White
Year householder moved into unit - Moved in 1980 to 1989 (%) - Black or African American
Year householder moved into unit - Moved in 1980 to 1989 (%) - Asian
Year householder moved into unit - Moved in 1980 to 1989 (%) - Hispanic or Latino
Year householder moved into unit - Moved in 1980 to 1989 (%) - American Indian and Alaska Native
Year householder moved into unit - Moved in 1980 to 1989 (%) - Multirace
Year householder moved into unit - Moved in 1980 to 1989 (%) - Other Race
Year householder moved into unit - Moved in 1970 to 1979 (%)
Year householder moved into unit - Moved in 1970 to 1979 (%) - White
Year householder moved into unit - Moved in 1970 to 1979 (%) - Black or African American
Year householder moved into unit - Moved in 1970 to 1979 (%) - Asian
Year householder moved into unit - Moved in 1970 to 1979 (%) - Hispanic or Latino
Year householder moved into unit - Moved in 1970 to 1979 (%) - American Indian and Alaska Native
Year householder moved into unit - Moved in 1970 to 1979 (%) - Multirace
Year householder moved into unit - Moved in 1970 to 1979 (%) - Other Race
Year householder moved into unit - Moved in 1969 or earlier (%)
Year householder moved into unit - Moved in 1969 or earlier (%) - White
Year householder moved into unit - Moved in 1969 or earlier (%) - Black or African American
Year householder moved into unit - Moved in 1969 or earlier (%) - Asian
Year householder moved into unit - Moved in 1969 or earlier (%) - Hispanic or Latino
Year householder moved into unit - Moved in 1969 or earlier (%) - American Indian and Alaska Native
Year householder moved into unit - Moved in 1969 or earlier (%) - Multirace
Year householder moved into unit - Moved in 1969 or earlier (%) - Other Race
Housing units lacking complete plumbing facilities (%)
Housing units lacking complete kitchen facilities (%)
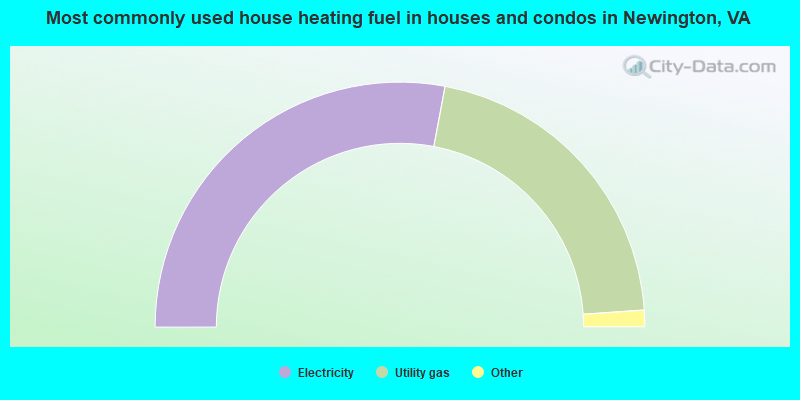
House heating fuel used in houses and condos - Utility gas (%)
House heating fuel used in houses and condos - Bottled, tank, or LP gas (%)
House heating fuel used in houses and condos - Electricity (%)
House heating fuel used in houses and condos - Fuel oil, kerosene, etc. (%)
House heating fuel used in houses and condos - Coal or coke (%)
House heating fuel used in houses and condos - Wood (%)
House heating fuel used in houses and condos - Solar energy (%)
House heating fuel used in houses and condos - Other fuel (%)
House heating fuel used in houses and condos - No fuel used (%)
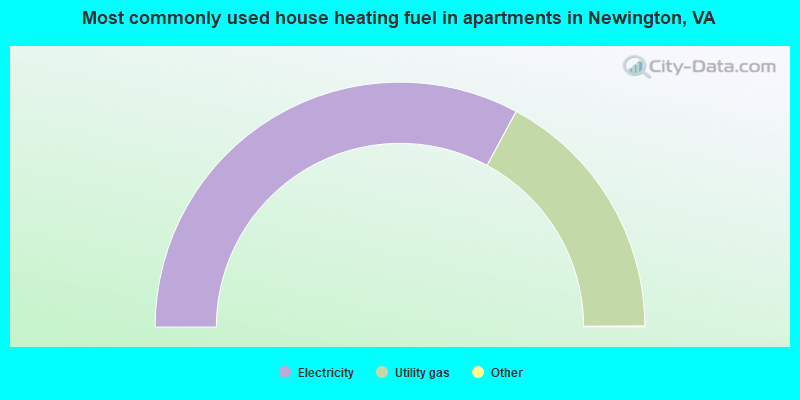
House heating fuel used in apartments - Utility gas (%)
House heating fuel used in apartments - Bottled, tank, or LP gas (%)
House heating fuel used in apartments - Electricity (%)
House heating fuel used in apartments - Fuel oil, kerosene, etc. (%)
House heating fuel used in apartments - Coal or coke (%)
House heating fuel used in apartments - Wood (%)
House heating fuel used in apartments - Solar energy (%)
House heating fuel used in apartments - Other fuel (%)
House heating fuel used in apartments - No fuel used (%)
Latest news about housing in Newington, VA collected exclusively by city-data.com from local newspapers, TV, and radio stations
Median year house/condo built: 1981Median year apartment built: 1984Household type by relationship:
Households: 13,476
Male householders: 2,632 (305 living alone ), Female householders: 1,949 (500 living alone )2,813 spouses (2,803 opposite-sex spouses ), 222 unmarried partners , (198 opposite-sex unmarried partners ), 4,305 children (4,195 natural , 45 adopted , 64 stepchildren ), 130 grandchildren , 211 brothers or sisters , 422 parents , 0 foster children , 431 other relatives , 356 non-relatives
Size of family households: 1,317 2-persons , 667 3-persons , 801 4-persons , 491 5-persons , 195 6-persons , 34 7-or-more-persons .
Size of nonfamily households: 831 1-person , 283 2-persons , 9 3-persons , 13 4-persons , 10 5-persons .
2,285 married couples with children. single-parent households (127 men , 341 women ).
64.6% of residents of Newington speak English at home. of residents speak Spanish at home (65% speak English very well , 22% speak English well , 13% speak English not well ).of residents speak other Indo-European language at home (62% speak English very well , 28% speak English well , 6% speak English not well , 4% don't speak English at all ).of residents speak Asian or Pacific Island language at home (53% speak English very well , 30% speak English well , 16% speak English not well , 1% don't speak English at all ).of residents speak other language at home (74% speak English very well , 19% speak English well , 2% speak English not well , 5% don't speak English at all ).
Foreign born population: 3,590 (26.6%)of them are naturalized citizens )
Median number of rooms in houses and condos:
Median number of rooms in apartments
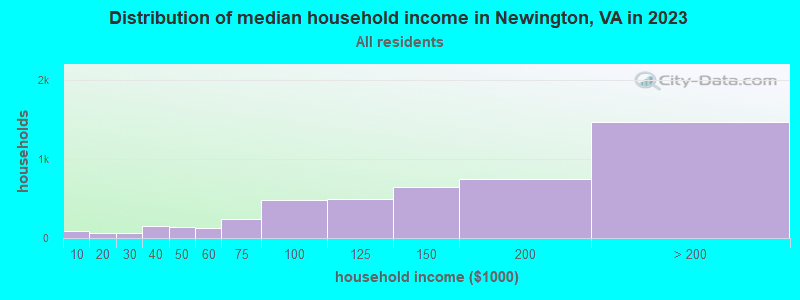
Newington, VA household income distribution 101 Less than $10,00059 $10,000 to $19,99941 $20,000 to $29,999116 $30,000 to $39,999158 $40,000 to $49,999108 $50,000 to $59,999123 $60,000 to $74,999654 $75,000 to $99,999460 $100,000 to $124,999403 $125,000 to $149,999828 $150,000 to $199,9991,621 $200,000 or more
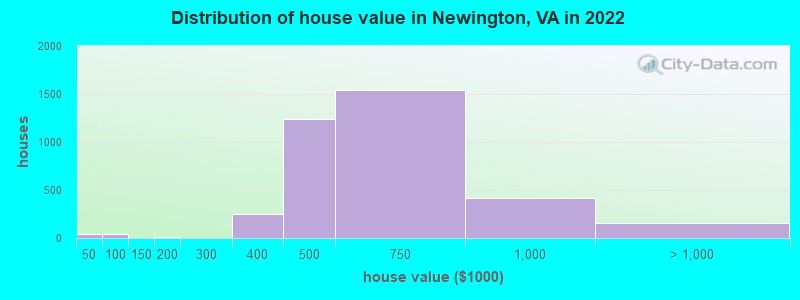
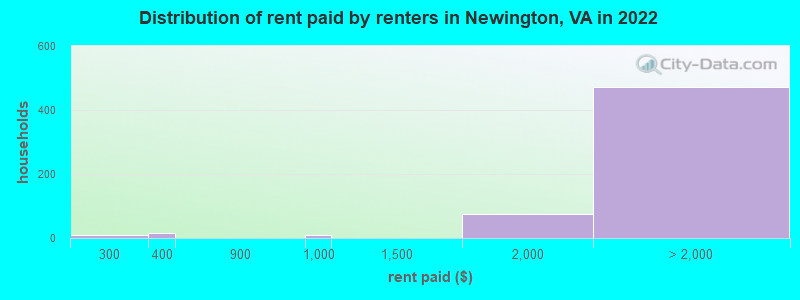
Home value of owner - occupied houses in 2022 in Newington, VA 17 Less than $10,00010 $35,000 to $39,99910 $40,000 to $49,9999 $80,000 to $89,99921 $90,000 to $99,9997 $175,000 to $199,999247 $300,000 to $399,9991,235 $400,000 to $499,9991,537 $500,000 to $749,999414 $750,000 to $999,999148 $1,000,000 to $1,499,99910 $2,000,000 or moreRent paid by renters in 2022 in Newington, VA 3 $100 to $1499 $250 to $29915 $350 to $39910 $900 to $99976 $1,500 to $1,999275 $2,000 to $2,49986 $2,500 to $2,99948 $3,000 to $3,49932 $3,500 or more29 No cash rent
Percentage of workers working in this county: 64.8%Number of people working at home: 2,348 (30.4% of all workers )
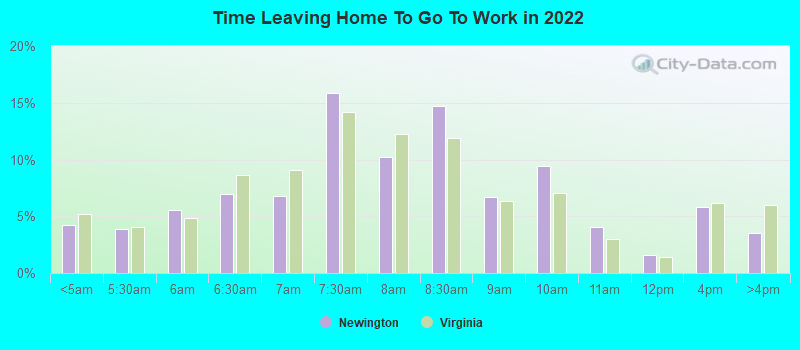
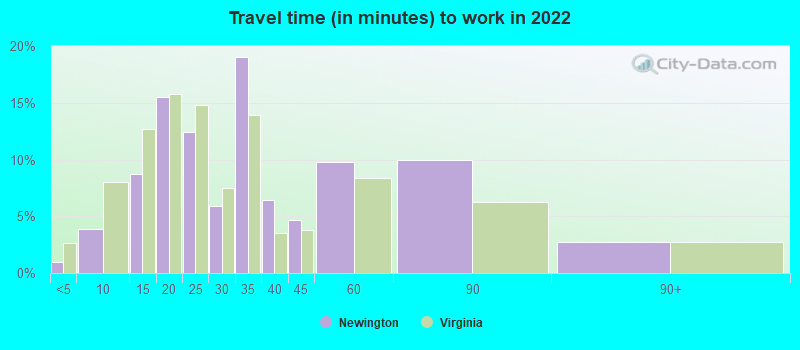
Travel time to work (commute)
Less than 5 minutes: 935 to 9 minutes: 25910 to 14 minutes: 64015 to 19 minutes: 57520 to 24 minutes: 74425 to 29 minutes: 54130 to 34 minutes: 85035 to 39 minutes: 33940 to 44 minutes: 24145 to 59 minutes: 69760 to 89 minutes: 35490 or more minutes: 54
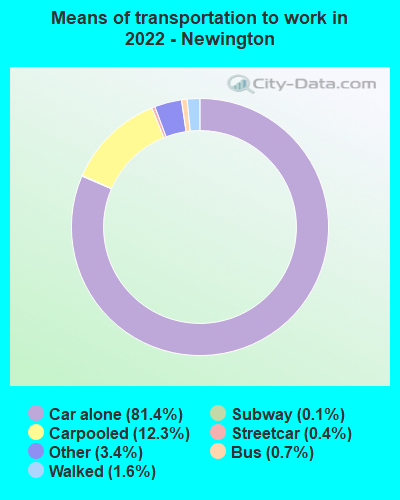
Means of transportation to work:
Drove a car alone: 7,547 (63.7%)Carpooled: 1,176 (9.9%)Bus : 44 (0.4%)Subway or elevated rail : 35 (0.3%)Long-distance train or commuter rail : 7 (0.1%)Taxi: 427 (3.6%)Walked: 172 (1.5%)Worked at home: 2,348 (19.8%)
Unemployment by race in 2022
Unemployment rate for White non-Hispanic residents 1.5% Males1.1% FemalesUnemployment rate for Black residents 4.8% FemalesUnemployment rate for Asian residents 7.7% Males2.1% FemalesUnemployment rate for two or more race residents 5.6% Males6.3% FemalesUnemployment rate for Hispanic or Latino residents 1.1% Males5.9% Females
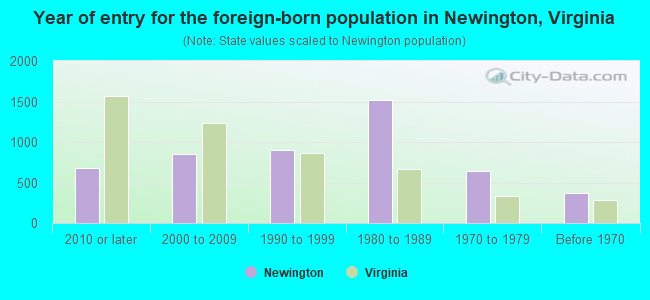
Year of entry for the foreign-born population in Newington, Virginia
675 2010 or later 846 2000 to 2009 904 1990 to 1999 1,514 1980 to 1989 641 1970 to 1979 365 Before 1970
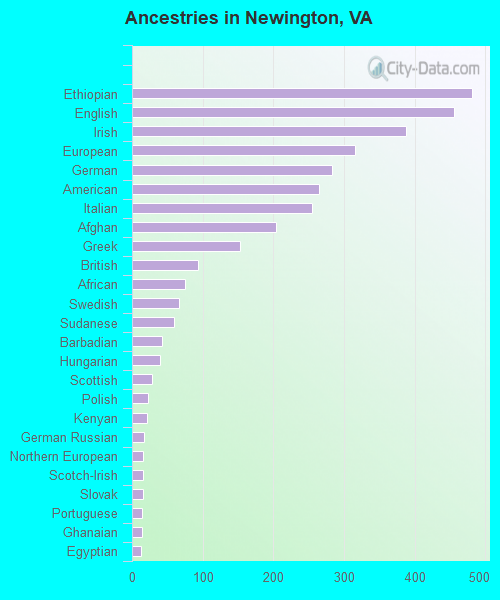
First ancestries reported:
Ethiopian: 481 (6.7%)
English: 455 (6.4%)
Irish: 388 (5.4%)
European: 315 (4.4%)
German: 283 (4.0%)
American: 264 (3.7%)
Italian: 254 (3.6%)
Afghan: 204 (2.9%)
Greek: 153 (2.1%)
British: 94 (1.3%)
African: 75 (1.1%)
Swedish: 66 (0.9%)
Sudanese: 59 (0.8%)
Barbadian: 42 (0.6%)
Hungarian: 40 (0.6%)
Scottish: 29 (0.4%)
Polish: 23 (0.3%)
Kenyan: 21 (0.3%)
German Russian: 17 (0.2%)
Northern European: 16 (0.2%)
Scotch-Irish: 15 (0.2%)
Slovak: 15 (0.2%)
Portuguese: 14 (0.2%)
Ghanaian: 14 (0.2%)
Egyptian: 13 (0.2%)
Belgian: 12 (0.2%)
Turkish: 12 (0.2%)
French: 10 (0.1%)
Czechoslovakian: 9 (0.1%)
Norwegian: 9 (0.1%)
Scandinavian: 9 (0.1%)
French Canadian: 8 (0.1%)
Lithuanian: 8 (0.1%)
Canadian: 7 (0.10%)
Ukrainian: 6 (0.08%)
Welsh: 6 (0.08%)
Dutch: 4 (0.06%)
Bulgarian: 3 (0.04%) Most common places of birth for foreign-born residents (%): Vietnam Newington:
13.1% (469)Virginia:
4.2% (45,750)
Honduras Newington:
13.0% (465)Virginia:
3.0% (32,892)
Ethiopia Newington:
12.2% (438)Virginia:
2.9% (32,082)
Philippines Newington:
7.2% (259)Virginia:
4.8% (52,629)
Afghanistan Newington:
6.6% (238)Virginia:
1.8% (19,426)
Peru Newington:
6.1% (218)Virginia:
2.4% (26,366)
El Salvador Newington:
4.2% (151)Virginia:
9.9% (107,534)
India Newington:
4.0% (145)Virginia:
9.0% (97,830)
Bangladesh Newington:
3.7% (133)Virginia:
1.1% (12,049)
Nicaragua Newington:
3.3% (119)Virginia:
0.6% (6,916)
Korea Newington:
2.5% (91)Virginia:
4.9% (52,857)
Ghana Newington:
2.0% (72)Virginia:
1.6% (17,346)
Sudan Newington:
1.6% (59)Virginia:
0.4% (4,442)
Eritrea Newington:
1.6% (58)Virginia:
0.3% (3,058)
Guatemala Newington:
1.5% (54)Virginia:
3.3% (35,938)
Place of birth for U.S.-born residents:
This state: 4,051Other state: 5,397Northeast: 1,789Midwest: 738South: 2,190West: 682 88.6% of Newington residents lived in the same house 1 years ago.
Out of people who lived in different houses, 30.5% lived in this county.
Out of people who lived in different counties, 34.7% lived in Virginia.
Newington:
88.6%State average:
86.6%
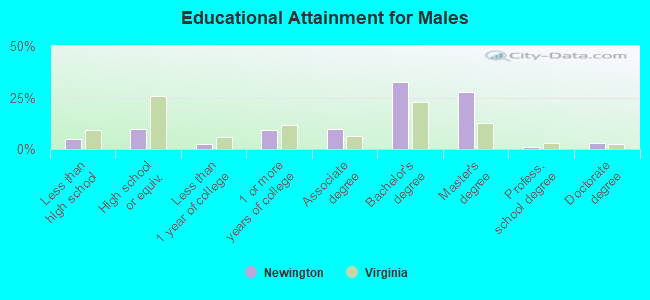
Education attainment for males 25 years and older:
No schooling: 113Nursery to 4th grade: 05th and 6th grade: 07th and 8th grade: 09th grade: 710th grade: 1411th grade: 7512th grade, no diploma: 32High school graduate (or equivalency): 453Less than 1 year of college: 120Some college more than 1 year, no degree: 433Associate degree: 465Bachelor's degree: 1,549Master's degree: 1,307Professional school degree: 45Doctorate degree: 128
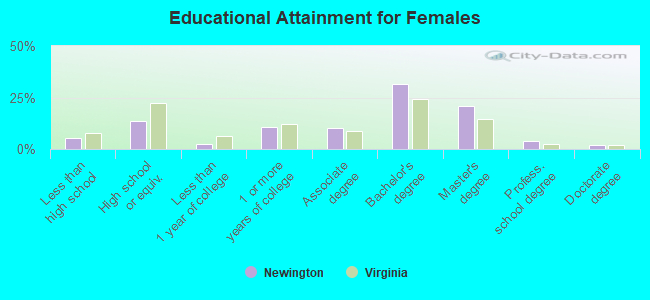
Education attainment for females 25 years and older:
No schooling: 73Nursery to 4th grade: 695th and 6th grade: 517th and 8th grade: 09th grade: 010th grade: 711th grade: 912th grade, no diploma: 52High school graduate (or equivalency): 643Less than 1 year of college: 119Some college more than 1 year, no degree: 503Associate degree: 475Bachelor's degree: 1,502Master's degree: 989Professional school degree: 178Doctorate degree: 91
Housing units in structures:
One, detached: 1,868One, attached: 2,7623 or 4: 1010 to 19: 6650 or more: 14House/condo owner moved in on average 13 years ago
Renter moved in on average 4 years ago
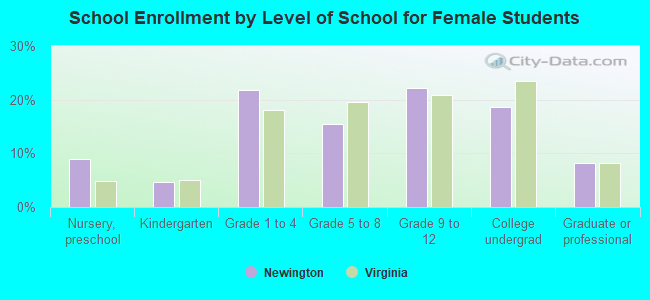
Private vs. public school enrollment:
Students in private schools in grades 1 to 8 (elementary and middle school): 287 Students in private schools in grades 9 to 12 (high school): 92 Students in private undergraduate colleges: 157