Newport Coast, CA (California) Houses and Residents
| Newport Coast: | $3,591,412 |
| California: | $715,900 |
Total population: 2,765 (Urban population: 2,658, Rural population: 0)
Houses: 1,079 (984 occupied: 963 owner occupied, 21 renter occupied)
| % of renters here: | 2% |
| State: | 44% |
Housing density: 153 houses/condos per square mile
Median price asked for vacant for-sale houses and condos in 2022 in this county: $1,279,555.
Median contract rent in 2022: over $2,000
Median rent asked for vacant for-rent units in 2022: $4,938
Median gross rent in Newport Coast, CA in 2022: over $2,000
Housing units in Newport Coast with a mortgage: 804 (63 second mortgage, 46 home equity loan, 9 both second mortgage and home equity loan)
Houses without a mortgage: 97
Compare current foreclosures near Newport Coast, CA:
| Photo | Address | Area | Beds / Baths | Price | Details |
|---|---|---|---|---|---|

|
#1
Anjou
Newport Coast, CA 92657
|
- sq. feet
|
2 baths 2 beds |
show details | |

|
#2
Newport Coast Dr # 148
Newport Coast, CA 92657
|
- sq. feet
|
- baths - beds |
show details | |

|
#3
Via Mariposa E Unit C
Laguna Hills, CA 92637
|
1,325 sq. feet
|
2 baths 2 beds |
$399,000
|
show details |

|
#4
Starcatcher
Newport Coast, CA 92657
|
- sq. feet
|
- baths - beds |
show details | |

|
#5
Tidal Surf
Newport Coast, CA 92657
|
- sq. feet
|
- baths - beds |
show details | |

|
#6
Gondoliers Blf
Newport Coast, CA 92657
|
- sq. feet
|
- baths - beds |
show details | |

|
#7
Vernon
Newport Coast, CA 92657
|
- sq. feet
|
- baths - beds |
show details | |

|
#8
Leucadia
Irvine, CA 92602
|
- sq. feet
|
2 baths 3 beds |
$950,000
|
show details |

|
#9
Starburst Ct # 8
Newport Beach, CA 92663
|
1,157 sq. feet
|
2 baths 2 beds |
show details | |

|
#10
Seton Rd
Irvine, CA 92612
|
1,779 sq. feet
|
2 baths 3 beds |
show details |
| Photo | Address | Area | Beds / Baths | Price | Details |
|---|---|---|---|---|---|

|
#11
Cliff Dr
Newport Beach, CA 92663
|
5,630 sq. feet
|
7 baths 6 beds |
show details | |

|
#12
Jackson St
Garden Grove, CA 92841
|
- sq. feet
|
1 baths 4 beds |
show details | |

|
#13
Carmel Dr
Lake Forest, CA 92630
|
1,549 sq. feet
|
2 baths 3 beds |
show details | |

|
#14
Zancon
Mission Viejo, CA 92692
|
1,123 sq. feet
|
2 baths 3 beds |
show details | |

|
#15
Clarissa St
Garden Grove, CA 92840
|
1,098 sq. feet
|
2 baths 3 beds |
show details | |

|
#16
Los Rios St # 13
San Juan Capistrano, CA 92675
|
1,141 sq. feet
|
2 baths 3 beds |
show details | |

|
#17
Cecil Pl
Costa Mesa, CA 92627
|
2,104 sq. feet
|
2 baths 3 beds |
show details | |

|
#18
Greenmoor
Irvine, CA 92614
|
1,171 sq. feet
|
2 baths 2 beds |
show details | |

|
#19
E Turin Ave
Anaheim, CA 92805
|
1,436 sq. feet
|
2 baths 3 beds |
show details | |

|
#20
Scholarship
Irvine, CA 92612
|
1,349 sq. feet
|
1 baths 1 beds |
show details |
| Photo | Address | Area | Beds / Baths | Price | Details |
|---|---|---|---|---|---|

|
#21
S Towner St
Santa Ana, CA 92707
|
1,669 sq. feet
|
2 baths 3 beds |
show details | |

|
#22
Silverado Canyon Rd
Silverado, CA 92676
|
1,032 sq. feet
|
2 baths 3 beds |
show details | |

|
#23
Eastbridge St
Westminster, CA 92683
|
1,781 sq. feet
|
3 baths 3 beds |
show details | |

|
#24
S Hilda St
Anaheim, CA 92806
|
1,853 sq. feet
|
4 baths 4 beds |
show details | |

|
#25
S Hilda St
Anaheim, CA 92806
|
1,820 sq. feet
|
2 baths 4 beds |
show details | |

|
#26
Wedgewood
Irvine, CA 92620
|
2,804 sq. feet
|
3 baths 5 beds |
show details | |

|
#27
N Malena Dr
Orange, CA 92869
|
1,941 sq. feet
|
2 baths 3 beds |
show details | |

|
#28
Geranium
Irvine, CA 92618
|
1,344 sq. feet
|
2 baths 2 beds |
show details | |

|
#29
Fanwood Dr
Huntington Beach, CA 92649
|
2,336 sq. feet
|
2 baths 3 beds |
show details | |

|
#30
San Torini Rd
Mission Viejo, CA 92692
|
1,729 sq. feet
|
2 baths 3 beds |
show details |
| Photo | Address | Area | Beds / Baths | Price | Details |
|---|---|---|---|---|---|

|
#31
S Daisy Ave
Santa Ana, CA 92703
|
1,088 sq. feet
|
1 baths 3 beds |
show details | |

|
#32
Calendula Ave
Fountain Valley, CA 92708
|
1,615 sq. feet
|
2 baths 4 beds |
show details | |

|
#33
Caminito Basilio # 348
Laguna Hills, CA 92653
|
841 sq. feet
|
1 baths 2 beds |
show details | |

|
#34
Flower St
Costa Mesa, CA 92627
|
- sq. feet
|
1 baths 3 beds |
show details | |

|
#35
Firebrand St
Garden Grove, CA 92840
|
1,210 sq. feet
|
1 baths 3 beds |
show details | |

|
#36
Riata St
Midway City, CA 92655
|
1,039 sq. feet
|
1 baths 3 beds |
show details | |

|
#37
Devonwood Ave
Garden Grove, CA 92841
|
1,238 sq. feet
|
2 baths 3 beds |
show details | |

|
#38
Tobago
Laguna Niguel, CA 92677
|
1,605 sq. feet
|
3 baths 3 beds |
show details | |

|
#39
Santa Andrea St
Fountain Valley, CA 92708
|
- sq. feet
|
2 baths 4 beds |
show details | |

|
#40
Via Joaquin
Rancho Santa Margarita, CA 92688
|
1,100 sq. feet
|
2 baths 3 beds |
show details |
| Photo | Address | Area | Beds / Baths | Price | Details |
|---|---|---|---|---|---|

|
#41
Mossford Dr
Huntington Beach, CA 92646
|
1,540 sq. feet
|
2 baths 4 beds |
show details | |

|
#42
Glocamora Ln
San Juan Capistrano, CA 92675
|
4,337 sq. feet
|
3 baths 3 beds |
show details | |

|
#43
Shady Ln
Laguna Beach, CA 92651
|
995 sq. feet
|
2 baths 3 beds |
show details | |

|
#44
Tulare Dr
Costa Mesa, CA 92626
|
2,400 sq. feet
|
4 baths 4 beds |
show details | |

|
#45
W Cris Ave
Anaheim, CA 92802
|
1,766 sq. feet
|
2 baths 3 beds |
show details | |

|
#46
Daybreak Ln
Rancho Santa Margarita, CA 92688
|
1,420 sq. feet
|
2 baths 3 beds |
show details | |

|
#47
W Berkeley St
Santa Ana, CA 92707
|
973 sq. feet
|
1 baths 3 beds |
show details | |

|
#48
Nevada
Irvine, CA 92606
|
2,972 sq. feet
|
3 baths 5 beds |
show details | |

|
#49
Ponderosa St
Fountain Valley, CA 92708
|
2,108 sq. feet
|
3 baths 5 beds |
show details | |

|
Check over 1 million property listings on Foreclosure.com!
|
browse all offers | |||

 | Orange County Real Estate Trends (206 replies) |
| Has anyone used Irvine Company Apartments - Apartment Communities (24 replies) |
| OC housing hits record high:655k (218 replies) |
| An Ethnic Family in Newport Beach? (52 replies) |
| How did home prices fare in Newport Beach/Laguna Beach during the Great Recession? (24 replies) |
| Do people really ever own multi-million dollar homes? (18 replies) |

Household type by relationship:
Households: 2,970,996- In family households: 2,574,637 (510,612 male householders, 197,879 female householders)
538,268 spouses, 917,395 children (868,578 natural, 16,498 adopted, 32,319 stepchildren), 67,543 grandchildren, 54,495 brothers or sisters, 47,670 parents, foster children, 85,984 other relatives, 117,563 non-relatives
- In nonfamily households: 396,359 (130,596 male householders (87,348 living alone)), 153,694 female householders (120,501 living alone)), 112,069 nonrelatives
- In group quarters: 39,236 (14,531 institutionalized population)
546,370 married couples with children.
125,951 single-parent households (34,925 men, 91,026 women).
68.0% of residents of Newport Coast speak English at home.
5.4% of residents speak Spanish at home (84% speak English very well, 7% speak English well, 9% speak English not well).
15.2% of residents speak other Indo-European language at home (78% speak English very well, 17% speak English well, 2% speak English not well, 2% don't speak English at all).
10.2% of residents speak Asian or Pacific Island language at home (76% speak English very well, 10% speak English well, 14% speak English not well).
1.2% of residents speak other language at home (100% speak English very well).
Foreign born population: 687 (23.4%)
(103.8% of them are naturalized citizens)
| Here: | 7.1 |
| State: | 6.0 |
| Here: | 7.8 |
| State: | 3.9 |

- Bedrooms in owner-occupied houses and condos in Newport Coast, California
- 0no bedroom
- 91 bedroom
- 1002 bedrooms
- 3383 bedrooms
- 3684 bedrooms
- 1485+ bedrooms

- Bedrooms in renter-occupied apartments in Newport Coast, California
- 0no bedroom
- 01 bedroom
- 02 bedrooms
- 123 bedrooms
- 94 bedrooms
- 05+ bedrooms

- Cars and other vehicles available in Newport Coast in owner-occupied houses/condos
- 18no vehicle
- 1401 vehicle
- 4982 vehicles
- 2203 vehicles
- 614 vehicles
- 265+ vehicles

- Cars and other vehicles available in Newport Coast in renter-occupied apartments
- 0no vehicle
- 01 vehicle
- 212 vehicles
- 03 vehicles
- 04 vehicles
- 05+ vehicles

- Rooms in owner-occupied houses in Newport Coast, California
- 01 room
- 02 rooms
- 93 rooms
- 344 rooms
- 1125 rooms
- 1586 rooms
- 1457 rooms
- 1798 rooms
- 3269+ rooms

- Rooms in renter-occupied apartments in Newport Coast, California
- 01 room
- 02 rooms
- 03 rooms
- 04 rooms
- 05 rooms
- 126 rooms
- 97 rooms
- 08 rooms
- 09+ rooms


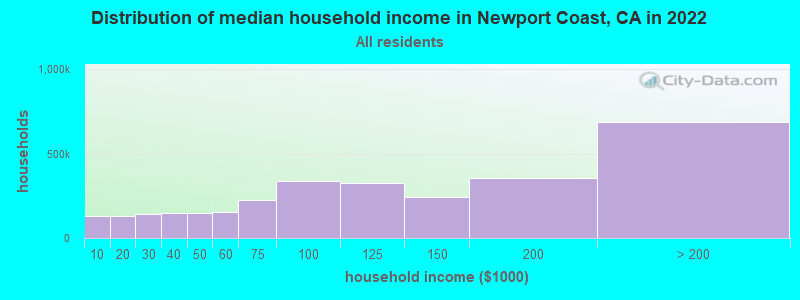
Newport Coast, CA household income distribution

- 129,640Less than $10,000
- 133,055$10,000 to $19,999
- 144,532$20,000 to $29,999
- 146,766$30,000 to $39,999
- 145,948$40,000 to $49,999
- 154,388$50,000 to $59,999
- 224,090$60,000 to $74,999
- 339,910$75,000 to $99,999
- 328,953$100,000 to $124,999
- 245,723$125,000 to $149,999
- 357,041$150,000 to $199,999
- 687,792$200,000 or more
Percentage of workers working in this county: 84.9%
Number of people working at home: 278 (17.8% of all workers)
Travel time to work (commute)
- Less than 5 minutes: 9
- 5 to 9 minutes: 65
- 10 to 14 minutes: 231
- 15 to 19 minutes: 220
- 20 to 24 minutes: 199
- 25 to 29 minutes: 43
- 30 to 34 minutes: 109
- 35 to 39 minutes: 29
- 40 to 44 minutes: 35
- 45 to 59 minutes: 88
- 60 to 89 minutes: 151
- 90 or more minutes: 54
Means of transportation to work:
- Drove a car alone: 1,122 (86.4%)
- Carpooled: 75 (5.8%)
- Subway or elevated: 15 (1.2%)
- Railroad: 9 (0.7%)
- Other means: 12 (0.9%)
- Worked at home: 65 (5.0%)


- Year of entry for the foreign-born population in Newport Coast, California
- 721995 to March 2000
- 401990 to 1994
- 1201985 to 1989
- 1241980 to 1984
- 781975 to 1979
- 361970 to 1974
- 551965 to 1969
- 88Before 1965

First ancestries reported:
- Other: 1,121 (36.9%)
- German: 320 (10.5%)
- English: 265 (8.7%)
- Russian: 218 (7.2%)
- Irish: 206 (6.8%)
- Italian: 193 (6.3%)
- Polish: 162 (5.3%)
- French: 98 (3.2%)
- Swedish: 84 (2.8%)
- Scottish: 82 (2.7%)
- United States: 77 (2.5%)
- Hungarian: 48 (1.6%)
- Swiss: 44 (1.4%)
- Scotch-Irish: 36 (1.2%)
- French Canadian: 29 (1.0%)
- Norwegian: 21 (0.7%)
- Welsh: 10 (0.3%)
- Danish: 9 (0.3%)
- Dutch: 9 (0.3%)
- Greek: 9 (0.3%)
Most common places of birth for foreign-born residents (%):
| Newport Coast: | 29.0% (178) |
| California: | 1.8% (158,613) |
| Newport Coast: | 8.3% (51) |
| California: | 3.0% (268,452) |
| Newport Coast: | 8.0% (49) |
| California: | 4.7% (418,249) |
| Newport Coast: | 6.7% (41) |
| California: | 1.1% (98,160) |
| Newport Coast: | 5.9% (36) |
| California: | 1.3% (112,212) |
| Newport Coast: | 5.4% (33) |
| California: | 3.7% (327,611) |
| Newport Coast: | 3.4% (21) |
| California: | 1.7% (151,775) |
| Newport Coast: | 2.6% (16) |
| California: | 2.2% (198,201) |
| Newport Coast: | 2.4% (15) |
| California: | 0.2% (13,359) |
| Newport Coast: | 2.4% (15) |
| California: | 0.1% (7,741) |
| Newport Coast: | 2.3% (14) |
| California: | 0.4% (35,083) |
| Newport Coast: | 2.1% (13) |
| California: | 0.3% (24,350) |
| Newport Coast: | 2.0% (12) |
| California: | 4.1% (359,673) |
| Newport Coast: | 1.8% (11) |
| California: | 0.7% (64,411) |
| Newport Coast: | 1.6% (10) |
| California: | 0.1% (12,122) |
Place of birth for U.S.-born residents:
- This state: 1,295
- Other state: 750
- Northeast: 267
- Midwest: 304
- South: 96
- West: 83
12% of Newport Coast residents lived in the same house 5 years ago.
Out of people who lived in different houses, 69% lived in this county.
Out of people who lived in different counties, 71% lived in California.
Education attainment for males 25 years and older:
- No schooling: 0
- Nursery to 4th grade: 0
- 5th and 6th grade: 0
- 7th and 8th grade: 0
- 9th grade: 0
- 10th grade: 0
- 11th grade: 0
- 12th grade, no diploma: 0
- High school graduate (or equivalency): 17
- Less than 1 year of college: 21
- Some college more than 1 year, no degree: 26
- Associate degree: 50
- Bachelor's degree: 353
- Master's degree: 189
- Professional school degree: 182
- Doctorate degree: 40

Education attainment for females 25 years and older:
- No schooling: 0
- Nursery to 4th grade: 0
- 5th and 6th grade: 12
- 7th and 8th grade: 8
- 9th grade: 8
- 10th grade: 0
- 11th grade: 0
- 12th grade, no diploma: 0
- High school graduate (or equivalency): 68
- Less than 1 year of college: 29
- Some college more than 1 year, no degree: 184
- Associate degree: 53
- Bachelor's degree: 414
- Master's degree: 131
- Professional school degree: 80
- Doctorate degree: 0


Housing units in structures:
- One, detached: 823
- One, attached: 198
- Two: 9
- 3 or 4: 5
- 5 to 9: 9
- 10 to 19: 26
- 20 to 49: 9

Private vs. public school enrollment:
| Here: | 48.4% |
| California: | 9.9% |
| Here: | 30.0% |
| California: | 7.8% |
| Here: | 38.1% |
| California: | 15.4% |


