Niles, IL (Illinois) Houses and Residents
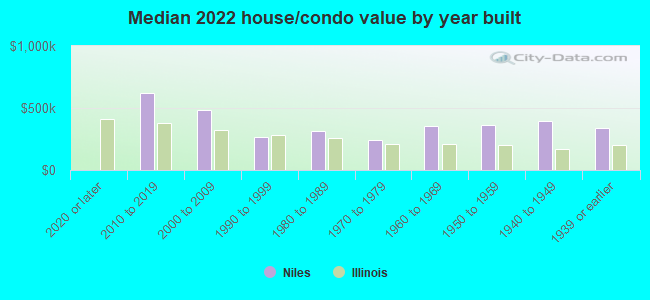
| Niles: | $345,014 |
| Illinois: | $251,600 |
Mean price in 2022:
Detached houses: $418,750
Here: $418,750 State: $310,164 Townhouses or other attached units: $276,960
Here: $276,960 State: $286,230 In 2-unit structures: $338,969
Here: $338,969 State: $299,638 In 3-to-4-unit structures: $393,598
Here: $393,598 State: $330,907 In 5-or-more-unit structures: $228,994
Here: $228,994 State: $318,887
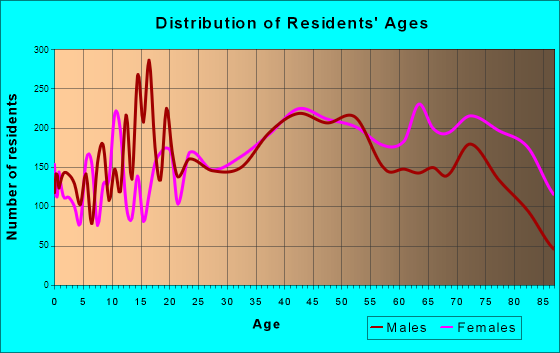
Total population: 30,000 (All urban)
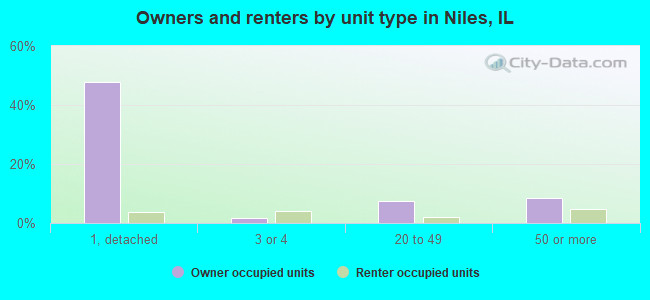
Houses: 11,969 (11,380 occupied: 8,851 owner occupied, 2,723 renter occupied)
| % of renters here: | 24% |
| State: | 33% |
Housing density: 2,037 houses/condos per square mile
Median price asked for vacant for-sale houses and condos in 2022: $249,278.
Median contract rent in 2022: $1,136 (lower quartile is $982, upper quartile is $1,404)
Median rent asked for vacant for-rent units in 2022: $1,553
Median gross rent in Niles, IL in 2022: $1,211
Housing units in Niles with a mortgage: 5,004 (374 second mortgage, 16 home equity loan, 280 both second mortgage and home equity loan)
Houses without a mortgage: 250
Median household income for houses/condos with a mortgage: $111,563
Median household income for apartments without a mortgage: $57,025
Median monthly housing costs: $1,298
Compare current foreclosures in Niles, IL:
| Photo | Address | Area | Beds / Baths | Price | Details |
|---|---|---|---|---|---|

|
#1
W Jonquil Ter
Niles, IL 60714
|
1,139 sq. feet
|
1 baths - beds |
show details | |

|
#2
N Joey Dr
Niles, IL 60714
|
1,189 sq. feet
|
1 baths - beds |
show details | |

|
#3
W Greenleaf St
Niles, IL 60714
|
1,666 sq. feet
|
1 baths - beds |
show details | |

|
#4
N Octavia Ave
Niles, IL 60714
|
1,032 sq. feet
|
1 baths - beds |
show details | |

|
#5
W Oakton St
Niles, IL 60714
|
1,008 sq. feet
|
1 baths - beds |
show details | |

|
#6
W Oakton St
Niles, IL 60714
|
1,228 sq. feet
|
1 baths - beds |
show details | |

|
#7
W Monroe St
Niles, IL 60714
|
1,276 sq. feet
|
1 baths - beds |
show details | |

|
#8
N Grace Ave
Niles, IL 60714
|
2,887 sq. feet
|
2 baths - beds |
show details | |

|
#9
W Keeney St
Niles, IL 60714
|
2,820 sq. feet
|
2 baths - beds |
show details | |

|
#10
W Niles Ave
Niles, IL 60714
|
1,568 sq. feet
|
2 baths - beds |
show details |
| Photo | Address | Area | Beds / Baths | Price | Details |
|---|---|---|---|---|---|

|
#11
N Ottawa Ave
Niles, IL 60714
|
1,508 sq. feet
|
2 baths - beds |
show details | |

|
#12
W Wright Ter
Niles, IL 60714
|
1,128 sq. feet
|
1 baths - beds |
show details | |

|
#13
W Park Ave
Niles, IL 60714
|
1,378 sq. feet
|
2 baths - beds |
show details | |

|
#14
N Neva Ave
Niles, IL 60714
|
1,470 sq. feet
|
1 baths - beds |
show details | |

|
#15
W Crain St
Niles, IL 60714
|
1,112 sq. feet
|
1 baths - beds |
show details | |

|
#16
W Normal Ave
Niles, IL 60714
|
1,095 sq. feet
|
1 baths - beds |
show details | |

|
#17
N Harlem Ave
Niles, IL 60714
|
1,205 sq. feet
|
1 baths - beds |
show details | |

|
#18
W Oakton Ct
Niles, IL 60714
|
1,237 sq. feet
|
1 baths - beds |
show details | |

|
#19
N Caldwell Ave
Niles, IL 60714
|
895 sq. feet
|
1 baths - beds |
show details | |

|
#20
W Carol Ave
Niles, IL 60714
|
1,588 sq. feet
|
2 baths - beds |
show details |
| Photo | Address | Area | Beds / Baths | Price | Details |
|---|---|---|---|---|---|

|
#21
N Wisner St
Niles, IL 60714
|
2,262 sq. feet
|
2 baths - beds |
show details | |

|
#22
N Greenwood Ave
Niles, IL 60714
|
1,353 sq. feet
|
1 baths - beds |
show details | |

|
#23
N Osceola Ave
Niles, IL 60714
|
1,512 sq. feet
|
1 baths - beds |
show details | |

|
#24
N Elmore St
Niles, IL 60714
|
1,654 sq. feet
|
1 baths - beds |
show details | |

|
#25
N Nora Ave
Niles, IL 60714
|
1,092 sq. feet
|
1 baths - beds |
show details | |

|
#26
W Betty Ter
Niles, IL 60714
|
1,341 sq. feet
|
2 baths - beds |
show details | |

|
#27
N Nora Ave
Niles, IL 60714
|
1,175 sq. feet
|
1 baths - beds |
show details | |

|
#28
N New England Ave
Niles, IL 60714
|
3,382 sq. feet
|
1 baths - beds |
show details | |

|
#29
W Oakton St
Niles, IL 60714
|
992 sq. feet
|
1 baths - beds |
show details | |

|
#30
N Washington St Apt B
Niles, IL 60714
|
- sq. feet
|
- baths - beds |
show details |
| Photo | Address | Area | Beds / Baths | Price | Details |
|---|---|---|---|---|---|

|
#31
N Root St Apt 3
Niles, IL 60714
|
- sq. feet
|
- baths - beds |
show details | |

|
#32
W Terrace Dr Apt 3h
Niles, IL 60714
|
- sq. feet
|
- baths - beds |
show details | |

|
#33
W Park Ln
Niles, IL 60714
|
- sq. feet
|
- baths - beds |
show details | |

|
#34
N Nordica Ave Apt 1a
Niles, IL 60714
|
- sq. feet
|
- baths - beds |
show details | |

|
#35
N Milwaukee Ave Apt Gn
Niles, IL 60714
|
- sq. feet
|
- baths - beds |
show details | |

|
#36
N Milwaukee Ave
Niles, IL 60714
|
- sq. feet
|
- baths - beds |
show details | |

|
#37
N Milwaukee Ave Apt 206
Niles, IL 60714
|
- sq. feet
|
- baths - beds |
show details | |

|
Check over 1 million property listings on Foreclosure.com!
|
browse all offers | |||

Latest news about housing in Niles, IL collected exclusively by city-data.com from local newspapers, TV, and radio stations

 | Chicago Suburbs Real Estate (111 replies) |
| Are stagnant home prices really a bad thing? (63 replies) |
| Finding our forever home in the north shore or northwest suburbs (3 replies) |
| Manhattan: 98% White? (39 replies) |
| Park Ridge Real Estate Market (4 replies) |
| Northern Chicago Suburbs Suggestions for House (66 replies) |
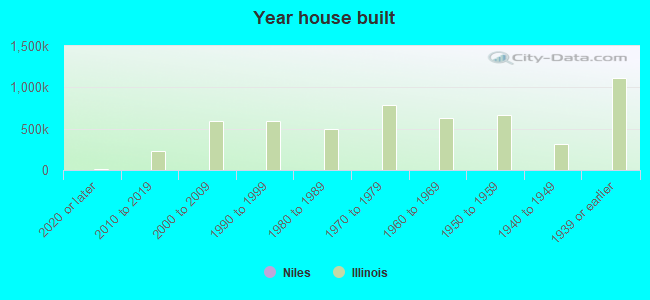
Median year apartment built: 1970
Household type by relationship:
Households: 29,956- Male householders: 5,689 (1,085 living alone), Female householders: 5,390 (2,028 living alone)
5,870 spouses (5,824 opposite-sex spouses), 335 unmarried partners, (312 opposite-sex unmarried partners), 8,148 children (8,031 natural, 58 adopted, 58 stepchildren), 328 grandchildren, 416 brothers or sisters, 1,067 parents, 0 foster children, 1,023 other relatives, 449 non-relatives
- In group quarters: 1,234
Size of family households: 2,702 2-persons, 2,037 3-persons, 1,648 4-persons, 814 5-persons, 178 6-persons, 254 7-or-more-persons.
Size of nonfamily households: 3,345 1-person, 522 2-persons, 10 3-persons.
4,125 married couples with children.
442 single-parent households (155 men, 287 women).
41.6% of residents of Niles speak English at home.
9.4% of residents speak Spanish at home (46% speak English very well, 22% speak English well, 13% speak English not well, 18% don't speak English at all).
29.7% of residents speak other Indo-European language at home (51% speak English very well, 31% speak English well, 13% speak English not well, 6% don't speak English at all).
15.0% of residents speak Asian or Pacific Island language at home (67% speak English very well, 18% speak English well, 12% speak English not well, 2% don't speak English at all).
5.9% of residents speak other language at home (58% speak English very well, 31% speak English well, 10% speak English not well, 2% don't speak English at all).
Foreign born population: 12,958 (43.3%)
(72.6% of them are naturalized citizens)
| Here: | 5.7 |
| State: | 6.4 |
| Here: | 3.6 |
| State: | 4.1 |
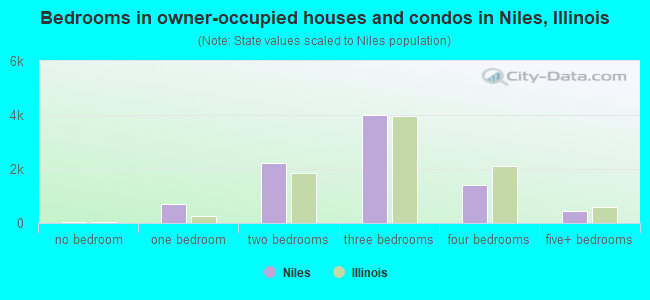
- Bedrooms in owner-occupied houses and condos in Niles, Illinois
- 49no bedroom
- 7041 bedroom
- 2,2102 bedrooms
- 4,0173 bedrooms
- 1,4104 bedrooms
- 4625+ bedrooms
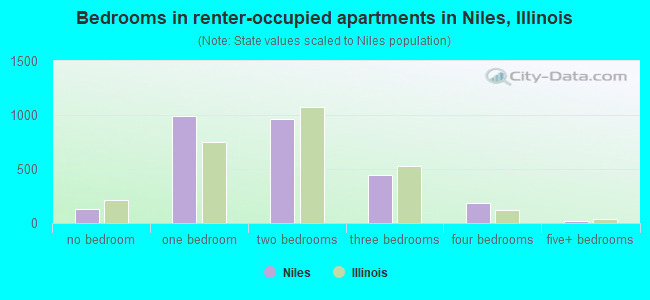
- Bedrooms in renter-occupied apartments in Niles, Illinois
- 127no bedroom
- 9951 bedroom
- 9592 bedrooms
- 4423 bedrooms
- 1834 bedrooms
- 175+ bedrooms
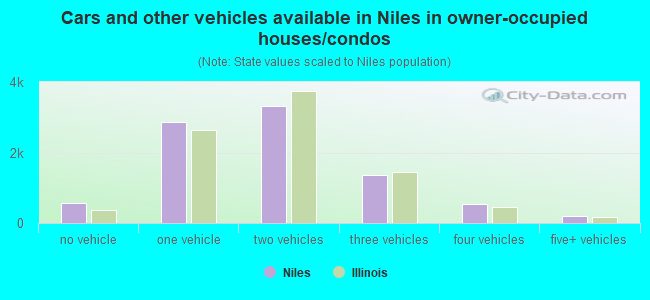
- Cars and other vehicles available in Niles in owner-occupied houses/condos
- 576no vehicle
- 2,8601 vehicle
- 3,3162 vehicles
- 1,3623 vehicles
- 5354 vehicles
- 2035+ vehicles
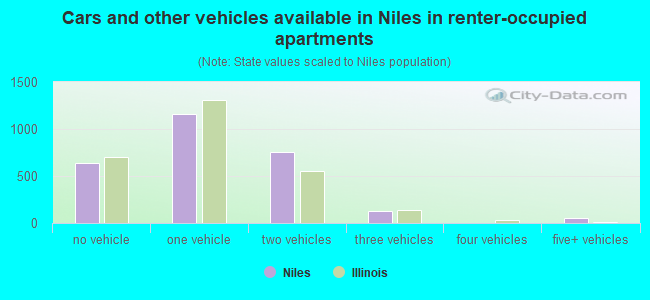
- Cars and other vehicles available in Niles in renter-occupied apartments
- 636no vehicle
- 1,1561 vehicle
- 7602 vehicles
- 1233 vehicles
- 04 vehicles
- 485+ vehicles
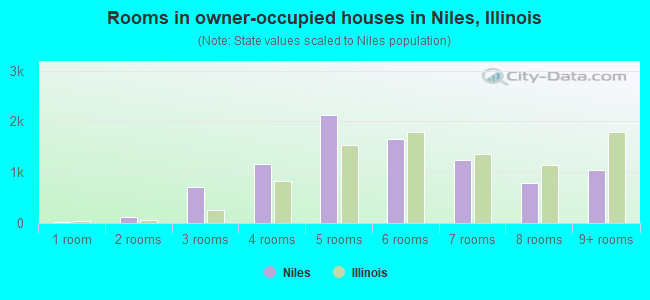
- Rooms in owner-occupied houses in Niles, Illinois
- 121 room
- 1102 rooms
- 7073 rooms
- 1,1674 rooms
- 2,1285 rooms
- 1,6536 rooms
- 1,2377 rooms
- 7918 rooms
- 1,0479+ rooms
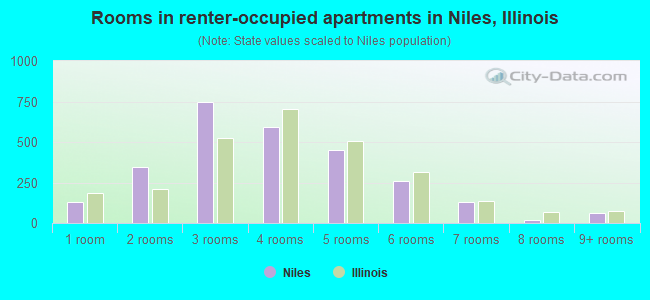
- Rooms in renter-occupied apartments in Niles, Illinois
- 1271 room
- 3432 rooms
- 7453 rooms
- 5914 rooms
- 4505 rooms
- 2576 rooms
- 1307 rooms
- 188 rooms
- 619+ rooms
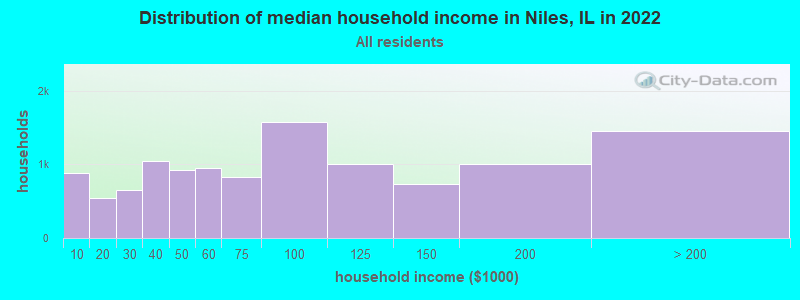
Niles, IL household income distribution

- 879Less than $10,000
- 539$10,000 to $19,999
- 656$20,000 to $29,999
- 1,051$30,000 to $39,999
- 931$40,000 to $49,999
- 948$50,000 to $59,999
- 829$60,000 to $74,999
- 1,578$75,000 to $99,999
- 1,004$100,000 to $124,999
- 737$125,000 to $149,999
- 1,012$150,000 to $199,999
- 1,459$200,000 or more
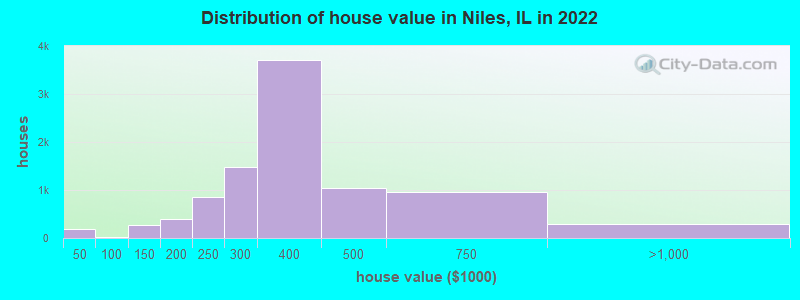
Home value of owner - occupied houses in 2022 in Niles, IL
-
- 125Less than $10,000
- 9$20,000 to $24,999
- 7$25,000 to $29,999
- 34$35,000 to $39,999
- 4$50,000 to $59,999
- 22$70,000 to $79,999
- 161$100,000 to $124,999
- 112$125,000 to $149,999
- 219$150,000 to $174,999
- 178$175,000 to $199,999
- 850$200,000 to $249,999
- 1,478$250,000 to $299,999
- 3,698$300,000 to $399,999
- 1,034$400,000 to $499,999
- 966$500,000 to $749,999
- 229$750,000 to $999,999
- 16$1,000,000 to $1,499,999
- 18$1,500,000 to $1,999,999
- 28$2,000,000 or more
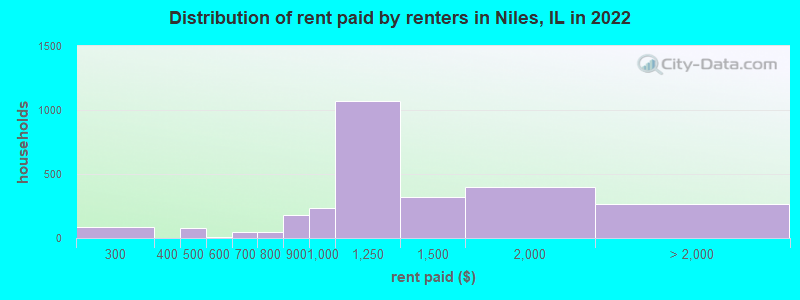
Rent paid by renters in 2022 in Niles, IL
-
- 84$200 to $249
- 20$400 to $449
- 59$450 to $499
- 11$500 to $549
- 20$600 to $649
- 24$650 to $699
- 28$700 to $749
- 21$750 to $799
- 177$800 to $899
- 231$900 to $999
- 1,070$1,000 to $1,249
- 320$1,250 to $1,499
- 399$1,500 to $1,999
- 97$2,000 to $2,499
- 22$2,500 to $2,999
- 15$3,500 or more
- 131No cash rent
Percentage of workers working in this county: 91.4%
Number of people working at home: 1,503 (10.8% of all workers)
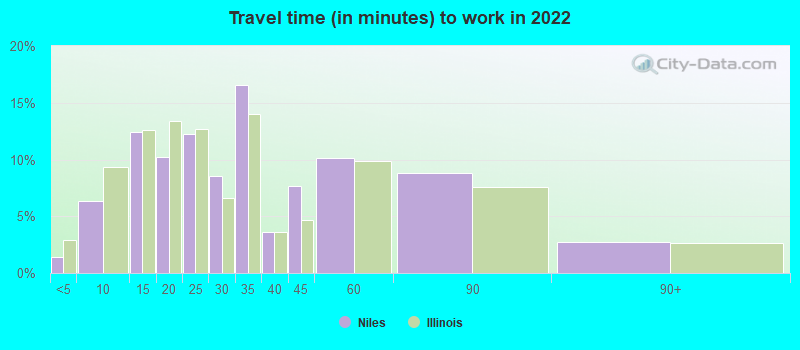
Travel time to work (commute)
- Less than 5 minutes: 297
- 5 to 9 minutes: 734
- 10 to 14 minutes: 1,378
- 15 to 19 minutes: 2,003
- 20 to 24 minutes: 1,663
- 25 to 29 minutes: 1,020
- 30 to 34 minutes: 2,192
- 35 to 39 minutes: 509
- 40 to 44 minutes: 412
- 45 to 59 minutes: 793
- 60 to 89 minutes: 775
- 90 or more minutes: 358
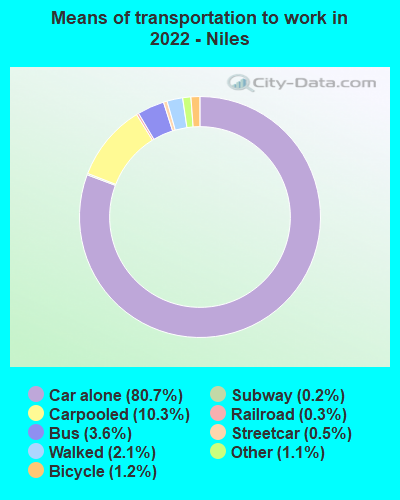
Means of transportation to work:
- Drove a car alone: 15,231 (73.9%)
- Carpooled: 2,073 (10.1%)
- Bus: 630 (3.1%)
- Subway or elevated rail: 75 (0.4%)
- Long-distance train or commuter rail: 22 (0.1%)
- Light rail, streetcar or trolley: 50 (0.2%)
- Taxi: 217 (1.1%)
- Bicycle: 240 (1.2%)
- Walked: 407 (2.0%)
- Worked at home: 1,503 (7.3%)
- Unemployment by race in 2022
- Unemployment rate for White non-Hispanic residents
- 5.0%Males
- 2.1%Females
- Unemployment rate for Black residents
- 3.5%Males
- Unemployment rate for Asian residents
- 12.1%Males
- 4.0%Females
- Unemployment rate for other race residents
- 14.4%Males
- Unemployment rate for two or more race residents
- 5.5%Males
- 0.9%Females
- Unemployment rate for Hispanic or Latino residents
- 7.1%Males
- 0.5%Females
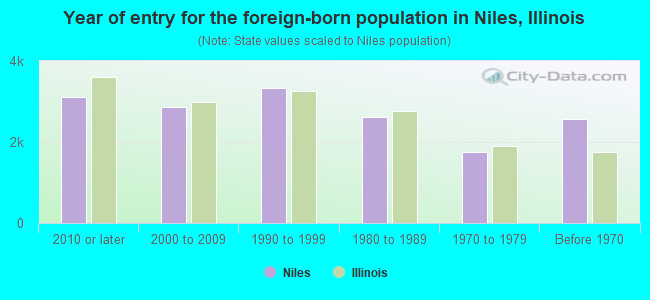
- Year of entry for the foreign-born population in Niles, Illinois
- 3,1202010 or later
- 2,8762000 to 2009
- 3,3251990 to 1999
- 2,6141980 to 1989
- 1,7571970 to 1979
- 2,569Before 1970
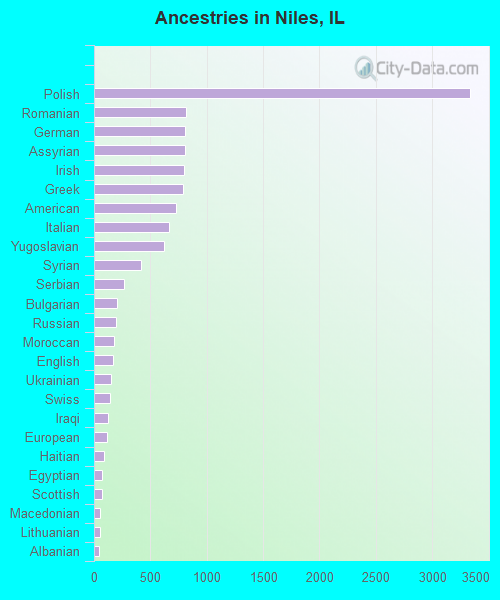
First ancestries reported:
- Polish: 3,337 (17.3%)
- Romanian: 820 (4.2%)
- German: 806 (4.2%)
- Assyrian: 804 (4.2%)
- Irish: 795 (4.1%)
- Greek: 788 (4.1%)
- American: 729 (3.8%)
- Italian: 668 (3.5%)
- Yugoslavian: 624 (3.2%)
- Syrian: 420 (2.2%)
- Serbian: 262 (1.4%)
- Bulgarian: 201 (1.0%)
- Russian: 193 (1.0%)
- Moroccan: 181 (0.9%)
- English: 165 (0.9%)
- Ukrainian: 152 (0.8%)
- Swiss: 142 (0.7%)
- Iraqi: 127 (0.7%)
- European: 112 (0.6%)
- Haitian: 88 (0.5%)
- Egyptian: 72 (0.4%)
- Scottish: 72 (0.4%)
- Macedonian: 57 (0.3%)
- Lithuanian: 53 (0.3%)
- Albanian: 45 (0.2%)
- Eastern European: 44 (0.2%)
- French: 34 (0.2%)
- Norwegian: 33 (0.2%)
- Scotch-Irish: 30 (0.2%)
- Swedish: 29 (0.2%)
- Slovak: 25 (0.1%)
- Arab: 16 (0.08%)
- Afghan: 16 (0.08%)
- Belgian: 14 (0.07%)
- Austrian: 9 (0.05%)
- Croatian: 9 (0.05%)
- Czech: 7 (0.04%)
- Armenian: 6 (0.03%)
- British: 5 (0.03%)
- Dutch: 5 (0.03%)
- Danish: 5 (0.03%)
- Hungarian: 3 (0.02%)
Most common places of birth for foreign-born residents (%):
| Niles: | 15.8% (2,052) |
| Illinois: | 6.9% (124,474) |
| Niles: | 13.8% (1,789) |
| Illinois: | 5.2% (93,003) |
| Niles: | 10.9% (1,413) |
| Illinois: | 9.2% (166,409) |
| Niles: | 8.0% (1,042) |
| Illinois: | 34.7% (626,958) |
| Niles: | 6.0% (772) |
| Illinois: | 0.7% (13,214) |
| Niles: | 4.7% (612) |
| Illinois: | 2.2% (40,393) |
| Niles: | 4.2% (540) |
| Illinois: | 0.8% (14,736) |
| Niles: | 3.8% (492) |
| Illinois: | 0.4% (6,781) |
| Niles: | 3.5% (460) |
| Illinois: | 0.6% (10,776) |
| Niles: | 3.2% (417) |
| Illinois: | 1.6% (29,519) |
| Niles: | 2.8% (368) |
| Illinois: | 0.6% (10,720) |
| Niles: | 1.9% (249) |
| Illinois: | 0.5% (8,574) |
| Niles: | 1.7% (214) |
| Illinois: | 0.9% (15,679) |
| Niles: | 1.6% (213) |
| Illinois: | 1.2% (22,269) |
Place of birth for U.S.-born residents:
- This state: 14,978
- Other state: 1,544
- Northeast: 283
- Midwest: 466
- South: 420
- West: 363
92.2% of Niles residents lived in the same house 1 years ago.
Out of people who lived in different houses, 46.5% lived in this county.
Out of people who lived in different counties, 43.7% lived in Illinois.
| Niles: | 92.2% |
| State average: | 88.3% |
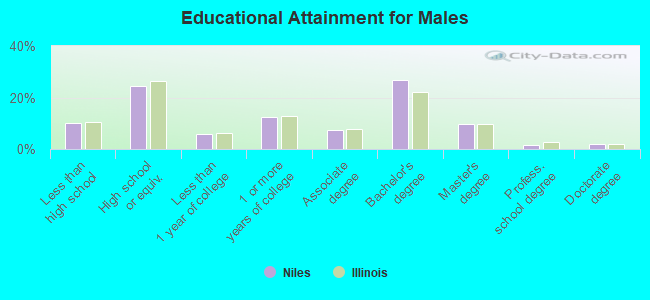
Education attainment for males 25 years and older:
- No schooling: 243
- Nursery to 4th grade: 127
- 5th and 6th grade: 48
- 7th and 8th grade: 43
- 9th grade: 203
- 10th grade: 47
- 11th grade: 64
- 12th grade, no diploma: 319
- High school graduate (or equivalency): 2,678
- Less than 1 year of college: 649
- Some college more than 1 year, no degree: 1,374
- Associate degree: 823
- Bachelor's degree: 2,942
- Master's degree: 1,063
- Professional school degree: 178
- Doctorate degree: 217
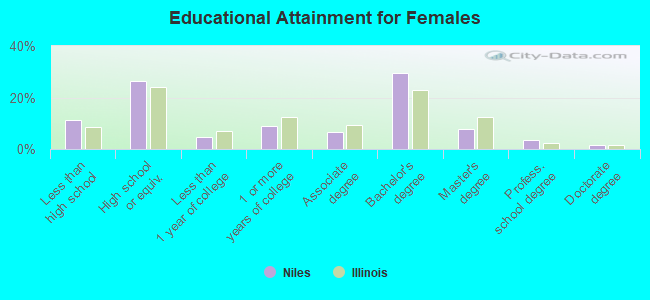
Education attainment for females 25 years and older:
- No schooling: 267
- Nursery to 4th grade: 53
- 5th and 6th grade: 98
- 7th and 8th grade: 254
- 9th grade: 192
- 10th grade: 127
- 11th grade: 84
- 12th grade, no diploma: 279
- High school graduate (or equivalency): 3,173
- Less than 1 year of college: 571
- Some college more than 1 year, no degree: 1,059
- Associate degree: 777
- Bachelor's degree: 3,548
- Master's degree: 928
- Professional school degree: 417
- Doctorate degree: 194

Housing units in structures:
- One, detached: 6,294
- One, attached: 1,016
- Two: 188
- 3 or 4: 685
- 5 to 9: 951
- 10 to 19: 111
- 20 to 49: 1,026
- 50 or more: 1,665
- Mobile homes: 30
Housing units lacking complete kitchen facilities in 2022: 1.8%
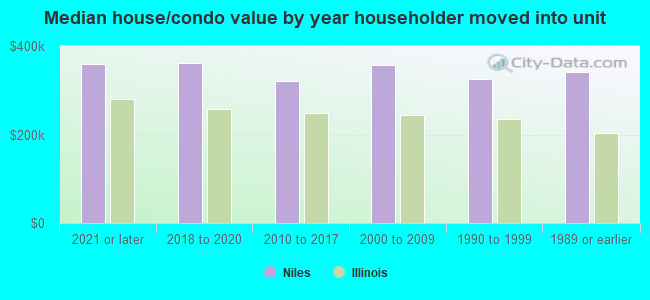
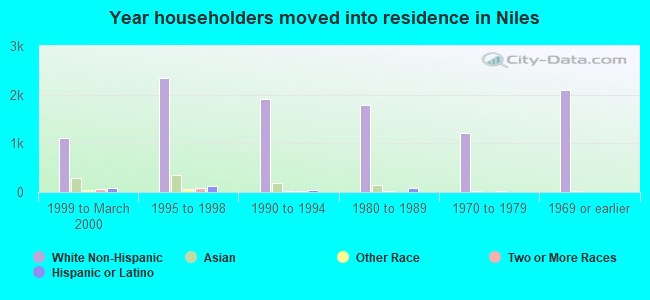
House/condo owner moved in on average 13 years ago
Renter moved in on average 6 years ago
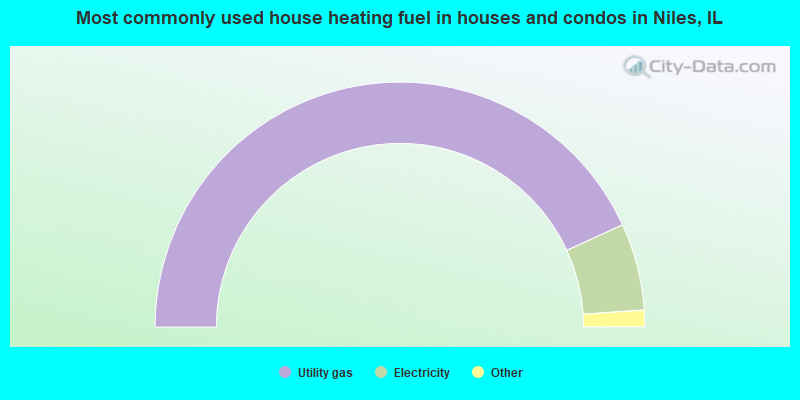
- 86.3%Utility gas
- 11.5%Electricity
- 1.4%Bottled, tank, or LP gas
- 0.6%No fuel used
- 0.1%Solar energy
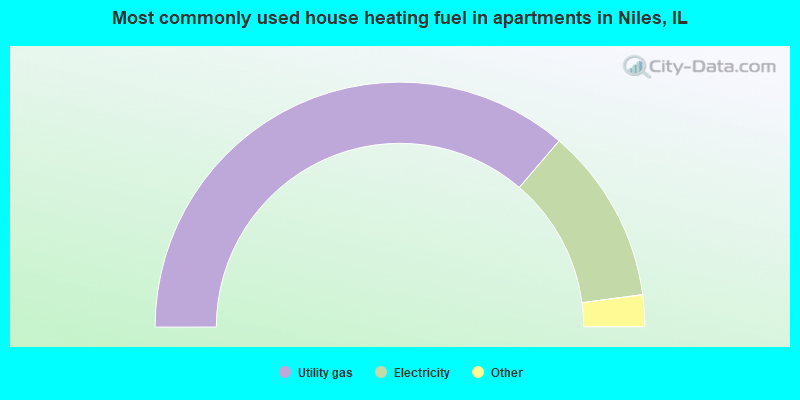
- 72.6%Utility gas
- 23.3%Electricity
- 3.6%Bottled, tank, or LP gas
- 0.6%No fuel used
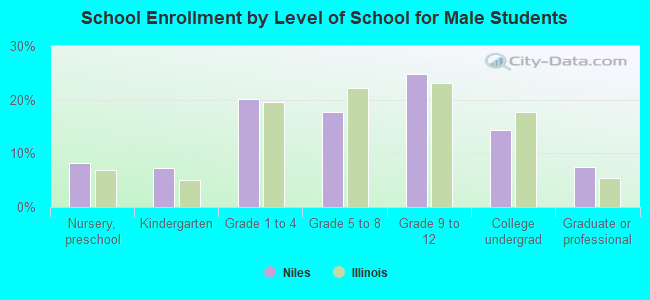
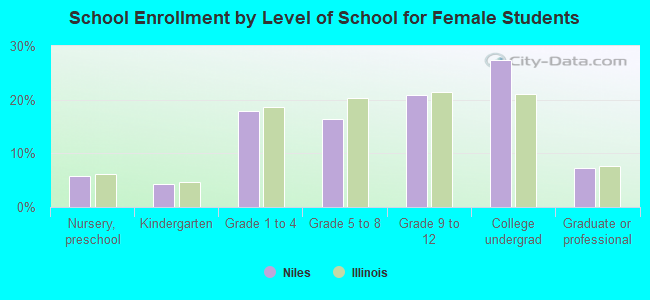
Private vs. public school enrollment:
| Here: | 10.5% |
| Illinois: | 13.3% |
| Here: | 7.3% |
| Illinois: | 9.9% |
| Here: | 42.5% |
| Illinois: | 27.4% |