Nilwood, IL (Illinois) Houses and Residents
| Nilwood: | $41,881 |
| Illinois: | $251,600 |
Mean price in 2022:
Detached houses: $61,117
Here: $61,117 State: $310,164 Mobile homes: $46,055
Here: $46,055 State: $78,855
Total population: 233 (Urban population: 0, Rural population: 283 (all nonfarm))
Houses: 106 (63 occupied: 58 owner occupied, 6 renter occupied)
| % of renters here: | 9% |
| State: | 33% |
Housing density: 228 houses/condos per square mile
Median price asked for vacant for-sale houses and condos in 2022 in this county: $62,969.
Median gross rent in Nilwood, IL in 2022: $-661,577,607
Housing units in Nilwood with a mortgage: 19 (2 second mortgage, 0 home equity loan, 2 both second mortgage and home equity loan)
Houses without a mortgage: 0
Median household income for houses/condos with a mortgage: $81,040
Median household income for apartments without a mortgage: $43,467
Median monthly housing costs: $488
Compare current foreclosures near Nilwood, IL:
| Photo | Address | Area | Beds / Baths | Price | Details |
|---|---|---|---|---|---|

|
#1
S Dye St
Virden, IL 62690
|
1,000 sq. feet
|
1 baths 2 beds |
show details | |

|
#2
N Mckinley St
Girard, IL 62640
|
800 sq. feet
|
1 baths 3 beds |
show details | |

|
#3
N Plum St
Carlinville, IL 62626
|
- sq. feet
|
1 baths 3 beds |
show details | |

|
#4
Leonard St
Farmersville, IL 62533
|
- sq. feet
|
3 baths 3 beds |
show details | |

|
#5
N Oak St
Carlinville, IL 62626
|
- sq. feet
|
- baths - beds |
$15,900
|
show details |

|
#6
E Stoddard Ave
Virden, IL 62690
|
1,200 sq. feet
|
1 baths 2 beds |
show details | |

|
#7
Madison St
Auburn, IL 62615
|
- sq. feet
|
- baths - beds |
show details | |

|
#8
E Waverly St
Virden, IL 62690
|
- sq. feet
|
- baths - beds |
show details | |

|
#9
Madison St
Auburn, IL 62615
|
- sq. feet
|
- baths - beds |
show details | |

|
#10
S Church St
Virden, IL 62690
|
- sq. feet
|
- baths - beds |
show details |
| Photo | Address | Area | Beds / Baths | Price | Details |
|---|---|---|---|---|---|

|
#11
Madison St
Auburn, IL 62615
|
- sq. feet
|
- baths - beds |
show details | |

|
#12
Route 111 # 111
Chesterfield, IL 62630
|
- sq. feet
|
- baths - beds |
show details | |

|
#13
N Wilson St
Girard, IL 62640
|
- sq. feet
|
- baths - beds |
show details | |

|
#14
Ash St
Carlinville, IL 62626
|
- sq. feet
|
- baths - beds |
show details | |

|
#15
Barnett Trl
Litchfield, IL 62056
|
- sq. feet
|
- baths - beds |
show details | |

|
#16
Kennedy Rd Trlr
Auburn, IL 62615
|
- sq. feet
|
- baths - beds |
show details | |

|
#17
Ostermeier Rd
Auburn, IL 62615
|
- sq. feet
|
- baths - beds |
show details | |

|
#18
Trojan Rd
Auburn, IL 62615
|
- sq. feet
|
- baths - beds |
show details | |

|
#19
N Curtiss St
Waverly, IL 62692
|
- sq. feet
|
- baths - beds |
show details | |

|
#20
E Vandalia St
Waverly, IL 62692
|
- sq. feet
|
- baths - beds |
show details |
| Photo | Address | Area | Beds / Baths | Price | Details |
|---|---|---|---|---|---|

|
#21
N Monroe St
Litchfield, IL 62056
|
- sq. feet
|
- baths - beds |
show details | |

|
#22
N Madison St
Litchfield, IL 62056
|
- sq. feet
|
- baths - beds |
show details | |

|
#23
W Hauser St
Litchfield, IL 62056
|
- sq. feet
|
- baths - beds |
show details | |

|
#24
High School St
Divernon, IL 62530
|
- sq. feet
|
- baths - beds |
show details | |

|
#25
W Madison St
Girard, IL 62640
|
- sq. feet
|
- baths - beds |
show details | |

|
#26
S Harris St
Auburn, IL 62615
|
- sq. feet
|
- baths - beds |
show details | |

|
#27
Madison St
Auburn, IL 62615
|
- sq. feet
|
- baths - beds |
show details | |

|
#28
N North St
Raymond, IL 62560
|
- sq. feet
|
- baths - beds |
show details | |

|
#29
Reichert Rd
Divernon, IL 62530
|
- sq. feet
|
- baths - beds |
show details | |

|
#30
Illini Trl
Virden, IL 62690
|
- sq. feet
|
- baths - beds |
show details |
| Photo | Address | Area | Beds / Baths | Price | Details |
|---|---|---|---|---|---|

|
#31
Keller St
Virden, IL 62690
|
- sq. feet
|
- baths - beds |
show details | |

|
#32
E Prairie St
Virden, IL 62690
|
- sq. feet
|
- baths - beds |
show details | |

|
#33
S Church St
Virden, IL 62690
|
- sq. feet
|
- baths - beds |
show details | |

|
#34
Johnson Ln
Raymond, IL 62560
|
- sq. feet
|
- baths - beds |
show details | |

|
Check over 1 million property listings on Foreclosure.com!
|
browse all offers | |||

Latest news about housing in Nilwood, IL collected exclusively by city-data.com from local newspapers, TV, and radio stations


Median year apartment built: 1984
Household type by relationship:
Households: 147- Male householders: 23 (6 living alone), Female householders: 38 (8 living alone)
26 spouses (26 opposite-sex spouses), 2 unmarried partners, (2 opposite-sex unmarried partners), 40 children (40 natural, 0 adopted, 0 stepchildren), 1 grandchildren, 2 brothers or sisters, 10 parents, 0 foster children, 0 other relatives, 0 non-relatives
Size of family households: 28 2-persons, 11 3-persons, 5 4-persons, 1 5-persons.
Size of nonfamily households: 16 1-person, 1 2-persons.
5 married couples with children.
3 single-parent households (0 men, 3 women).
All residents speak only English at home
| Here: | 5.6 |
| State: | 6.4 |
| Here: | 4.4 |
| State: | 4.1 |

- Bedrooms in owner-occupied houses and condos in Nilwood, Illinois
- 0no bedroom
- 11 bedroom
- 322 bedrooms
- 143 bedrooms
- 114 bedrooms
- 05+ bedrooms

- Bedrooms in renter-occupied apartments in Nilwood, Illinois
- 0no bedroom
- 11 bedroom
- 52 bedrooms
- 03 bedrooms
- 04 bedrooms
- 05+ bedrooms

- Cars and other vehicles available in Nilwood in owner-occupied houses/condos
- 1no vehicle
- 111 vehicle
- 352 vehicles
- 63 vehicles
- 54 vehicles
- 05+ vehicles

- Cars and other vehicles available in Nilwood in renter-occupied apartments
- 1no vehicle
- 31 vehicle
- 22 vehicles
- 03 vehicles
- 04 vehicles
- 05+ vehicles

- Rooms in owner-occupied houses in Nilwood, Illinois
- 01 room
- 02 rooms
- 03 rooms
- 44 rooms
- 225 rooms
- 226 rooms
- 57 rooms
- 28 rooms
- 29+ rooms

- Rooms in renter-occupied apartments in Nilwood, Illinois
- 01 room
- 02 rooms
- 03 rooms
- 34 rooms
- 35 rooms
- 06 rooms
- 07 rooms
- 08 rooms
- 09+ rooms


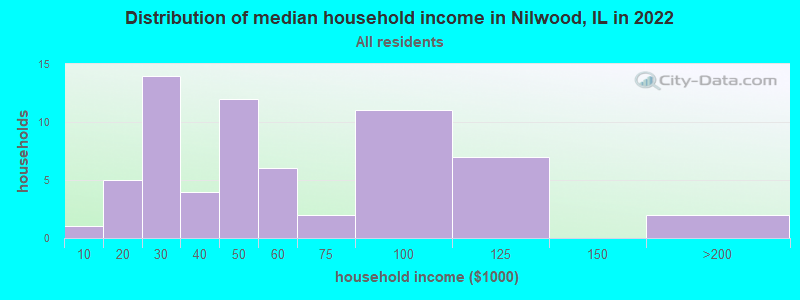
Nilwood, IL household income distribution

- 1Less than $10,000
- 5$10,000 to $19,999
- 14$20,000 to $29,999
- 4$30,000 to $39,999
- 12$40,000 to $49,999
- 6$50,000 to $59,999
- 2$60,000 to $74,999
- 11$75,000 to $99,999
- 7$100,000 to $124,999
- 2$150,000 to $199,999
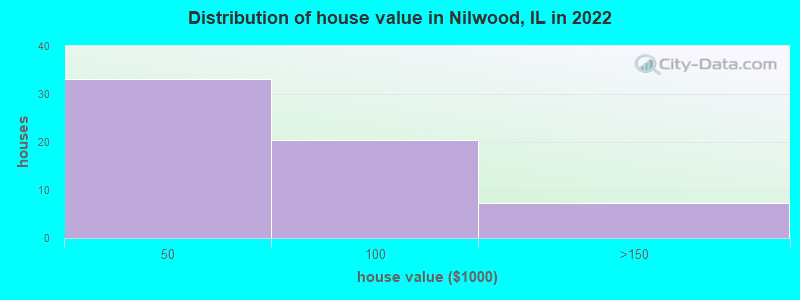
Home value of owner - occupied houses in 2022 in Nilwood, IL
-
- 9$15,000 to $19,999
- 0$25,000 to $29,999
- 5$30,000 to $34,999
- 12$35,000 to $39,999
- 4$40,000 to $49,999
- 1$50,000 to $59,999
- 3$60,000 to $69,999
- 9$70,000 to $79,999
- 1$80,000 to $89,999
- 1$100,000 to $124,999
- 5$125,000 to $149,999
Rent paid by renters in 2022 in Nilwood, IL
-
- 2$150 to $199
- 3$400 to $449
- 1No cash rent


Percentage of workers working in this county: 63.5%
Number of people working at home: 5 (9.6% of all workers)
Travel time to work (commute)
- Less than 5 minutes: 0
- 5 to 9 minutes: 3
- 10 to 14 minutes: 14
- 15 to 19 minutes: 7
- 20 to 24 minutes: 1
- 25 to 29 minutes: 2
- 30 to 34 minutes: 8
- 35 to 39 minutes: 0
- 40 to 44 minutes: 1
- 45 to 59 minutes: 4
- 60 to 89 minutes: 0
- 90 or more minutes: 0
Means of transportation to work:
- Drove a car alone: 80 (70.2%)
- Carpooled: 30 (26.3%)
- Worked at home: 4 (3.5%)


First ancestries reported:
- German: 36 (43.7%)
- American: 18 (21.8%)
- European: 13 (15.8%)
- English: 7 (8.5%)
- Irish: 4 (4.9%)
- Italian: 2 (2.4%)
Place of birth for U.S.-born residents:
- This state: 132
- Other state: 14
- Northeast: 0
- Midwest: 1
- South: 8
- West: 5
91.1% of Nilwood residents lived in the same house 1 years ago.
Out of people who lived in different houses, 40.0% lived in this county.
Out of people who lived in different counties, 50.0% lived in Illinois.
| Nilwood: | 91.1% |
| State average: | 88.3% |
Education attainment for males 25 years and older:
- No schooling: 0
- Nursery to 4th grade: 0
- 5th and 6th grade: 0
- 7th and 8th grade: 4
- 9th grade: 1
- 10th grade: 0
- 11th grade: 0
- 12th grade, no diploma: 0
- High school graduate (or equivalency): 31
- Less than 1 year of college: 1
- Some college more than 1 year, no degree: 1
- Associate degree: 0
- Bachelor's degree: 5
- Master's degree: 0
- Professional school degree: 0
- Doctorate degree: 0

Education attainment for females 25 years and older:
- No schooling: 0
- Nursery to 4th grade: 0
- 5th and 6th grade: 0
- 7th and 8th grade: 0
- 9th grade: 0
- 10th grade: 7
- 11th grade: 3
- 12th grade, no diploma: 3
- High school graduate (or equivalency): 24
- Less than 1 year of college: 14
- Some college more than 1 year, no degree: 0
- Associate degree: 16
- Bachelor's degree: 3
- Master's degree: 0
- Professional school degree: 0
- Doctorate degree: 0


Housing units in structures:
- One, detached: 88
- Mobile homes: 18
Median worth of mobile homes: $46,206
Housing units lacking complete kitchen facilities in 2022: 30.2%
House/condo owner moved in on average 19 years ago
Renter moved in on average 15 years ago

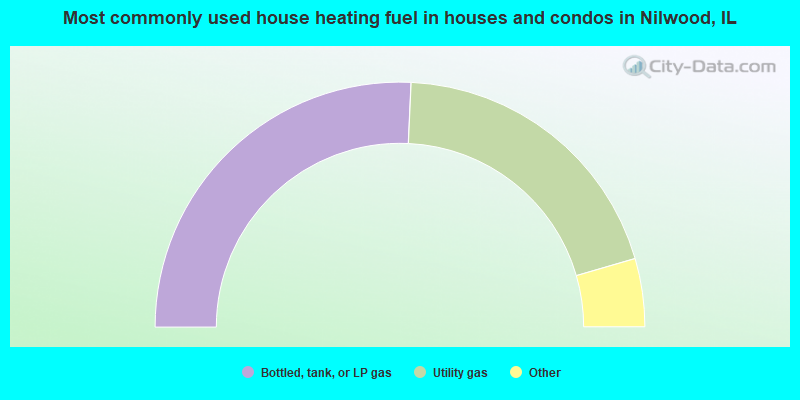
- 52.6%Bottled, tank, or LP gas
- 40.4%Utility gas
- 3.5%Electricity
- 1.8%Fuel oil, kerosene, etc.
- 1.8%Other fuel
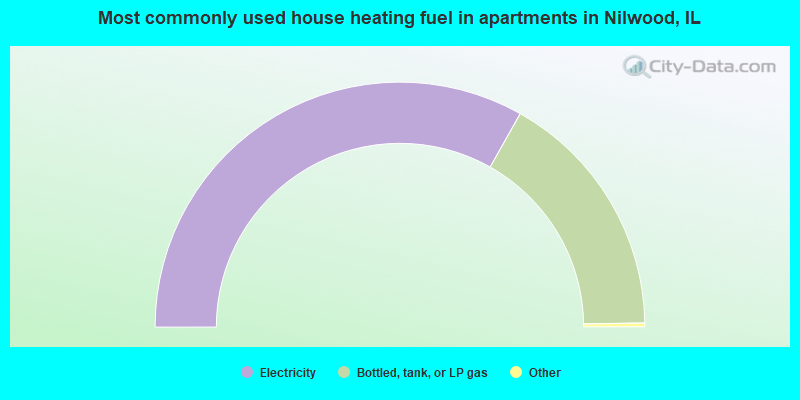
- 66.7%Electricity
- 33.3%Bottled, tank, or LP gas
Private vs. public school enrollment:
| Here: | 0.0% |
| Illinois: | 13.3% |
| Here: | 100.0% |
| Illinois: | 27.4% |


