Niskayuna, NY (New York) Houses and Residents
Estimated median house or condo value in 2022: $266,963 (it was $110,200 in 2000 )
Niskayuna:
$266,963New York:
$400,400
Lower value quartile - upper value quartile: $201,848 - $297,854Total population: 4,859 (Urban population: 4,830, Rural population: 0)
Houses: 1,948 (1,919 occupied: 1,711 owner occupied, 208 renter occupied )
% of renters here:
11%State:
46%
Housing density: 1,918 houses/condos per square mile
Median price asked for vacant for-sale houses and condos in 2022 in this county: $378,269.
Median contract rent in 2022: $1,132 (lower quartile is $1,042, upper quartile is $1,420)
Median gross rent in Niskayuna, NY in 2022: $1,382
Housing units in Niskayuna with a mortgage: 1,124 (93 second mortgage, 164 home equity loan, 0 both second mortgage and home equity loan )Houses without a mortgage: 563
Data:
Median house or condo value ($)
Median house or condo value ($ change since 2000)
Median house or condo value ($) - White
Median house or condo value ($) - Black or African American
Median house or condo value ($) - Asian
Median house or condo value ($) - Hispanic or Latino
Median house or condo value ($) - American Indian and Alaska Native
Median house or condo value ($) - Multirace
Median house or condo value ($) - Other Race
Median price asked for mobile homes ($)
Household density (households per square mile)
Mean house or condo value by units in structure - 1, detached ($)
Mean house or condo value by units in structure - 1, attached ($)
Mean house or condo value by units in structure - 2 ($)
Mean house or condo value by units in structure by units in structure - 3 or 4 ($)
Mean house or condo value by units in structure - 5 or more ($)
Mean house or condo value by units in structure - Boat, RV, van, etc. ($)
Mean house or condo value by units in structure - Mobile home ($)
Median contract rent ($)
Median contract rent - Lower quartile ($)
Median contract rent - Upper quartile ($)
Median gross rent ($)
Urban houses (%)
Rural houses (%)
Houses occupied (%)
Houses occupied (% change since 2000)
Houses owner occupied (%)
Houses owner occupied (% change since 2000)
Houses renter occupied (%)
Houses renter occupied (% change since 2000)
Vacant housing units - For rent (%)
Vacant housing units - For rent (% change since 2000)
Vacant housing units - For sale only (%)
Vacant housing units - For sale only (% change since 2000)
Vacant housing units - Rented or sold, not occupied (%)
Vacant housing units - Rented or sold, not occupied (% change since 2000)
Vacant housing units - For seasonal, recreational, or occasional use (%)
Vacant housing units - For seasonal, recreational, or occasional use (% change since 2000)
Vacant housing units - For migrant workers (%)
Vacant housing units - For migrant workers (% change since 2000)
Vacant housing units - Other vacant (%)
Vacant housing units - Other vacant (% change since 2000)
Median monthly housing costs ($)
Median household income for houses/condos with a mortgage ($)
Median household income for houses/condos without a mortgage ($)
Median household income ($)
Median household income ($) - White
Median household income ($) - Black or African American
Median household income ($) - Asian
Median household income ($) - Hispanic or Latino
Median household income ($) - American Indian and Alaska Native
Median household income ($) - Multirace
Median household income ($) - Other Race
Mortgage status - with mortgage (%)
Mortgage status - with second mortgage (%)
Mortgage status - with home equity loan (%)
Mortgage status - with both second mortgage and home equity loan (%)
Mortgage status - without a mortgage (%)
Median year house/condo built
Median year apartment built
Household type by relationship - Male householder living alone (%)
Household type by relationship - Male householder not living alone (%)
Household type by relationship - Female householder living alone (%)
Household type by relationship - Female householder not living alone (%)
Household type by relationship - Opposite-Sex spouse (%)
Household type by relationship - Same-Sex spouse (%)
Household type by relationship - Opposite-Sex unmarried partner (%)
Household type by relationship - Same-Sex unmarried partner (%)
Household type by relationship - In group quarters (%)
Size of family households - 2-person household (%)
Size of family households - 3-person household (%)
Size of family households - 4-person household (%)
Size of family households - 5-person household (%)
Size of family households - 6-person household (%)
Size of family households - 7-or-more-person household (%)
Size of nonfamily households - 1-person household (%)
Size of nonfamily households - 2-person household (%)
Size of nonfamily households - 3-person household (%)
Size of nonfamily households - 4-person household (%)
Size of nonfamily households - 5-person household (%)
Size of nonfamily households - 6-person household (%)
Size of nonfamily households - 7-or-moreperson household (%)
Year house built - Built 2010 or later (%)
Year house built - Built 2000 to 2009 (%)
Year house built - Built 1990 to 1999 (%)
Year house built - Built 1980 to 1989 (%)
Year house built - Built 1970 to 1979 (%)
Year house built - Built 1960 to 1969 (%)
Year house built - Built 1950 to 1959 (%)
Year house built - Built 1940 to 1949 (%)
Year house built - Built 1939 or earlier (%)
Median number of rooms in houses and condos
Median number of rooms in apartments
Median number of bedrooms in owner occupied houses
Mean number of bedrooms in owner occupied houses
Median number of bedrooms in renter occupied houses
Mean number of bedrooms in renter occupied houses
Median number of vehichles in owner occupied houses
Mean number of vehichles in owner occupied houses
Median number of vehichles in renter occupied houses
Mean number of vehichles in renter occupied houses
Rooms in owner-occupied houses - 1 room (%)
Rooms in owner-occupied houses - 2 rooms (%)
Rooms in owner-occupied houses - 3 rooms (%)
Rooms in owner-occupied houses - 4 rooms (%)
Rooms in owner-occupied houses - 5 rooms (%)
Rooms in owner-occupied houses - 6 rooms (%)
Rooms in owner-occupied houses - 7 rooms (%)
Rooms in owner-occupied houses - 8 rooms (%)
Rooms in owner-occupied houses - 9+ rooms (%)
Rooms in renter-occupied houses - 1 room (%)
Rooms in renter-occupied houses - 2 rooms (%)
Rooms in renter-occupied houses - 3 rooms (%)
Rooms in renter-occupied houses - 4 rooms (%)
Rooms in renter-occupied houses - 5 rooms (%)
Rooms in renter-occupied houses - 6 rooms (%)
Rooms in renter-occupied houses - 7 rooms (%)
Rooms in renter-occupied houses - 8 rooms (%)
Rooms in renter-occupied houses - 9+ rooms (%)
Bedrooms in owner-occupied houses - no bedrooms (%)
Bedrooms in owner-occupied houses - 1 bedroom (%)
Bedrooms in owner-occupied houses - 2 bedrooms (%)
Bedrooms in owner-occupied houses - 3 bedrooms (%)
Bedrooms in owner-occupied houses - 4 bedrooms (%)
Bedrooms in owner-occupied houses - 5+ bedrooms (%)
Bedrooms in renter-occupied houses - no bedrooms (%)
Bedrooms in renter-occupied houses - 1 bedroom (%)
Bedrooms in renter-occupied houses - 2 bedrooms (%)
Bedrooms in renter-occupied houses - 3 bedrooms (%)
Bedrooms in renter-occupied houses - 4 bedrooms (%)
Bedrooms in renter-occupied houses - 5+ bedrooms (%)
Vehicles available in owner-occupied houses - no vehicle available (%)
Vehicles available in owner-occupied houses - 1 vehicle available(%)
Vehicles available in owner-occupied houses - 2 Vehicles available (%)
Vehicles available in owner-occupied houses - 3 Vehicles available (%)
Vehicles available in owner-occupied houses - 4 Vehicles available (%)
Vehicles available in owner-occupied houses - 5+ Vehicles available (%)
Vehicles available in renter-occupied houses - no vehicle available (%)
Vehicles available in renter-occupied houses - 1 vehicle available (%)
Vehicles available in renter-occupied houses - 2 Vehicles available (%)
Vehicles available in renter-occupied houses - 3 Vehicles available (%)
Vehicles available in renter-occupied houses - 4 Vehicles available (%)
Vehicles available in renter-occupied houses - 5+ Vehicles available (%)
Housing units in structures - 1, detached (%)
Housing units in structures - 1, attached (%)
Housing units in structures - 2 (%)
Housing units in structures - 3 or 4 (%)
Housing units in structures - 5 to 9 (%)
Housing units in structures - 10 to 19 (%)
Housing units in structures - 20 to 49 (%)
Housing units in structures - 50 or more (%)
Housing units in structures - Mobile home (%)
Housing units in structures - Boat, RV, van, etc. (%)
Housing units in structures - Owners - 1, detached (%)
Housing units in structures - Owners - 1, attached (%)
Housing units in structures - Owners - 2 (%)
Housing units in structures - Owners - 3 or 4 (%)
Housing units in structures - Owners - 5 to 9 (%)
Housing units in structures - Owners - 10 to 19 (%)
Housing units in structures - Owners - 20 to 49 (%)
Housing units in structures - Owners - 50 or more (%)
Housing units in structures - Owners - Mobile home (%)
Housing units in structures - Owners - Boat, RV, van, etc. (%)
Housing units in structures - Renters - 1, detached (%)
Housing units in structures - Renters - 1, attached (%)
Housing units in structures - Renters - 2 (%)
Housing units in structures - Renters - 3 or 4 (%)
Housing units in structures - Renters - 5 to 9 (%)
Housing units in structures - Renters - 10 to 19 (%)
Housing units in structures - Renters - 20 to 49 (%)
Housing units in structures - Renters - 50 or more (%)
Housing units in structures - Renters - Mobile home (%)
Housing units in structures - Renters - Boat, RV, van, etc. (%)
House/condo owner moved in on average (years ago)
Renter moved in on average (years ago)
Year householder moved into unit - Moved in 1999 to March 2000 (%)
Year householder moved into unit - Moved in 1999 to March 2000 (%) - White
Year householder moved into unit - Moved in 1999 to March 2000 (%) - Black or African American
Year householder moved into unit - Moved in 1999 to March 2000 (%) - Asian
Year householder moved into unit - Moved in 1999 to March 2000 (%) - Hispanic or Latino
Year householder moved into unit - Moved in 1999 to March 2000 (%) - American Indian and Alaska Native
Year householder moved into unit - Moved in 1999 to March 2000 (%) - Multirace
Year householder moved into unit - Moved in 1999 to March 2000 (%) - Other Race
Year householder moved into unit - Moved in 1995 to 1998 (%)
Year householder moved into unit - Moved in 1995 to 1998 (%) - White
Year householder moved into unit - Moved in 1995 to 1998 (%) - Black or African American
Year householder moved into unit - Moved in 1995 to 1998 (%) - Asian
Year householder moved into unit - Moved in 1995 to 1998 (%) - Hispanic or Latino
Year householder moved into unit - Moved in 1995 to 1998 (%) - American Indian and Alaska Native
Year householder moved into unit - Moved in 1995 to 1998 (%) - Multirace
Year householder moved into unit - Moved in 1995 to 1998 (%) - Other Race
Year householder moved into unit - Moved in 1990 to 1994 (%)
Year householder moved into unit - Moved in 1990 to 1994 (%) - White
Year householder moved into unit - Moved in 1990 to 1994 (%) - Black or African American
Year householder moved into unit - Moved in 1990 to 1994 (%) - Asian
Year householder moved into unit - Moved in 1990 to 1994 (%) - Hispanic or Latino
Year householder moved into unit - Moved in 1990 to 1994 (%) - American Indian and Alaska Native
Year householder moved into unit - Moved in 1990 to 1994 (%) - Multirace
Year householder moved into unit - Moved in 1990 to 1994 (%) - Other Race
Year householder moved into unit - Moved in 1980 to 1989 (%)
Year householder moved into unit - Moved in 1980 to 1989 (%) - White
Year householder moved into unit - Moved in 1980 to 1989 (%) - Black or African American
Year householder moved into unit - Moved in 1980 to 1989 (%) - Asian
Year householder moved into unit - Moved in 1980 to 1989 (%) - Hispanic or Latino
Year householder moved into unit - Moved in 1980 to 1989 (%) - American Indian and Alaska Native
Year householder moved into unit - Moved in 1980 to 1989 (%) - Multirace
Year householder moved into unit - Moved in 1980 to 1989 (%) - Other Race
Year householder moved into unit - Moved in 1970 to 1979 (%)
Year householder moved into unit - Moved in 1970 to 1979 (%) - White
Year householder moved into unit - Moved in 1970 to 1979 (%) - Black or African American
Year householder moved into unit - Moved in 1970 to 1979 (%) - Asian
Year householder moved into unit - Moved in 1970 to 1979 (%) - Hispanic or Latino
Year householder moved into unit - Moved in 1970 to 1979 (%) - American Indian and Alaska Native
Year householder moved into unit - Moved in 1970 to 1979 (%) - Multirace
Year householder moved into unit - Moved in 1970 to 1979 (%) - Other Race
Year householder moved into unit - Moved in 1969 or earlier (%)
Year householder moved into unit - Moved in 1969 or earlier (%) - White
Year householder moved into unit - Moved in 1969 or earlier (%) - Black or African American
Year householder moved into unit - Moved in 1969 or earlier (%) - Asian
Year householder moved into unit - Moved in 1969 or earlier (%) - Hispanic or Latino
Year householder moved into unit - Moved in 1969 or earlier (%) - American Indian and Alaska Native
Year householder moved into unit - Moved in 1969 or earlier (%) - Multirace
Year householder moved into unit - Moved in 1969 or earlier (%) - Other Race
Housing units lacking complete plumbing facilities (%)
Housing units lacking complete kitchen facilities (%)
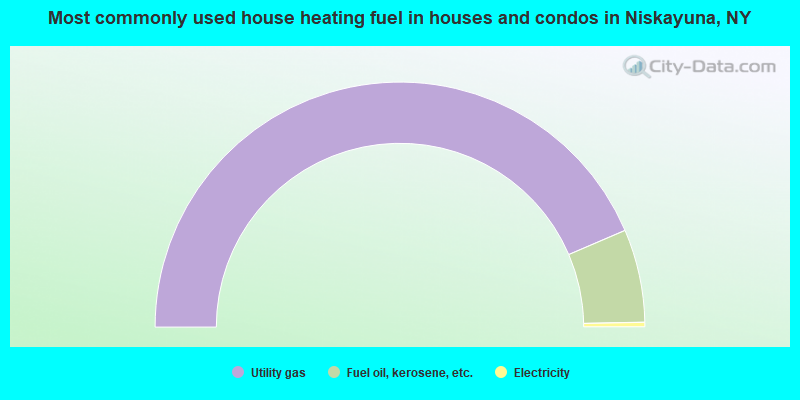
House heating fuel used in houses and condos - Utility gas (%)
House heating fuel used in houses and condos - Bottled, tank, or LP gas (%)
House heating fuel used in houses and condos - Electricity (%)
House heating fuel used in houses and condos - Fuel oil, kerosene, etc. (%)
House heating fuel used in houses and condos - Coal or coke (%)
House heating fuel used in houses and condos - Wood (%)
House heating fuel used in houses and condos - Solar energy (%)
House heating fuel used in houses and condos - Other fuel (%)
House heating fuel used in houses and condos - No fuel used (%)
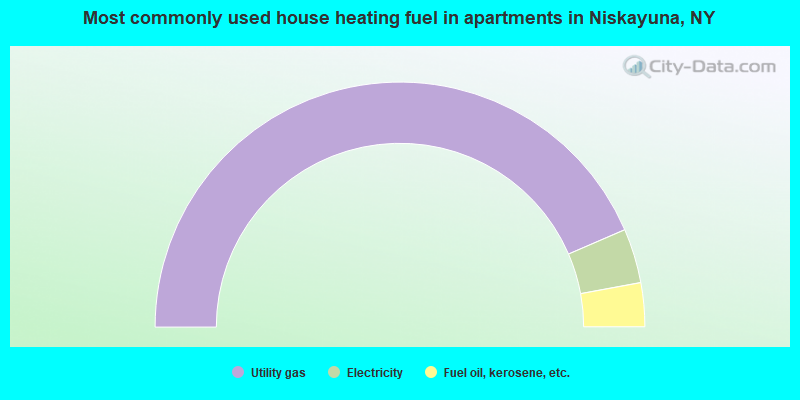
House heating fuel used in apartments - Utility gas (%)
House heating fuel used in apartments - Bottled, tank, or LP gas (%)
House heating fuel used in apartments - Electricity (%)
House heating fuel used in apartments - Fuel oil, kerosene, etc. (%)
House heating fuel used in apartments - Coal or coke (%)
House heating fuel used in apartments - Wood (%)
House heating fuel used in apartments - Solar energy (%)
House heating fuel used in apartments - Other fuel (%)
House heating fuel used in apartments - No fuel used (%)
Latest news about housing in Niskayuna, NY collected exclusively by city-data.com from local newspapers, TV, and radio stations
Household type by relationship:
Households: 150,293
In family households: 121,433 (25,255 male householders , 14,072 female householders )
27,748 spouses , 44,019 children (41,216 natural , 1,014 adopted , 1,789 stepchildren ), 2,264 grandchildren , 1,144 brothers or sisters , 1,263 parents , foster children , 1,275 other relatives , 3,690 non-relatives In nonfamily households: 28,860 (10,745 male householders (8,311 living alone )), 12,814 female householders (10,920 living alone )), 5,301 nonrelatives In group quarters: 4,434 (1,369 institutionalized population)
22,896 married couples with children. single-parent households (2,029 men , 8,125 women ).
92.8% of residents of Niskayuna speak English at home. of residents speak Spanish at home (79% speak English very well , 21% speak English well ).of residents speak other Indo-European language at home (87% speak English very well , 10% speak English well , 3% speak English not well ).of residents speak Asian or Pacific Island language at home (100% speak English very well ).of residents speak other language at home (26% speak English very well , 74% speak English well ).
Foreign born population: 540 (10.2%)of them are naturalized citizens )
Median number of rooms in houses and condos:
Median number of rooms in apartments
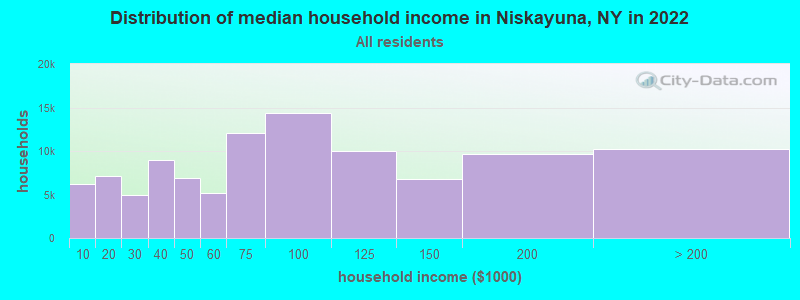
Niskayuna, NY household income distribution 6,237 Less than $10,0007,141 $10,000 to $19,9994,931 $20,000 to $29,9998,986 $30,000 to $39,9996,946 $40,000 to $49,9995,151 $50,000 to $59,99912,013 $60,000 to $74,99914,386 $75,000 to $99,9999,989 $100,000 to $124,9996,806 $125,000 to $149,9999,706 $150,000 to $199,99910,234 $200,000 or more
Percentage of workers working in this county: 54.4%Number of people working at home: 377 (13.3% of all workers )
Travel time to work (commute)
Less than 5 minutes: 595 to 9 minutes: 40410 to 14 minutes: 44715 to 19 minutes: 36620 to 24 minutes: 29625 to 29 minutes: 16830 to 34 minutes: 35335 to 39 minutes: 7140 to 44 minutes: 7645 to 59 minutes: 6660 to 89 minutes: 4590 or more minutes: 14
Means of transportation to work:
Drove a car alone: 2,107 (86.5%)Carpooled: 169 (6.9%)Bus or trolley bus : 26 (1.1%)Taxi: 6 (0.2%)Walked: 44 (1.8%)Other means: 13 (0.5%)Worked at home: 70 (2.9%)
Year of entry for the foreign-born population in Niskayuna, New York
94 1995 to March 2000 5 1990 to 1994 59 1985 to 1989 19 1980 to 1984 0 1975 to 1979 12 1970 to 1974 12 1965 to 1969 44 Before 1965
First ancestries reported:
Irish: 1,237 (19.1%)
Italian: 942 (14.6%)
German: 795 (12.3%)
English: 787 (12.2%)
Polish: 490 (7.6%)
Other: 475 (7.4%)
French: 249 (3.9%)
United States: 243 (3.8%)
Russian: 215 (3.3%)
Scottish: 172 (2.7%)
French Canadian: 133 (2.1%)
Dutch: 122 (1.9%)
Swedish: 91 (1.4%)
Scotch-Irish: 77 (1.2%)
Welsh: 63 (1.0%)
Hungarian: 61 (0.9%)
Norwegian: 61 (0.9%)
Ukrainian: 46 (0.7%)
Lithuanian: 42 (0.7%)
Danish: 41 (0.6%)
Arab: 40 (0.6%)
Czech: 23 (0.4%)
Slovak: 14 (0.2%)
Greek: 13 (0.2%)
Portuguese: 12 (0.2%)
Swiss: 9 (0.1%)
Subsaharan African: 7 (0.1%) Most common places of birth for foreign-born residents (%): Poland Niskayuna:
21.2% (52)New York:
2.4% (93,187)
India Niskayuna:
16.7% (41)New York:
3.0% (117,238)
Germany Niskayuna:
14.7% (36)New York:
1.8% (69,327)
Russia Niskayuna:
12.2% (30)New York:
2.4% (94,595)
Korea Niskayuna:
8.2% (20)New York:
2.5% (97,933)
China, excluding Hong Kong and Taiwan Niskayuna:
5.3% (13)New York:
6.0% (233,766)
Italy Niskayuna:
4.1% (10)New York:
3.8% (147,729)
United Kingdom Niskayuna:
2.9% (7)New York:
1.6% (62,237)
Greece Niskayuna:
2.9% (7)New York:
1.1% (42,335)
Other South Eastern Asia Niskayuna:
2.9% (7)New York:
0.2% (6,761)
Israel Niskayuna:
2.9% (7)New York:
0.8% (29,390)
Other Northern Africa Niskayuna:
2.9% (7)New York:
0.3% (11,568)
Sweden Niskayuna:
1.6% (4)New York:
0.1% (4,305)
Other Western Europe Niskayuna:
1.6% (4)New York:
0.3% (10,672)
Place of birth for U.S.-born residents:
This state: 3,468Other state: 1,076Northeast: 518Midwest: 240South: 163West: 155 74% of Niskayuna residents lived in the same house 5 years ago.
Out of people who lived in different houses, 52% lived in this county.
Out of people who lived in different counties, 76% lived in New York.
Education attainment for males 25 years and older:
No schooling: 3Nursery to 4th grade: 05th and 6th grade: 07th and 8th grade: 89th grade: 010th grade: 411th grade: 512th grade, no diploma: 14High school graduate (or equivalency): 150Less than 1 year of college: 76Some college more than 1 year, no degree: 217Associate degree: 117Bachelor's degree: 452Master's degree: 239Professional school degree: 109Doctorate degree: 104
Education attainment for females 25 years and older:
No schooling: 0Nursery to 4th grade: 75th and 6th grade: 07th and 8th grade: 09th grade: 710th grade: 011th grade: 1212th grade, no diploma: 46High school graduate (or equivalency): 255Less than 1 year of college: 53Some college more than 1 year, no degree: 215Associate degree: 238Bachelor's degree: 458Master's degree: 439Professional school degree: 91Doctorate degree: 14
Housing units in structures:
One, detached: 1,784One, attached: 9Two: 533 or 4: 195 to 9: 710 to 19: 6420 to 49: 12Private vs. public school enrollment:
Students in private schools in grades 1 to 8 (elementary and middle school): 62 Students in private schools in grades 9 to 12 (high school): 11 Students in private undergraduate colleges: 22