Nissequogue, NY (New York) Houses and Residents
| Nissequogue: | $1,135,318 |
| New York: | $400,400 |
Mean price in 2022:
Detached houses: $1,878,583
Here: $1,878,583 State: $476,719
Total population: 1,761 (Urban population: 1,543, Rural population: 0)
Houses: 605 (546 occupied: 459 owner occupied, 87 renter occupied)
| % of renters here: | 16% |
| State: | 46% |
Housing density: 160 houses/condos per square mile
Median price asked for vacant for-sale houses and condos in 2022: $1,240,376.
Median contract rent in 2022: over $2,000 (lower quartile is over $2,000, upper quartile is over $2,000)
Median rent asked for vacant for-rent units in 2022: $17,626
Median gross rent in Nissequogue, NY in 2022: over $2,000
Housing units in Nissequogue with a mortgage: 266 (31 second mortgage, 0 home equity loan, 29 both second mortgage and home equity loan)
Houses without a mortgage: 24
Median household income for houses/condos with a mortgage: $200,530
Median household income for apartments without a mortgage: $162,646
Median monthly housing costs: $3,727
Compare current foreclosures near Nissequogue, NY:
| Photo | Address | Area | Beds / Baths | Price | Details |
|---|---|---|---|---|---|

|
#1
Edcris Ln
Huntington, NY 11743
|
1,450 sq. feet
|
2 baths 3 beds |
$550,000
|
show details |

|
#2
Jillit Dr
Smithtown, NY 11787
|
1,480 sq. feet
|
1 baths 3 beds |
$775,000
|
show details |

|
#3
6th Ave Apt A
Huntington Station, NY 11746
|
3,300 sq. feet
|
4 baths 7 beds |
$999,900
|
show details |

|
#4
Timber Ridge Dr
Commack, NY 11725
|
2,564 sq. feet
|
2 baths 4 beds |
$884,000
|
show details |

|
#5
Rocky Point Yaphank Rd
Rocky Point, NY 11778
|
1,000 sq. feet
|
1 baths 2 beds |
$189,900
|
show details |

|
#6
Rocky Point Yaphank Rd
Rocky Point, NY 11778
|
850 sq. feet
|
1 baths 1 beds |
$192,900
|
show details |

|
#7
Lorring St
Patchogue, NY 11772
|
1,230 sq. feet
|
2 baths 3 beds |
$342,400
|
show details |

|
#8
Silverleaf Ln
Islandia, NY 11749
|
1,932 sq. feet
|
3 baths 3 beds |
$667,900
|
show details |

|
#9
Bayview Ave
Patchogue, NY 11772
|
1,488 sq. feet
|
1 baths 4 beds |
$585,000
|
show details |

|
#10
Brentwood Pkwy
Brentwood, NY 11717
|
- sq. feet
|
4 baths 5 beds |
$468,000
|
show details |
| Photo | Address | Area | Beds / Baths | Price | Details |
|---|---|---|---|---|---|

|
#11
Superior St
Port Jefferson Station, NY 11776
|
- sq. feet
|
1 baths 3 beds |
$265,200
|
show details |

|
#12
Monet Ct
Middle Island, NY 11953
|
- sq. feet
|
1 baths 1 beds |
$189,900
|
show details |

|
#13
Falcon Ave
Medford, NY 11763
|
- sq. feet
|
1 baths 3 beds |
$409,900
|
show details |

|
#14
Hayfield Ct
Commack, NY 11725
|
- sq. feet
|
1 baths 3 beds |
$603,250
|
show details |

|
#15
Kirby Ln
Central Islip, NY 11722
|
- sq. feet
|
1 baths 3 beds |
$395,200
|
show details |

|
#16
3rd St
Brentwood, NY 11717
|
- sq. feet
|
1 baths 3 beds |
$379,980
|
show details |

|
#17
Sasco Hill Rd
Fairfield, CT 06824
|
- sq. feet
|
5 baths 5 beds |
$5,990,000
|
show details |

|
#18
11th Ave
Huntington Station, NY 11746
|
- sq. feet
|
2 baths 4 beds |
$399,000
|
show details |

|
#19
Pearl St
Bohemia, NY 11716
|
- sq. feet
|
2 baths 4 beds |
$475,000
|
show details |

|
#20
Meadowbrook Dr
Sound Beach, NY 11789
|
- sq. feet
|
1 baths 3 beds |
$249,900
|
show details |
| Photo | Address | Area | Beds / Baths | Price | Details |
|---|---|---|---|---|---|

|
#21
Monroe Ave
Brentwood, NY 11717
|
- sq. feet
|
2 baths 3 beds |
$389,900
|
show details |

|
#22
Rocky Point Yaphank Rd Apt 146
Rocky Point, NY 11778
|
- sq. feet
|
1 baths 1 beds |
$199,900
|
show details |

|
#23
Whiskey Rd
Coram, NY 11727
|
- sq. feet
|
3 baths 4 beds |
$549,900
|
show details |

|
#24
Lincoln Blvd
Bay Shore, NY 11706
|
- sq. feet
|
2 baths 3 beds |
$490,000
|
show details |

|
#25
Wall St
Farmingdale, NY 11735
|
- sq. feet
|
1 baths 3 beds |
$442,000
|
show details |

|
#26
Clark St
Patchogue, NY 11772
|
2,929 sq. feet
|
2 baths 5 beds |
show details | |

|
#27
Pal Ct
Shoreham, NY 11786
|
3,605 sq. feet
|
2 baths 4 beds |
show details | |

|
#28
N Swezeytown Rd
Middle Island, NY 11953
|
1,092 sq. feet
|
1 baths 3 beds |
show details | |

|
#29
Bruce Ct
Selden, NY 11784
|
2,264 sq. feet
|
2 baths 5 beds |
show details | |

|
#30
Oxhead Rd
Centereach, NY 11720
|
2,970 sq. feet
|
2 baths 3 beds |
show details |
| Photo | Address | Area | Beds / Baths | Price | Details |
|---|---|---|---|---|---|

|
#31
Wellwood Ave
West Babylon, NY 11704
|
1,644 sq. feet
|
2 baths 4 beds |
show details | |

|
#32
Chestnut Ave
Medford, NY 11763
|
1,106 sq. feet
|
1 baths 3 beds |
show details | |

|
#33
Magaw Pl
West Babylon, NY 11704
|
1,849 sq. feet
|
2 baths 4 beds |
show details | |

|
#34
Sweetgum Ln
Miller Place, NY 11764
|
4,258 sq. feet
|
4 baths 5 beds |
show details | |

|
#35
Yerk Ave
Ronkonkoma, NY 11779
|
1,464 sq. feet
|
1 baths 2 beds |
show details | |

|
#36
Beaverhill Ln
Huntington, NY 11743
|
2,400 sq. feet
|
3 baths 5 beds |
show details | |

|
#37
B Shore Rd
Mount Sinai, NY 11766
|
3,598 sq. feet
|
3 baths 4 beds |
show details | |

|
#38
Claywood Dr
Brentwood, NY 11717
|
1,222 sq. feet
|
2 baths 3 beds |
show details | |

|
#39
Roslyn Ave
Selden, NY 11784
|
1,125 sq. feet
|
2 baths 3 beds |
show details | |

|
#40
Wading River Hollow Rd
Ridge, NY 11961
|
1,912 sq. feet
|
2 baths 3 beds |
show details |
| Photo | Address | Area | Beds / Baths | Price | Details |
|---|---|---|---|---|---|

|
#41
Vale Ct
Mount Sinai, NY 11766
|
2,070 sq. feet
|
2 baths 4 beds |
show details | |

|
#42
Pulaski Rd
Kings Park, NY 11754
|
3,224 sq. feet
|
3 baths 4 beds |
show details | |

|
#43
Evergreen Rd
Rocky Point, NY 11778
|
1,344 sq. feet
|
3 baths 4 beds |
show details | |

|
#44
Henderson Pl
Brentwood, NY 11717
|
8,494 sq. feet
|
2 baths 3 beds |
show details | |

|
#45
S Snedecor Ave
Bayport, NY 11705
|
3,100 sq. feet
|
3 baths 5 beds |
show details | |

|
#46
Swan River St
Patchogue, NY 11772
|
- sq. feet
|
2 baths 4 beds |
show details | |

|
#47
Oswego Ave
Medford, NY 11763
|
1,521 sq. feet
|
2 baths 4 beds |
show details | |

|
#48
Delmar Ln
Commack, NY 11725
|
2,619 sq. feet
|
3 baths 4 beds |
show details | |

|
#49
Spruce Ave
West Islip, NY 11795
|
3,600 sq. feet
|
5 baths 5 beds |
show details | |

|
Check over 1 million property listings on Foreclosure.com!
|
browse all offers | |||

Latest news about housing in Nissequogue, NY collected exclusively by city-data.com from local newspapers, TV, and radio stations

 | Doctors Making $350,000 Are Struggling to Find Long Island Homes (33 replies) |
| $100k salary in Farmingdale + nearby housing options (145 replies) |
| Hochul Throws Cold Water On LI Sites for Migrants - Adams Presses On. (54 replies) |
| LI home prices post biggest gain in 10+ years (51 replies) |
| Fight the Garden Apartments! (Nesconset) (137 replies) |
| Reputable Homeowners/Auto Insurance broker (12 replies) |

Median year apartment built: 1992
Household type by relationship:
Households: 1,523- Male householders: 317 (48 living alone), Female householders: 228 (35 living alone)
377 spouses (367 opposite-sex spouses), 17 unmarried partners, (17 opposite-sex unmarried partners), 475 children (457 natural, 14 adopted, 4 stepchildren), 3 grandchildren, 14 brothers or sisters, 16 parents, 0 foster children, 6 other relatives, 23 non-relatives
- In group quarters: 47
Size of family households: 234 2-persons, 107 3-persons, 75 4-persons, 39 5-persons.
Size of nonfamily households: 83 1-person, 9 2-persons.
206 married couples with children.
63 single-parent households (52 men, 11 women).
86.4% of residents of Nissequogue speak English at home.
2.3% of residents speak Spanish at home (71% speak English very well, 29% speak English well).
5.4% of residents speak other Indo-European language at home (86% speak English very well, 14% speak English well).
3.0% of residents speak Asian or Pacific Island language at home (82% speak English very well, 9% speak English well, 9% speak English not well).
2.3% of residents speak other language at home (85% speak English very well, 15% speak English not well).
Foreign born population: 170 (11.2%)
(67.1% of them are naturalized citizens)
| Here: | 9.9 |
| State: | 6.3 |
| Here: | 6.5 |
| State: | 3.8 |

- Bedrooms in owner-occupied houses and condos in Nissequogue, New York
- 0no bedroom
- 21 bedroom
- 82 bedrooms
- 943 bedrooms
- 2364 bedrooms
- 1195+ bedrooms

- Bedrooms in renter-occupied apartments in Nissequogue, New York
- 2no bedroom
- 01 bedroom
- 132 bedrooms
- 583 bedrooms
- 34 bedrooms
- 115+ bedrooms

- Cars and other vehicles available in Nissequogue in owner-occupied houses/condos
- 5no vehicle
- 721 vehicle
- 1912 vehicles
- 1213 vehicles
- 404 vehicles
- 295+ vehicles

- Cars and other vehicles available in Nissequogue in renter-occupied apartments
- 0no vehicle
- 601 vehicle
- 242 vehicles
- 33 vehicles
- 04 vehicles
- 05+ vehicles

- Rooms in owner-occupied houses in Nissequogue, New York
- 01 room
- 02 rooms
- 03 rooms
- 54 rooms
- 155 rooms
- 126 rooms
- 1067 rooms
- 548 rooms
- 2679+ rooms

- Rooms in renter-occupied apartments in Nissequogue, New York
- 21 room
- 02 rooms
- 03 rooms
- 04 rooms
- 105 rooms
- 386 rooms
- 137 rooms
- 38 rooms
- 219+ rooms


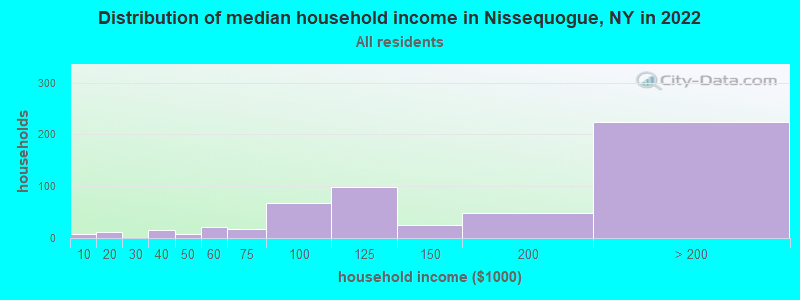
Nissequogue, NY household income distribution

- 7Less than $10,000
- 12$10,000 to $19,999
- 16$30,000 to $39,999
- 8$40,000 to $49,999
- 22$50,000 to $59,999
- 18$60,000 to $74,999
- 68$75,000 to $99,999
- 99$100,000 to $124,999
- 25$125,000 to $149,999
- 48$150,000 to $199,999
- 224$200,000 or more
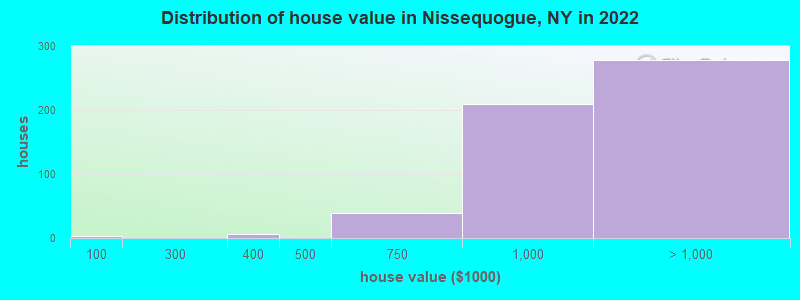
Home value of owner - occupied houses in 2022 in Nissequogue, NY
-
- 2$10,000 to $14,999
- 2$90,000 to $99,999
- 6$300,000 to $399,999
- 38$500,000 to $749,999
- 209$750,000 to $999,999
- 181$1,000,000 to $1,499,999
- 45$1,500,000 to $1,999,999
- 51$2,000,000 or more
Rent paid by renters in 2022 in Nissequogue, NY
-
- 9$1,250 to $1,499
- 10$2,000 to $2,499
- 84$2,500 to $2,999
- 4$3,500 or more


Percentage of workers working in this county: 90.2%
Number of people working at home: 224 (29.9% of all workers)
Travel time to work (commute)
- Less than 5 minutes: 33
- 5 to 9 minutes: 7
- 10 to 14 minutes: 60
- 15 to 19 minutes: 68
- 20 to 24 minutes: 107
- 25 to 29 minutes: 71
- 30 to 34 minutes: 82
- 35 to 39 minutes: 19
- 40 to 44 minutes: 20
- 45 to 59 minutes: 45
- 60 to 89 minutes: 27
- 90 or more minutes: 16
Means of transportation to work:
- Drove a car alone: 604 (79.0%)
- Carpooled: 48 (6.3%)
- Railroad: 33 (4.3%)
- Walked: 7 (0.9%)
- Other means: 12 (1.6%)
- Worked at home: 61 (8.0%)

- Unemployment by race in 2022
- Unemployment rate for White non-Hispanic residents
- 2.4%Males
- 4.4%Females
- Unemployment rate for other race residents
- 19.4%Males
- Unemployment rate for Hispanic or Latino residents
- 21.4%Males

- Year of entry for the foreign-born population in Nissequogue, New York
- 582010 or later
- 62000 to 2009
- 481990 to 1999
- 41980 to 1989
- 131970 to 1979
- 56Before 1970

First ancestries reported:
- Italian: 146 (21.6%)
- Irish: 75 (11.1%)
- American: 37 (5.5%)
- German: 36 (5.3%)
- Dutch: 23 (3.4%)
- Greek: 23 (3.4%)
- Austrian: 19 (2.8%)
- European: 16 (2.4%)
- Polish: 16 (2.4%)
- Northern European: 7 (1.0%)
- French: 6 (0.9%)
- Iraqi: 5 (0.7%)
- Hungarian: 5 (0.7%)
- African: 5 (0.7%)
- Turkish: 5 (0.7%)
- English: 4 (0.6%)
- Iranian: 4 (0.6%)
- Eastern European: 3 (0.4%)
- Norwegian: 3 (0.4%)
- Portuguese: 3 (0.4%)
- Ukrainian: 3 (0.4%)
- Finnish: 2 (0.3%)
- Scandinavian: 2 (0.3%)
- Swiss: 2 (0.3%)
- Armenian: 1 (0.1%)
- Russian: 1 (0.1%)
Most common places of birth for foreign-born residents (%):
| Nissequogue: | 15.9% (25) |
| New York: | 0.2% (8,010) |
| Nissequogue: | 10.8% (17) |
| New York: | 9.1% (410,910) |
| Nissequogue: | 10.2% (16) |
| New York: | 3.5% (158,432) |
| Nissequogue: | 7.6% (12) |
| New York: | 0.6% (27,385) |
| Nissequogue: | 6.4% (10) |
| New York: | 0.9% (38,713) |
| Nissequogue: | 6.4% (10) |
| New York: | 0.6% (28,604) |
| Nissequogue: | 3.8% (6) |
| New York: | 2.0% (91,428) |
| Nissequogue: | 3.2% (5) |
| New York: | 0.7% (30,173) |
| Nissequogue: | 3.2% (5) |
| New York: | 1.2% (55,571) |
| Nissequogue: | 3.2% (5) |
| New York: | 2.5% (111,920) |
| Nissequogue: | 2.5% (4) |
| New York: | 0.5% (23,058) |
| Nissequogue: | 2.5% (4) |
| New York: | 0.5% (21,009) |
| Nissequogue: | 1.9% (3) |
| New York: | 0.1% (6,152) |
| Nissequogue: | 1.9% (3) |
| New York: | 1.4% (62,442) |
| Nissequogue: | 1.9% (3) |
| New York: | 0.7% (30,658) |
Place of birth for U.S.-born residents:
- This state: 1,180
- Other state: 141
- Northeast: 49
- Midwest: 50
- South: 26
- West: 21
82.2% of Nissequogue residents lived in the same house 1 years ago.
Out of people who lived in different houses, 47.6% lived in this county.
Out of people who lived in different counties, 72.4% lived in New York.
| Nissequogue: | 82.2% |
| State average: | 89.6% |
Education attainment for males 25 years and older:
- No schooling: 0
- Nursery to 4th grade: 0
- 5th and 6th grade: 0
- 7th and 8th grade: 0
- 9th grade: 0
- 10th grade: 0
- 11th grade: 0
- 12th grade, no diploma: 0
- High school graduate (or equivalency): 51
- Less than 1 year of college: 41
- Some college more than 1 year, no degree: 53
- Associate degree: 30
- Bachelor's degree: 218
- Master's degree: 85
- Professional school degree: 74
- Doctorate degree: 13

Education attainment for females 25 years and older:
- No schooling: 0
- Nursery to 4th grade: 0
- 5th and 6th grade: 0
- 7th and 8th grade: 0
- 9th grade: 4
- 10th grade: 0
- 11th grade: 0
- 12th grade, no diploma: 2
- High school graduate (or equivalency): 55
- Less than 1 year of college: 16
- Some college more than 1 year, no degree: 44
- Associate degree: 72
- Bachelor's degree: 153
- Master's degree: 119
- Professional school degree: 15
- Doctorate degree: 27


Housing units in structures:
- One, detached: 593
- One, attached: 6
- Two: 6
Housing units lacking complete kitchen facilities in 2022: 1.5%

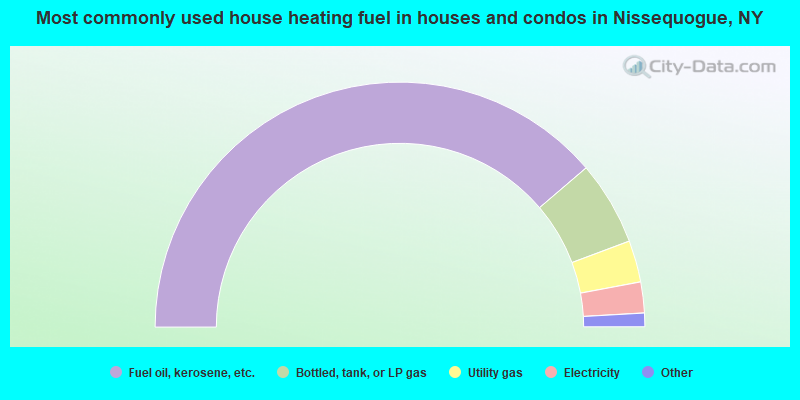
- 77.5%Fuel oil, kerosene, etc.
- 11.1%Bottled, tank, or LP gas
- 5.5%Utility gas
- 4.1%Electricity
- 0.7%Wood
- 0.7%Other fuel
- 0.4%Coal or coke
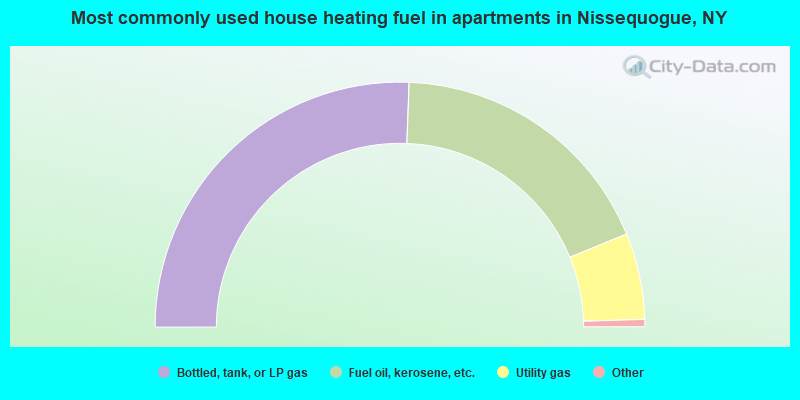
- 51.7%Bottled, tank, or LP gas
- 36.8%Fuel oil, kerosene, etc.
- 11.5%Utility gas
Private vs. public school enrollment:
| Here: | 0.0% |
| New York: | 15.6% |
| Here: | 25.8% |
| New York: | 15.0% |
| Here: | 23.7% |
| New York: | 39.2% |


