Nitro, WV (West Virginia) Houses and Residents
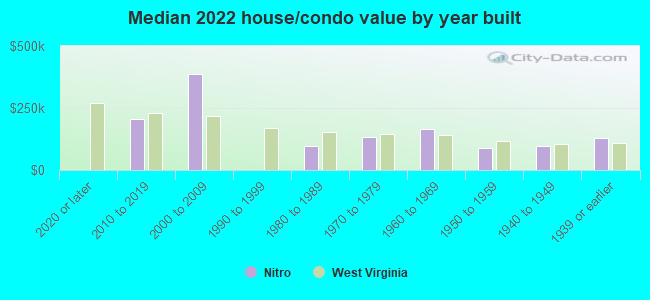
| Nitro: | $113,812 |
| West Virginia: | $155,100 |
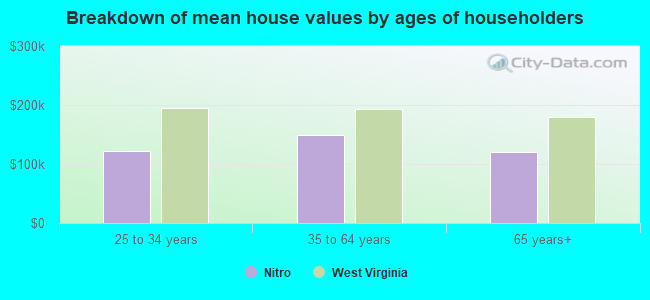
Mean price in 2022:
Detached houses: $153,491
Here: $153,491 State: $206,655 Townhouses or other attached units: $140,970
Here: $140,970 State: $205,683 Mobile homes: $47,361
Here: $47,361 State: $63,963
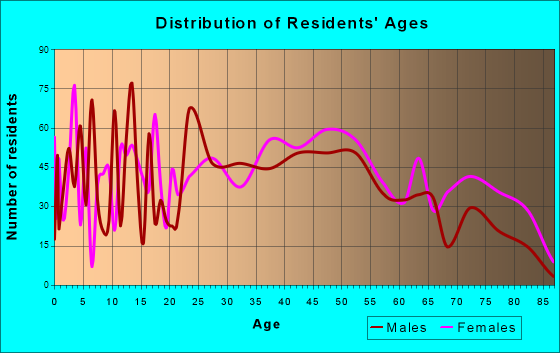
Total population: 6,837 (Urban population: 6,682, Rural population: 325 (all nonfarm))
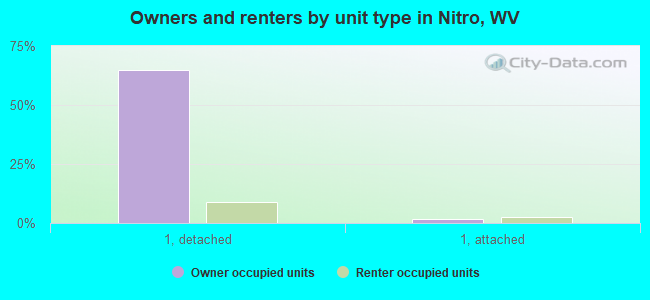
Houses: 3,484 (2,848 occupied: 1,953 owner occupied, 933 renter occupied)
| % of renters here: | 32% |
| State: | 26% |
Housing density: 930 houses/condos per square mile
Median price asked for vacant for-sale houses and condos in 2022: $168,245.
Median contract rent in 2022: $689 (lower quartile is $478, upper quartile is $794)
Median rent asked for vacant for-rent units in 2022: $956
Median gross rent in Nitro, WV in 2022: $804
Housing units in Nitro with a mortgage: 1,021 (9 second mortgage, 0 home equity loan, 8 both second mortgage and home equity loan)
Houses without a mortgage: 20
Median household income for houses/condos with a mortgage: $83,327
Median household income for apartments without a mortgage: $36,331
Median monthly housing costs: $798
Compare current foreclosures near Nitro, WV:
| Photo | Address | Area | Beds / Baths | Price | Details |
|---|---|---|---|---|---|

|
#1
Washington Ave
Nitro, WV 25143
|
- sq. feet
|
- baths - beds |
show details | |

|
#2
36th St
Nitro, WV 25143
|
- sq. feet
|
- baths - beds |
show details | |

|
#3
Frame St
Charleston, WV 25302
|
1,150 sq. feet
|
1 baths 2 beds |
$24,900
|
show details |

|
#4
Scarlet Dr
Poca, WV 25159
|
2,687 sq. feet
|
3 baths 4 beds |
$330,000
|
show details |

|
#5
Redmans Ct
Charleston, WV 25313
|
819 sq. feet
|
1 baths 2 beds |
$25,000
|
show details |

|
#6
Flintstone Cir
Buffalo, WV 25033
|
1,568 sq. feet
|
2 baths 3 beds |
$245,000
|
show details |

|
#7
Florence Dr
Milton, WV 25541
|
1,580 sq. feet
|
2 baths 3 beds |
$160,000
|
show details |

|
#8
Echo Rd
Charleston, WV 25303
|
1,770 sq. feet
|
2 baths 3 beds |
$235,000
|
show details |

|
#9
Main St
Hurricane, WV 25526
|
2,838 sq. feet
|
2 baths 4 beds |
$52,000
|
show details |

|
#10
Limeberger Creek Rd
Poca, WV 25159
|
1,025 sq. feet
|
2 baths 3 beds |
$29,900
|
show details |
| Photo | Address | Area | Beds / Baths | Price | Details |
|---|---|---|---|---|---|

|
#11
19th St
Nitro, WV 25143
|
- sq. feet
|
- baths - beds |
show details | |

|
#12
Bailes Dr
Nitro, WV 25143
|
- sq. feet
|
- baths - beds |
show details | |

|
#13
Planck Dr
Nitro, WV 25143
|
- sq. feet
|
- baths - beds |
show details | |

|
#14
Charles Ave
Dunbar, WV 25064
|
- sq. feet
|
2 baths 5 beds |
$17,700
|
show details |

|
#15
Woodward Dr
Charleston, WV 25312
|
1,249 sq. feet
|
1 baths 3 beds |
$60,000
|
show details |

|
#16
Fishers Branch Rd
Charleston, WV 25312
|
1,288 sq. feet
|
2 baths 4 beds |
show details | |

|
#17
Rocky Fork Rd
Charleston, WV 25312
|
- sq. feet
|
2 baths 3 beds |
show details | |

|
#18
Brierwood Rd
Saint Albans, WV 25177
|
1,584 sq. feet
|
1 baths 3 beds |
show details | |

|
#19
Greenland Cir
Charleston, WV 25309
|
- sq. feet
|
1 baths 3 beds |
show details | |

|
#20
Friendly Dr
Charleston, WV 25387
|
- sq. feet
|
- baths - beds |
$39,900
|
show details |
| Photo | Address | Area | Beds / Baths | Price | Details |
|---|---|---|---|---|---|

|
#21
Southern Woods Dr
Charleston, WV 25309
|
3,456 sq. feet
|
4 baths 4 beds |
show details | |

|
#22
Rosemont Ave
Charleston, WV 25303
|
2,340 sq. feet
|
2 baths 3 beds |
show details | |

|
#23
Derricks Creek Rd
Charleston, WV 25320
|
- sq. feet
|
2 baths 3 beds |
show details | |

|
#24
Buffalo Rd
Buffalo, WV 25033
|
3,000 sq. feet
|
2 baths 3 beds |
show details | |

|
#25
Circle Way
Scott Depot, WV 25560
|
1,533 sq. feet
|
2 baths 3 beds |
show details | |

|
#26
Woodward Dr
Charleston, WV 25312
|
- sq. feet
|
- baths - beds |
$27,900
|
show details |

|
#27
Forest Cir
Charleston, WV 25303
|
- sq. feet
|
1 baths 2 beds |
show details | |

|
#28
White Oak Dr
Culloden, WV 25510
|
1,452 sq. feet
|
2 baths 3 beds |
show details | |

|
#29
Washington Ave SE
Charleston, WV 25304
|
- sq. feet
|
2 baths 3 beds |
show details | |

|
#30
S Main St
Milton, WV 25541
|
1,681 sq. feet
|
1 baths 3 beds |
show details |
| Photo | Address | Area | Beds / Baths | Price | Details |
|---|---|---|---|---|---|

|
#31
Riverview Ct
Milton, WV 25541
|
2,508 sq. feet
|
2 baths 4 beds |
show details | |

|
#32
Green Valley Dr
Saint Albans, WV 25177
|
- sq. feet
|
- baths - beds |
$39,900
|
show details |

|
#33
Green Valley Dr
Saint Albans, WV 25177
|
- sq. feet
|
- baths - beds |
$19,900
|
show details |

|
#34
Mccorkle Rd
Sod, WV 25564
|
- sq. feet
|
- baths - beds |
show details | |

|
#35
Stoneybrook Rd
Charleston, WV 25313
|
- sq. feet
|
- baths - beds |
show details | |

|
#36
Us Route 60
Hurricane, WV 25526
|
- sq. feet
|
- baths - beds |
show details | |

|
#37
Hurricane Creek Rd
Hurricane, WV 25526
|
- sq. feet
|
- baths - beds |
show details | |

|
#38
Red Oak St
Charleston, WV 25302
|
- sq. feet
|
- baths - beds |
show details | |

|
#39
Colony Dr
Charleston, WV 25314
|
- sq. feet
|
- baths - beds |
show details | |

|
#40
Limeberger Creek Rd
Poca, WV 25159
|
- sq. feet
|
- baths - beds |
show details |
| Photo | Address | Area | Beds / Baths | Price | Details |
|---|---|---|---|---|---|

|
#41
Harbour Ln
Hurricane, WV 25526
|
- sq. feet
|
- baths - beds |
show details | |

|
#42
Ravinia Rd
Charleston, WV 25314
|
- sq. feet
|
- baths - beds |
show details | |

|
#43
Midway Rd
Alum Creek, WV 25003
|
- sq. feet
|
- baths - beds |
show details | |

|
#44
Capitol St # 1000
Charleston, WV 25301
|
- sq. feet
|
- baths - beds |
show details | |

|
#45
Tate Hollow Rd
Charleston, WV 25312
|
- sq. feet
|
- baths - beds |
show details | |

|
#46
Zinc Ln
Red House, WV 25168
|
- sq. feet
|
- baths - beds |
show details | |

|
#47
Benedict Rd
Culloden, WV 25510
|
- sq. feet
|
- baths - beds |
show details | |

|
#48
Harrison Ave
Saint Albans, WV 25177
|
- sq. feet
|
- baths - beds |
show details | |

|
#49
Sissonville Dr Lot 213
Charleston, WV 25312
|
- sq. feet
|
- baths - beds |
show details | |

|
Check over 1 million property listings on Foreclosure.com!
|
browse all offers | |||

Latest news about housing in Nitro, WV collected exclusively by city-data.com from local newspapers, TV, and radio stations

 | Charleston Apartments for bad credit (46 replies) |
| Charleston Town Center sold? (296 replies) |
| Observations Of The Town (15 replies) |
| Charleston Urban Renewal Thread (437 replies) |
| Moving to Charleston WV-anyone familiar with these apartments or have anything else to add about favorite areas to live? (41 replies) |
| Hypothetical 250 Million Investment (40 replies) |
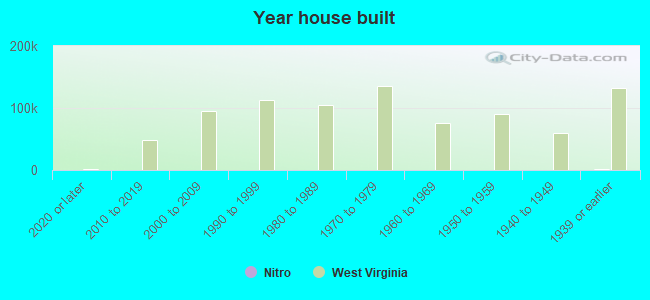
Median year apartment built: 1959
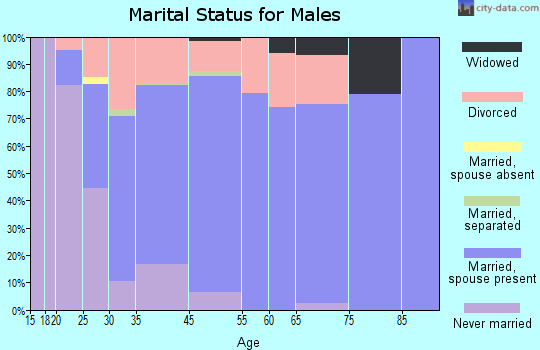
Household type by relationship:
Households: 6,380- Male householders: 975 (310 living alone), Female householders: 1,805 (726 living alone)
1,452 spouses (1,452 opposite-sex spouses), 52 unmarried partners, (41 opposite-sex unmarried partners), 1,815 children (1,701 natural, 59 adopted, 54 stepchildren), 89 grandchildren, 101 brothers or sisters, 0 parents, 0 foster children, 10 other relatives, 76 non-relatives
Size of family households: 915 2-persons, 533 3-persons, 192 4-persons, 54 5-persons, 54 6-persons.
Size of nonfamily households: 1,103 1-person, 56 2-persons.
684 married couples with children.
956 single-parent households (19 men, 937 women).
99.6% of residents of Nitro speak English at home.
0.4% of residents speak other Indo-European language at home (100% speak English very well).
| Here: | 6.7 |
| State: | 6.5 |
| Here: | 4.7 |
| State: | 4.7 |
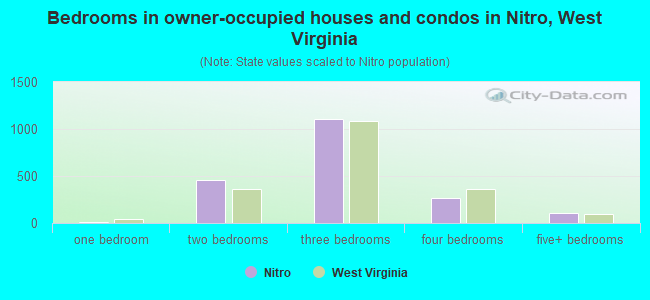
- Bedrooms in owner-occupied houses and condos in Nitro, West Virginia
- 0no bedroom
- 131 bedroom
- 4562 bedrooms
- 1,1113 bedrooms
- 2654 bedrooms
- 1085+ bedrooms
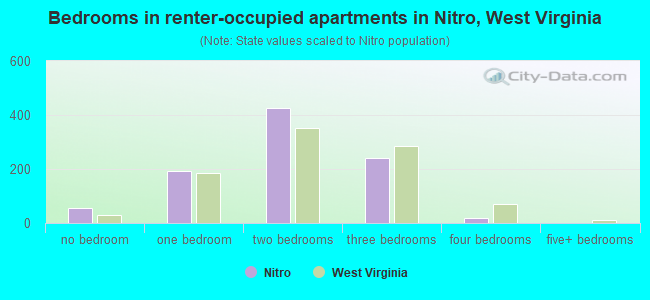
- Bedrooms in renter-occupied apartments in Nitro, West Virginia
- 54no bedroom
- 1911 bedroom
- 4262 bedrooms
- 2423 bedrooms
- 204 bedrooms
- 05+ bedrooms
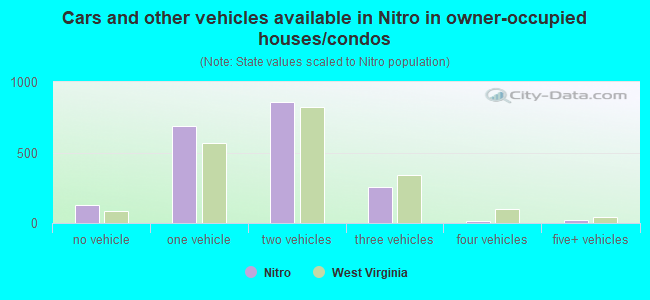
- Cars and other vehicles available in Nitro in owner-occupied houses/condos
- 128no vehicle
- 6861 vehicle
- 8572 vehicles
- 2523 vehicles
- 134 vehicles
- 185+ vehicles
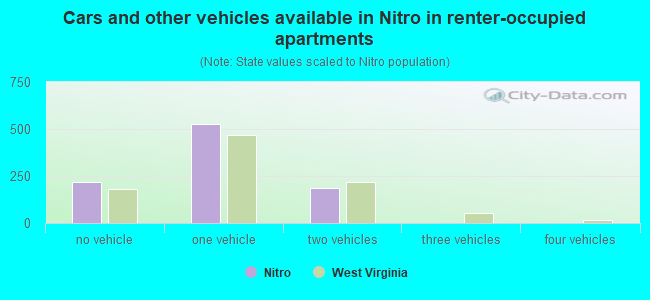
- Cars and other vehicles available in Nitro in renter-occupied apartments
- 220no vehicle
- 5281 vehicle
- 1862 vehicles
- 03 vehicles
- 04 vehicles
- 05+ vehicles
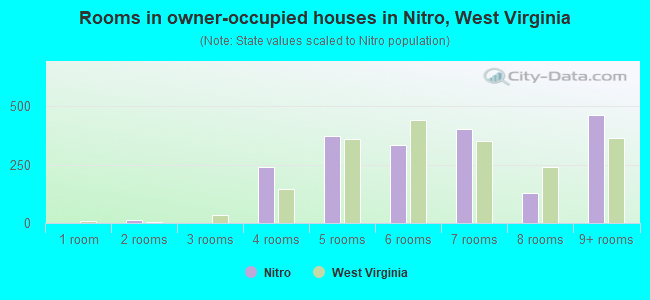
- Rooms in owner-occupied houses in Nitro, West Virginia
- 01 room
- 132 rooms
- 03 rooms
- 2384 rooms
- 3725 rooms
- 3366 rooms
- 4027 rooms
- 1298 rooms
- 4649+ rooms
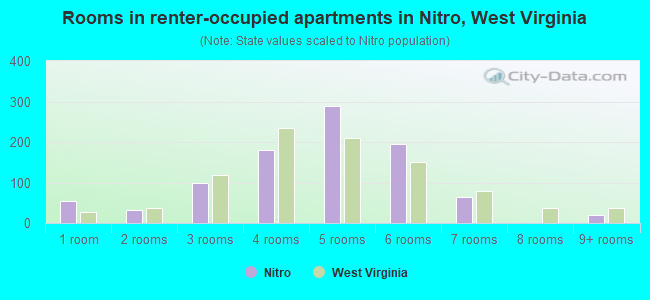
- Rooms in renter-occupied apartments in Nitro, West Virginia
- 541 room
- 332 rooms
- 993 rooms
- 1814 rooms
- 2895 rooms
- 1946 rooms
- 637 rooms
- 08 rooms
- 209+ rooms
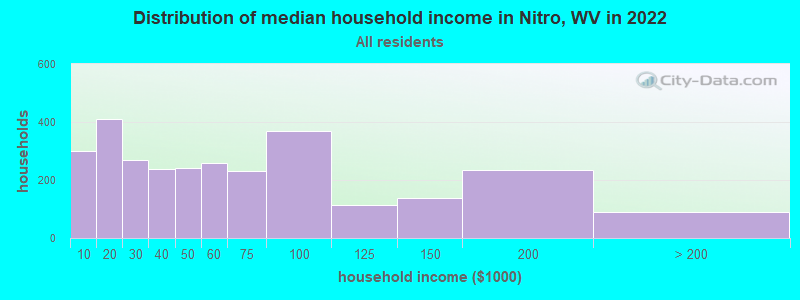
Nitro, WV household income distribution

- 299Less than $10,000
- 411$10,000 to $19,999
- 270$20,000 to $29,999
- 239$30,000 to $39,999
- 240$40,000 to $49,999
- 260$50,000 to $59,999
- 230$60,000 to $74,999
- 368$75,000 to $99,999
- 114$100,000 to $124,999
- 137$125,000 to $149,999
- 233$150,000 to $199,999
- 91$200,000 or more
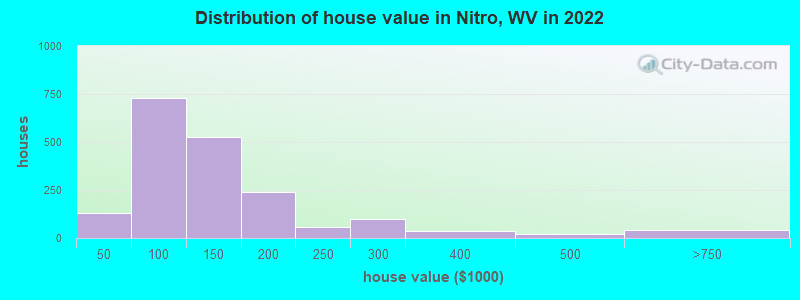
Home value of owner - occupied houses in 2022 in Nitro, WV
-
- 15Less than $10,000
- 4$10,000 to $14,999
- 22$15,000 to $19,999
- 65$30,000 to $34,999
- 10$35,000 to $39,999
- 10$40,000 to $49,999
- 61$50,000 to $59,999
- 225$60,000 to $69,999
- 117$70,000 to $79,999
- 36$80,000 to $89,999
- 277$90,000 to $99,999
- 285$100,000 to $124,999
- 239$125,000 to $149,999
- 157$150,000 to $174,999
- 84$175,000 to $199,999
- 55$200,000 to $249,999
- 100$250,000 to $299,999
- 34$300,000 to $399,999
- 18$400,000 to $499,999
- 32$500,000 to $749,999
- 9$750,000 to $999,999
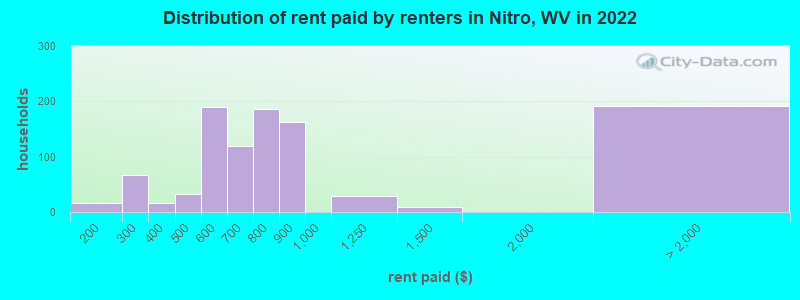
Rent paid by renters in 2022 in Nitro, WV
-
- 16$150 to $199
- 36$200 to $249
- 29$250 to $299
- 16$350 to $399
- 9$400 to $449
- 23$450 to $499
- 146$500 to $549
- 42$550 to $599
- 97$600 to $649
- 20$650 to $699
- 102$700 to $749
- 82$750 to $799
- 162$800 to $899
- 28$1,000 to $1,249
- 9$1,250 to $1,499
- 190No cash rent
Percentage of workers working in this county: 73.8%
Number of people working at home: 96 (3.5% of all workers)
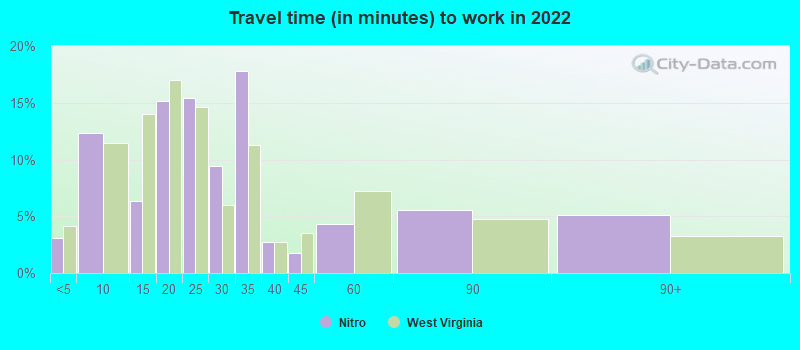
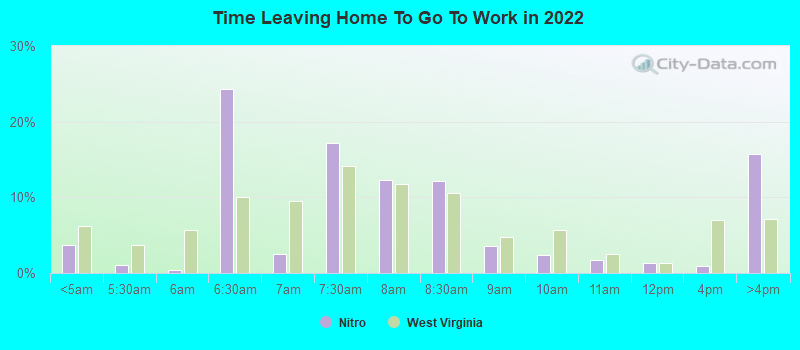
Travel time to work (commute)
- Less than 5 minutes: 107
- 5 to 9 minutes: 217
- 10 to 14 minutes: 159
- 15 to 19 minutes: 268
- 20 to 24 minutes: 834
- 25 to 29 minutes: 368
- 30 to 34 minutes: 165
- 35 to 39 minutes: 181
- 40 to 44 minutes: 0
- 45 to 59 minutes: 69
- 60 to 89 minutes: 0
- 90 or more minutes: 33
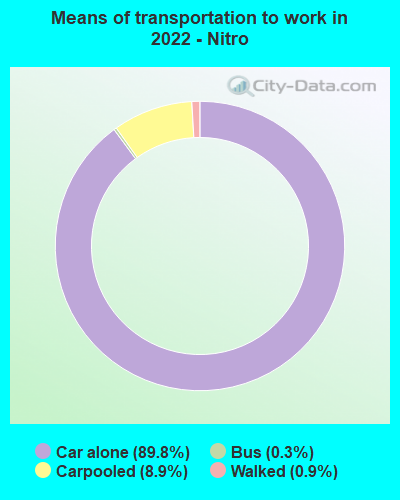
Means of transportation to work:
- Drove a car alone: 2,830 (87.0%)
- Carpooled: 245 (7.5%)
- Bus: 5 (0.2%)
- Taxi: 2 (0.1%)
- Walked: 23 (0.7%)
- Worked at home: 104 (3.2%)
- Unemployment by race in 2022
- Unemployment rate for White non-Hispanic residents
- 9.1%Males
- 7.6%Females
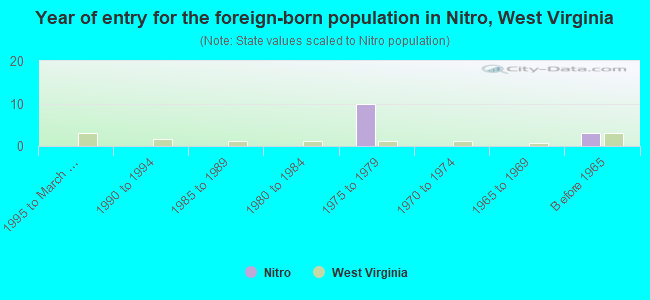
- Year of entry for the foreign-born population in Nitro, West Virginia
- 01995 to March 2000
- 01990 to 1994
- 01985 to 1989
- 01980 to 1984
- 101975 to 1979
- 01970 to 1974
- 01965 to 1969
- 3Before 1965
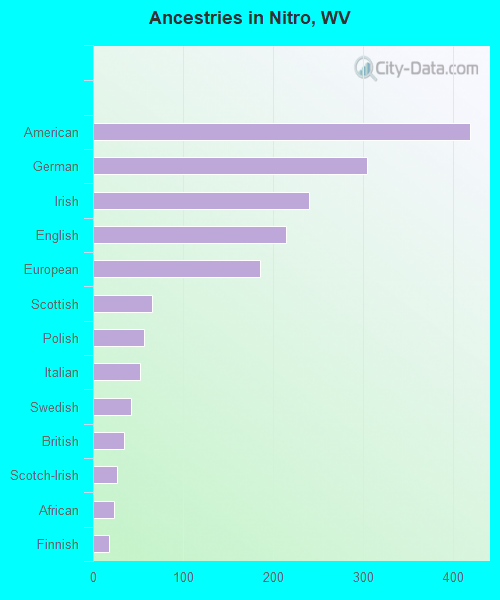
First ancestries reported:
- American: 419 (20.0%)
- German: 304 (14.5%)
- Irish: 240 (11.4%)
- English: 214 (10.2%)
- European: 185 (8.8%)
- Scottish: 65 (3.1%)
- Polish: 57 (2.7%)
- Italian: 52 (2.5%)
- Swedish: 42 (2.0%)
- British: 34 (1.6%)
- Scotch-Irish: 27 (1.3%)
- African: 23 (1.1%)
- Finnish: 18 (0.9%)
Most common places of birth for foreign-born residents (%):
| Nitro: | 76.9% (10) |
| West Virginia: | 4.4% (846) |
| Nitro: | 23.1% (3) |
| West Virginia: | 4.3% (826) |
Place of birth for U.S.-born residents:
- This state: 5,662
- Other state: 684
- Northeast: 85
- Midwest: 241
- South: 349
- West: 14
93.8% of Nitro residents lived in the same house 1 years ago.
Out of people who lived in different houses, 43.5% lived in this county.
Out of people who lived in different counties, 28.8% lived in West Virginia.
| Nitro: | 93.8% |
| State average: | 89.6% |
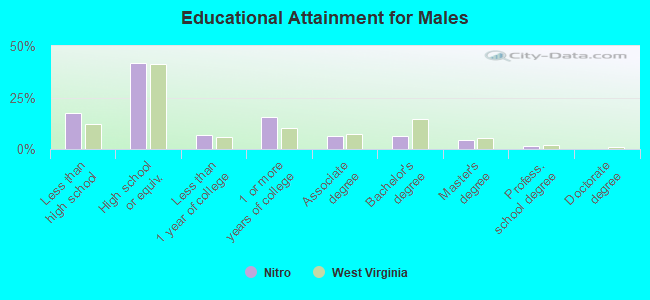
Education attainment for males 25 years and older:
- No schooling: 21
- Nursery to 4th grade: 0
- 5th and 6th grade: 0
- 7th and 8th grade: 11
- 9th grade: 0
- 10th grade: 297
- 11th grade: 0
- 12th grade, no diploma: 30
- High school graduate (or equivalency): 856
- Less than 1 year of college: 135
- Some college more than 1 year, no degree: 319
- Associate degree: 130
- Bachelor's degree: 131
- Master's degree: 89
- Professional school degree: 30
- Doctorate degree: 0
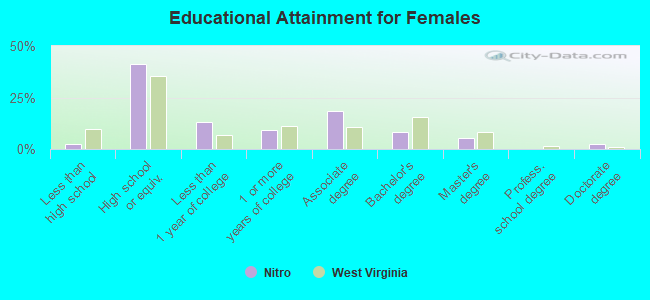
Education attainment for females 25 years and older:
- No schooling: 19
- Nursery to 4th grade: 0
- 5th and 6th grade: 0
- 7th and 8th grade: 0
- 9th grade: 0
- 10th grade: 0
- 11th grade: 10
- 12th grade, no diploma: 29
- High school graduate (or equivalency): 996
- Less than 1 year of college: 317
- Some college more than 1 year, no degree: 218
- Associate degree: 449
- Bachelor's degree: 203
- Master's degree: 124
- Professional school degree: 0
- Doctorate degree: 54
Housing units in structures:
- One, detached: 2,650
- One, attached: 84
- Two: 188
- 3 or 4: 195
- 5 to 9: 124
- 10 to 19: 67
- 20 to 49: 64
- 50 or more: 27
- Mobile homes: 78
Median worth of mobile homes: $95,418
Housing units lacking complete kitchen facilities in 2022: 0.4%
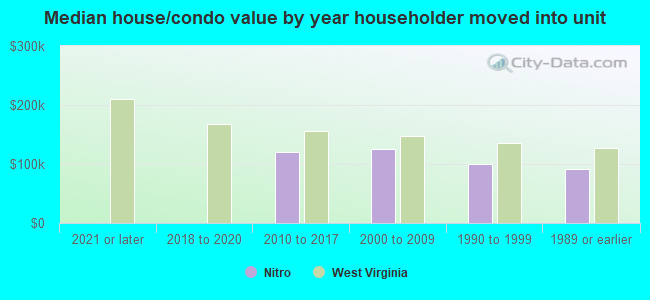
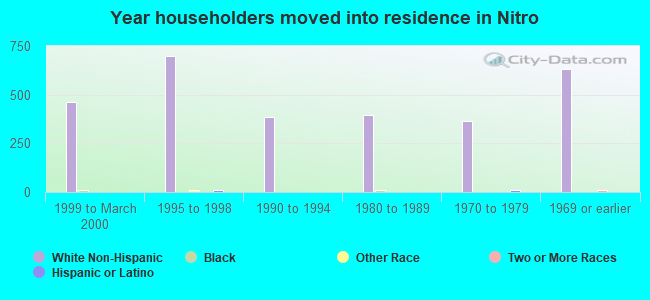
House/condo owner moved in on average 12 years ago
Renter moved in on average 5 years ago
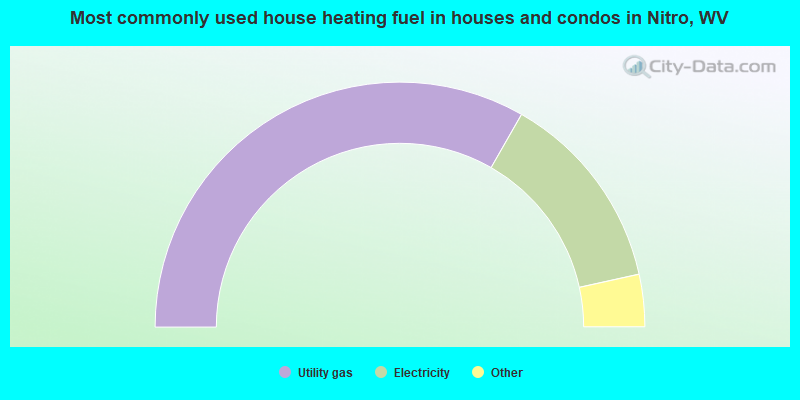
- 66.6%Utility gas
- 26.6%Electricity
- 3.7%Bottled, tank, or LP gas
- 2.5%Wood
- 0.6%No fuel used
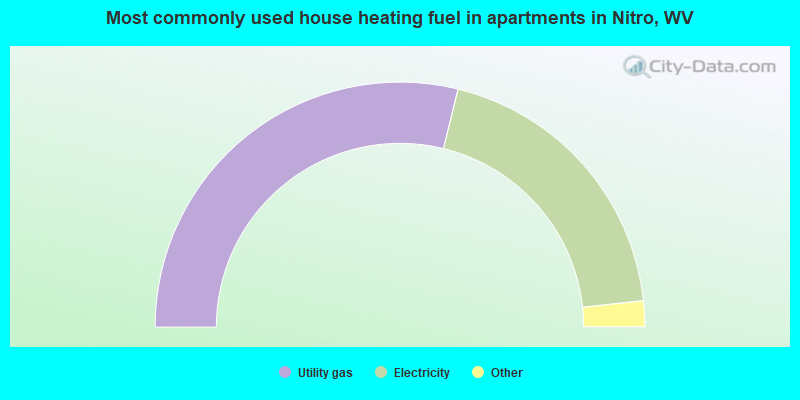
- 57.7%Utility gas
- 39.0%Electricity
- 2.2%No fuel used
- 1.1%Fuel oil, kerosene, etc.
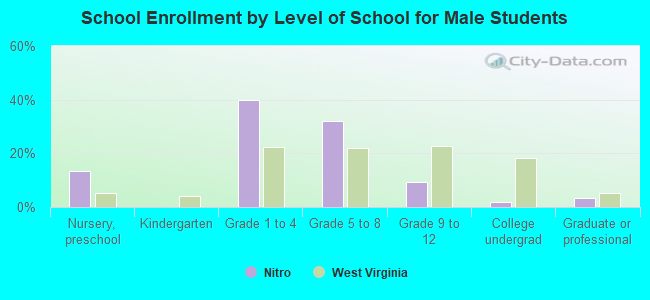
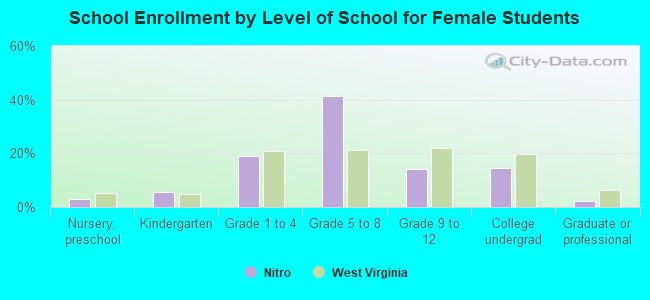
Private vs. public school enrollment:
| Here: | 12.8% |
| West Virginia: | 12.2% |
| Here: | 0.0% |
| West Virginia: | 8.8% |
| Here: | 50.0% |
| West Virginia: | 17.3% |