Norbourne Estates, KY (Kentucky) Houses and Residents
| Norbourne Estates: | $642,012 |
| Kentucky: | $196,300 |
Mean price in 2022:
Detached houses: $656,972
Here: $656,972 State: $256,452
Total population: 452 (All urban)
Houses: 182 (181 occupied: 179 owner occupied, 6 renter occupied)
| % of renters here: | 3% |
| State: | 31% |
Housing density: 2,463 houses/condos per square mile
Median price asked for vacant for-sale houses and condos in 2022 in this county: $108,908.
Median gross rent in Norbourne Estates, KY in 2022: over $2,000
Housing units in Norbourne Estates with a mortgage: 104 (19 second mortgage, 0 home equity loan, 17 both second mortgage and home equity loan)
Houses without a mortgage: 3
Median household income for houses/condos with a mortgage: $220,687
Median household income for apartments without a mortgage: $143,578
Median monthly housing costs: $1,758
Compare current foreclosures near Norbourne Estates, KY:
| Photo | Address | Area | Beds / Baths | Price | Details |
|---|---|---|---|---|---|

|
#1
Cedrus Cir
Louisville, KY 40213
|
1,187 sq. feet
|
2 baths 4 beds |
$180,000
|
show details |

|
#2
Doe Run Way
New Albany, IN 47150
|
1,380 sq. feet
|
2 baths 3 beds |
$285,000
|
show details |

|
#3
Melody Way
Louisville, KY 40299
|
1,242 sq. feet
|
1 baths 3 beds |
$300,000
|
show details |

|
#4
Chillicoop Rd
Shepherdsville, KY 40165
|
- sq. feet
|
2 baths 4 beds |
$99,900
|
show details |

|
#5
Eastside Ave
Sellersburg, IN 47172
|
1,266 sq. feet
|
1 baths 3 beds |
show details | |

|
#6
Fieldstone Ct
New Albany, IN 47150
|
1,276 sq. feet
|
2 baths 3 beds |
show details | |

|
#7
Morris Ave
Jeffersonville, IN 47130
|
1,320 sq. feet
|
1 baths 3 beds |
show details | |

|
#8
S Clark Blvd
Clarksville, IN 47129
|
2,304 sq. feet
|
2 baths 3 beds |
show details | |

|
#9
Breckenridge Ln
Louisville, KY 40218
|
1,472 sq. feet
|
1 baths 2 beds |
show details | |

|
#10
Welch Dr
Louisville, KY 40272
|
740 sq. feet
|
1 baths 2 beds |
show details |
| Photo | Address | Area | Beds / Baths | Price | Details |
|---|---|---|---|---|---|

|
#11
S 42nd St
Louisville, KY 40211
|
1,078 sq. feet
|
1 baths 1 beds |
show details | |

|
#12
Burrell Dr
Louisville, KY 40216
|
1,170 sq. feet
|
1 baths 3 beds |
show details | |

|
#13
Marshall Dr
Charlestown, IN 47111
|
1,650 sq. feet
|
1 baths 4 beds |
show details | |

|
#14
Cross Rd
Louisville, KY 40204
|
2,696 sq. feet
|
2 baths 2 beds |
show details | |

|
#15
Sunset Ln
Crestwood, KY 40014
|
2,574 sq. feet
|
3 baths 4 beds |
show details | |

|
#16
Redbud Dr
New Albany, IN 47150
|
1,080 sq. feet
|
1 baths 3 beds |
show details | |

|
#17
W Chestnut St
Louisville, KY 40203
|
1,568 sq. feet
|
3 baths 3 beds |
show details | |

|
#18
S Bayly Ave
Louisville, KY 40206
|
2,610 sq. feet
|
2 baths 2 beds |
show details | |

|
#19
S 5th St
Louisville, KY 40214
|
1,008 sq. feet
|
1 baths 3 beds |
show details | |

|
#20
Hillside Cir
Charlestown, IN 47111
|
1,322 sq. feet
|
2 baths 3 beds |
show details |
| Photo | Address | Area | Beds / Baths | Price | Details |
|---|---|---|---|---|---|

|
#21
Roosevelt Ave
Louisville, KY 40213
|
- sq. feet
|
1 baths 4 beds |
show details | |

|
#22
Fairway Dr
Mount Washington, KY 40047
|
1,638 sq. feet
|
2 baths 3 beds |
show details | |

|
#23
E Chestnut St
Jeffersonville, IN 47130
|
1,920 sq. feet
|
2 baths 5 beds |
show details | |

|
#24
Highway 11
Lanesville, IN 47136
|
2,128 sq. feet
|
2 baths 3 beds |
show details | |

|
#25
Spicewood Dr
Clarksville, IN 47129
|
1,911 sq. feet
|
1 baths 4 beds |
show details | |

|
#26
Parkwood Dr
Clarksville, IN 47129
|
2,106 sq. feet
|
2 baths 3 beds |
show details | |

|
#27
Longfield Dr
Clarksville, IN 47129
|
858 sq. feet
|
1 baths 3 beds |
show details | |

|
#28
Flagstaff Dr
Jeffersonville, IN 47130
|
1,752 sq. feet
|
3 baths 3 beds |
show details | |

|
#29
Sportsman Dr
Jeffersonville, IN 47130
|
2,244 sq. feet
|
1 baths 4 beds |
show details | |

|
#30
Presidential Pl
Jeffersonville, IN 47130
|
1,145 sq. feet
|
2 baths 3 beds |
show details |
| Photo | Address | Area | Beds / Baths | Price | Details |
|---|---|---|---|---|---|

|
#31
Doe Run Way
New Albany, IN 47150
|
1,872 sq. feet
|
1 baths 3 beds |
show details | |

|
#32
Ashbury Dr
New Albany, IN 47150
|
1,094 sq. feet
|
2 baths 3 beds |
show details | |

|
#33
Parlament Ct
Jeffersonville, IN 47130
|
1,736 sq. feet
|
2 baths 3 beds |
show details | |

|
#34
Basswood Ct
Jeffersonville, IN 47130
|
1,695 sq. feet
|
1 baths 3 beds |
show details | |

|
#35
Kahl Ct
Sellersburg, IN 47172
|
783 sq. feet
|
1 baths 2 beds |
show details | |

|
#36
Buck Creek Rd
Floyds Knobs, IN 47119
|
896 sq. feet
|
1 baths 3 beds |
show details | |

|
#37
Mctavish Dr
Clarksville, IN 47129
|
832 sq. feet
|
1 baths 2 beds |
show details | |

|
#38
Fairway Dr
Mount Washington, KY 40047
|
1,630 sq. feet
|
2 baths 3 beds |
show details | |

|
#39
Adrienne Way
Louisville, KY 40216
|
1,000 sq. feet
|
1 baths - beds |
show details | |

|
#40
Woodruff Ave
Louisville, KY 40215
|
809 sq. feet
|
1 baths - beds |
show details |
| Photo | Address | Area | Beds / Baths | Price | Details |
|---|---|---|---|---|---|

|
#41
Corydon Ridge Rd
Georgetown, IN 47122
|
3,566 sq. feet
|
1 baths 4 beds |
show details | |

|
#42
N 2nd St
Jeffersonville, IN 47130
|
1,014 sq. feet
|
1 baths 2 beds |
show details | |

|
#43
Northaven Dr
Jeffersonville, IN 47130
|
2,814 sq. feet
|
1 baths 3 beds |
show details | |

|
#44
Pennwood Dr
New Albany, IN 47150
|
2,372 sq. feet
|
2 baths 4 beds |
show details | |

|
#45
Senate Ave
Jeffersonville, IN 47130
|
1,073 sq. feet
|
1 baths 3 beds |
show details | |

|
#46
Bishop Rd
Jeffersonville, IN 47130
|
2,772 sq. feet
|
1 baths 3 beds |
show details | |

|
#47
Silverwood Dr
Clarksville, IN 47129
|
1,225 sq. feet
|
1 baths 3 beds |
show details | |

|
#48
Larch Dr
Clarksville, IN 47129
|
1,350 sq. feet
|
1 baths 3 beds |
show details | |

|
#49
Zurschmeide Dr
New Albany, IN 47150
|
988 sq. feet
|
1 baths 3 beds |
show details | |

|
Check over 1 million property listings on Foreclosure.com!
|
browse all offers | |||


Median year apartment built: 1946
Household type by relationship:
Households: 460- Male householders: 75 (12 living alone), Female householders: 103 (23 living alone)
124 spouses (123 opposite-sex spouses), 0 unmarried partners, (0 opposite-sex unmarried partners), 144 children (134 natural, 5 adopted, 3 stepchildren), 6 grandchildren, 0 brothers or sisters, 0 parents, 0 foster children, 0 other relatives, 4 non-relatives
Size of family households: 83 2-persons, 15 3-persons, 28 4-persons, 14 5-persons, 1 6-persons.
Size of nonfamily households: 38 1-person.
103 married couples with children.
5 single-parent households (0 men, 5 women).
96.7% of residents of Norbourne Estates speak English at home.
0.2% of residents speak Spanish at home (100% speak English very well).
1.9% of residents speak other Indo-European language at home (100% speak English very well).
1.0% of residents speak Asian or Pacific Island language at home (100% speak English very well).
0.2% of residents speak other language at home (100% speak English very well).
Foreign born population: 7 (1.5%)
(71.4% of them are naturalized citizens)
| Here: | 8.0 |
| State: | 6.4 |
| Here: | 8.0 |
| State: | 4.4 |

- Bedrooms in owner-occupied houses and condos in Norbourne Estates, Kentucky
- 0no bedroom
- 01 bedroom
- 22 bedrooms
- 823 bedrooms
- 814 bedrooms
- 135+ bedrooms

- Bedrooms in renter-occupied apartments in Norbourne Estates, Kentucky
- 0no bedroom
- 01 bedroom
- 42 bedrooms
- 23 bedrooms
- 04 bedrooms
- 05+ bedrooms

- Cars and other vehicles available in Norbourne Estates in owner-occupied houses/condos
- 1no vehicle
- 351 vehicle
- 992 vehicles
- 273 vehicles
- 144 vehicles
- 35+ vehicles

- Cars and other vehicles available in Norbourne Estates in renter-occupied apartments
- 0no vehicle
- 21 vehicle
- 42 vehicles
- 03 vehicles
- 04 vehicles
- 05+ vehicles

- Rooms in owner-occupied houses in Norbourne Estates, Kentucky
- 01 room
- 02 rooms
- 03 rooms
- 24 rooms
- 55 rooms
- 236 rooms
- 347 rooms
- 558 rooms
- 619+ rooms

- Rooms in renter-occupied apartments in Norbourne Estates, Kentucky
- 01 room
- 02 rooms
- 03 rooms
- 04 rooms
- 05 rooms
- 26 rooms
- 07 rooms
- 28 rooms
- 29+ rooms


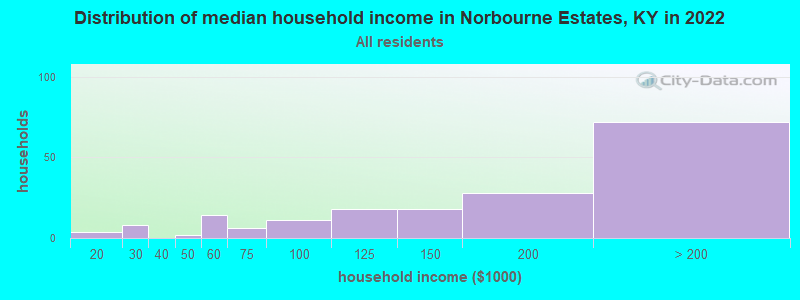
Norbourne Estates, KY household income distribution

- 4$10,000 to $19,999
- 8$20,000 to $29,999
- 2$40,000 to $49,999
- 14$50,000 to $59,999
- 6$60,000 to $74,999
- 11$75,000 to $99,999
- 18$100,000 to $124,999
- 18$125,000 to $149,999
- 28$150,000 to $199,999
- 72$200,000 or more
Home value of owner - occupied houses in 2022 in Norbourne Estates, KY
-
- 2$200,000 to $249,999
- 1$250,000 to $299,999
- 25$300,000 to $399,999
- 41$400,000 to $499,999
- 79$500,000 to $749,999
- 46$750,000 to $999,999
- 7$1,000,000 to $1,499,999
- 0$2,000,000 or more

Rent paid by renters in 2022 in Norbourne Estates, KY
-
- 6$1,500 to $1,999
- 2No cash rent


Percentage of workers working in this county: 85.8%
Number of people working at home: 37 (17.5% of all workers)
Travel time to work (commute)
- Less than 5 minutes: 12
- 5 to 9 minutes: 44
- 10 to 14 minutes: 20
- 15 to 19 minutes: 45
- 20 to 24 minutes: 25
- 25 to 29 minutes: 4
- 30 to 34 minutes: 17
- 35 to 39 minutes: 0
- 40 to 44 minutes: 1
- 45 to 59 minutes: 1
- 60 to 89 minutes: 0
- 90 or more minutes: 4
Means of transportation to work:
- Drove a car alone: 237 (94.8%)
- Carpooled: 9 (3.6%)
- Walked: 1 (0.4%)
- Worked at home: 3 (1.2%)

- Unemployment by race in 2022
- Unemployment rate for White non-Hispanic residents
- 3.1%Females

- Year of entry for the foreign-born population in Norbourne Estates, Kentucky
- 02010 or later
- 42000 to 2009
- 01990 to 1999
- 21980 to 1989
- 01970 to 1979
- 2Before 1970

First ancestries reported:
- English: 54 (24.1%)
- German: 50 (22.3%)
- Italian: 30 (13.4%)
- American: 25 (11.2%)
- Irish: 25 (11.2%)
- French: 8 (3.6%)
- Swiss: 4 (1.8%)
- Alsatian: 3 (1.3%)
- European: 3 (1.3%)
- Arab: 1 (0.4%)
- Pennsylvania German: 1 (0.4%)
- Scottish: 1 (0.4%)
Most common places of birth for foreign-born residents (%):
| Norbourne Estates: | 37.5% (3) |
| Kentucky: | 2.9% (5,302) |
Place of birth for U.S.-born residents:
- This state: 288
- Other state: 166
- Northeast: 26
- Midwest: 66
- South: 46
- West: 26
87.0% of Norbourne Estates residents lived in the same house 1 years ago.
Out of people who lived in different houses, 40.4% lived in this county.
Out of people who lived in different counties, 0.0% lived in Kentucky.
| Norbourne Estates: | 87.0% |
| State average: | 87.2% |
Education attainment for males 25 years and older:
- No schooling: 0
- Nursery to 4th grade: 0
- 5th and 6th grade: 0
- 7th and 8th grade: 0
- 9th grade: 0
- 10th grade: 0
- 11th grade: 0
- 12th grade, no diploma: 0
- High school graduate (or equivalency): 6
- Less than 1 year of college: 2
- Some college more than 1 year, no degree: 0
- Associate degree: 1
- Bachelor's degree: 71
- Master's degree: 27
- Professional school degree: 38
- Doctorate degree: 11

Education attainment for females 25 years and older:
- No schooling: 0
- Nursery to 4th grade: 0
- 5th and 6th grade: 0
- 7th and 8th grade: 0
- 9th grade: 0
- 10th grade: 0
- 11th grade: 0
- 12th grade, no diploma: 0
- High school graduate (or equivalency): 5
- Less than 1 year of college: 5
- Some college more than 1 year, no degree: 15
- Associate degree: 9
- Bachelor's degree: 58
- Master's degree: 45
- Professional school degree: 39
- Doctorate degree: 4


Housing units in structures:
- One, detached: 182
House/condo owner moved in on average 14 years ago
Renter moved in on average 8 years ago


- 83.3%Utility gas
- 16.1%Electricity
- 0.6%Bottled, tank, or LP gas

- 83.3%Utility gas
- 16.7%Electricity
Private vs. public school enrollment:
| Here: | 100.0% |
| Kentucky: | 17.2% |
| Here: | 88.9% |
| Kentucky: | 15.2% |
| Here: | 30.0% |
| Kentucky: | 19.6% |


