Jump to a detailed profile or search site with Google Custom Search

Norco, CA (California) Houses and Residents

Estimated median house or condo value in 2022: $819,722 (it was $207,800 in 2000)
Norco:

$819,722
California:

$715,900
Lower value quartile - upper value quartile: $681,440 - $949,994

Total population: 26,959 (Urban population: 23,797, Rural population: 0)

Houses: 7,414 (7,067 occupied: 5,884 owner occupied, 1,231 renter occupied)

% of renters here:

17%
State:

44%

Housing density: 526 houses/condos per square mile

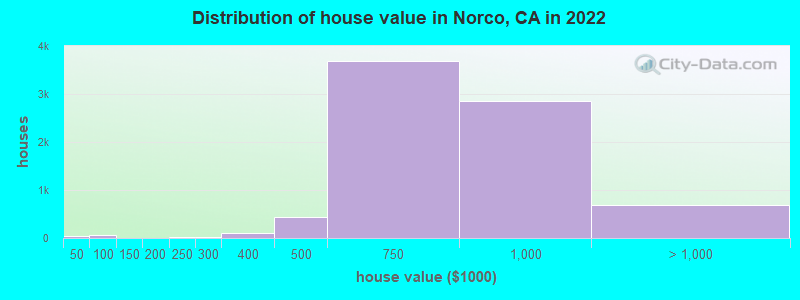
Median price asked for vacant for-sale houses and condos in 2022: $696,531.

Median contract rent in 2022: $1,719 (lower quartile is $1,066, upper quartile is over $2,000)


Median rent asked for vacant for-rent units in 2022: $856


Median gross rent in Norco, CA in 2022: $1,941

Housing units in Norco with a mortgage: 4,516 (405 second mortgage, 12 home equity loan, 354 both second mortgage and home equity loan)
Houses without a mortgage: 18

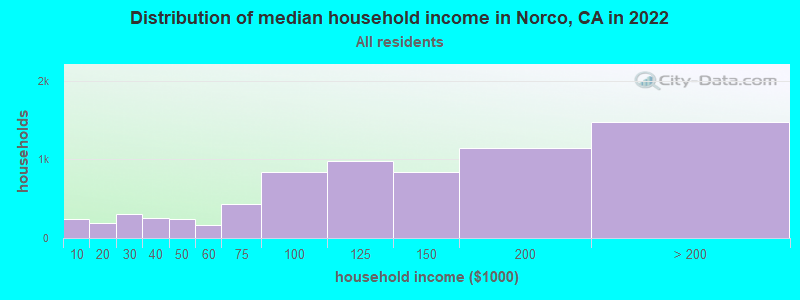
Median household income for houses/condos with a mortgage: $143,459

Median household income for apartments without a mortgage: $86,527

Median monthly housing costs: $2,314

Compare current foreclosures near Norco, CA:

Check out more offers near Norco, CA.
Powered by Foreclosure.com

Settings
X
Data:
Loading data...
Based on 2000-2022 data
Loading data...

123
Hide US histogram

Latest news about housing in Norco, CA collected exclusively by city-data.com from local newspapers, TV, and radio stations

Norco, California Age and Sex of Residents
Median year house/condo built: 1974

Median year apartment built: 1971

Household type by relationship:

Households: 25,791
  • Male householders: 3,813 (435 living alone), Female householders: 3,248 (504 living alone)
  • 4,725 spouses (4,626 opposite-sex spouses), 510 unmarried partners, (510 opposite-sex unmarried partners), 7,246 children (6,803 natural, 104 adopted, 338 stepchildren), 603 grandchildren, 473 brothers or sisters, 906 parents, 0 foster children, 1,011 other relatives, 558 non-relatives
  • In group quarters: 2,694

Size of family households: 2,026 2-persons, 1,500 3-persons, 1,072 4-persons, 781 5-persons, 310 6-persons, 228 7-or-more-persons.

Size of nonfamily households: 911 1-person, 294 2-persons, 13 3-persons, 8 4-persons.

2,997 married couples with children.
716 single-parent households (396 men, 320 women).

69.6% of residents of Norco speak English at home.
26.5% of residents speak Spanish at home (75% speak English very well, 12% speak English well, 9% speak English not well, 4% don't speak English at all).
0.9% of residents speak other Indo-European language at home (87% speak English very well, 9% speak English well, 3% speak English not well).
2.5% of residents speak Asian or Pacific Island language at home (46% speak English very well, 33% speak English well, 16% speak English not well, 5% don't speak English at all).
0.2% of residents speak other language at home (87% speak English very well, 13% speak English well).

Foreign born population: 3,392 (13.2%)
(56.9% of them are naturalized citizens)

Median number of rooms in houses and condos:
Here:

6.8
State:

6.0

Median number of rooms in apartments
Here:

5.3
State:

3.9

Owner-occupied Renter-occupied
Bedrooms in owner-occupied houses and condos in Norco, California
  • Bedrooms in owner-occupied houses and condos in Norco, California
  • 47no bedroom
  • 541 bedroom
  • 4162 bedrooms
  • 2,0993 bedrooms
  • 2,1914 bedrooms
  • 1,0775+ bedrooms
Bedrooms in renter-occupied apartments in Norco, California
  • Bedrooms in renter-occupied apartments in Norco, California
  • 30no bedroom
  • 2701 bedroom
  • 1982 bedrooms
  • 5043 bedrooms
  • 1894 bedrooms
  • 415+ bedrooms
Owner-occupied Renter-occupied
Cars and other vehicles available in Norco in owner-occupied houses/condos
  • Cars and other vehicles available in Norco in owner-occupied houses/condos
  • 47no vehicle
  • 6661 vehicle
  • 1,7732 vehicles
  • 1,7343 vehicles
  • 9734 vehicles
  • 6925+ vehicles
Cars and other vehicles available in Norco in renter-occupied apartments
  • Cars and other vehicles available in Norco in renter-occupied apartments
  • 74no vehicle
  • 2821 vehicle
  • 4832 vehicles
  • 1803 vehicles
  • 1674 vehicles
  • 455+ vehicles
Owner-occupied Renter-occupied
Rooms in owner-occupied houses in Norco, California
  • Rooms in owner-occupied houses in Norco, California
  • 411 room
  • 72 rooms
  • 953 rooms
  • 3334 rooms
  • 6195 rooms
  • 1,3496 rooms
  • 1,2127 rooms
  • 9338 rooms
  • 1,2959+ rooms
Rooms in renter-occupied apartments in Norco, California
  • Rooms in renter-occupied apartments in Norco, California
  • 221 room
  • 962 rooms
  • 1373 rooms
  • 1924 rooms
  • 2065 rooms
  • 3166 rooms
  • 1257 rooms
  • 868 rooms
  • 509+ rooms
Year house built
Median 2022 house/condo value by year built
Median house/condo value by year householder moved into unit
Breakdown of mean house values by ages of householders
  • Norco, CA household income distribution

  • Distribution of median household income in Norco, CA in 2022
  • 246Less than $10,000
  • 191$10,000 to $19,999
  • 310$20,000 to $29,999
  • 252$30,000 to $39,999
  • 247$40,000 to $49,999
  • 169$50,000 to $59,999
  • 429$60,000 to $74,999
  • 843$75,000 to $99,999
  • 985$100,000 to $124,999
  • 845$125,000 to $149,999
  • 1,151$150,000 to $199,999
  • 1,476$200,000 or more
  • Home value of owner - occupied houses in 2022 in Norco, CA

  • Distribution of house value in Norco, CA in 2022
  • 29Less than $10,000
  • 21$40,000 to $49,999
  • 9$50,000 to $59,999
  • 7$60,000 to $69,999
  • 9$70,000 to $79,999
  • 7$90,000 to $99,999
  • 4$100,000 to $124,999
  • 13$200,000 to $249,999
  • 13$250,000 to $299,999
  • 106$300,000 to $399,999
  • 434$400,000 to $499,999
  • 3,690$500,000 to $749,999
  • 2,864$750,000 to $999,999
  • 541$1,000,000 to $1,499,999
  • 102$1,500,000 to $1,999,999
  • 42$2,000,000 or more
  • Rent paid by renters in 2022 in Norco, CA

  • Distribution of rent paid by renters in Norco, CA in 2022
  • 18Less than $100
  • 5$250 to $299
  • 28$350 to $399
  • 14$400 to $449
  • 2$450 to $499
  • 91$800 to $899
  • 100$900 to $999
  • 51$1,000 to $1,249
  • 122$1,250 to $1,499
  • 292$1,500 to $1,999
  • 180$2,000 to $2,499
  • 177$2,500 to $2,999
  • 35$3,000 to $3,499
  • 34$3,500 or more
  • 109No cash rent
Time Leaving Home To Go To Work in 2022

Percentage of workers working in this county: 63.1%
Number of people working at home: 1,598 (13.2% of all workers)

Travel time (in minutes) to work in 2022

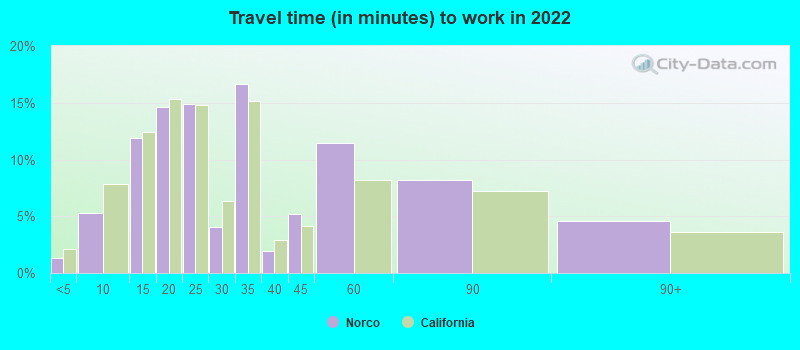
Travel time to work (commute)

  • Less than 5 minutes: 325
  • 5 to 9 minutes: 656
  • 10 to 14 minutes: 1,082
  • 15 to 19 minutes: 1,434
  • 20 to 24 minutes: 1,254
  • 25 to 29 minutes: 345
  • 30 to 34 minutes: 1,398
  • 35 to 39 minutes: 430
  • 40 to 44 minutes: 690
  • 45 to 59 minutes: 941
  • 60 to 89 minutes: 1,339
  • 90 or more minutes: 615
Means of transportation to work in 2022 - Norco

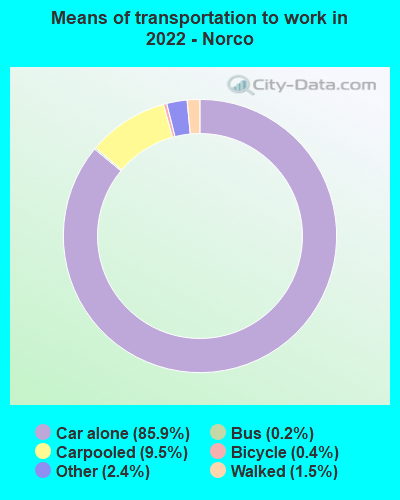
Means of transportation to work:

  • Drove a car alone: 14,480 (76.8%)
  • Carpooled: 1,743 (9.2%)
  • Bus: 27 (0.1%)
  • Light rail, streetcar or trolley: 12 (0.1%)
  • Taxi: 419 (2.2%)
  • Bicycle: 106 (0.6%)
  • Walked: 246 (1.3%)
  • Worked at home: 1,598 (8.5%)
Class of Workers in 2022
  • Unemployment by race in 2022
  • Unemployment rate for White non-Hispanic residents
  • 1.8%Males
  • 2.6%Females
  • Unemployment rate for Asian residents
  • 4.3%Males
  • Unemployment rate for other race residents
  • 3.4%Males
  • 5.6%Females
  • Unemployment rate for two or more race residents
  • 1.4%Males
  • 7.0%Females
  • Unemployment rate for Hispanic or Latino residents
  • 2.3%Males
  • 5.6%Females
Year of entry for the foreign-born population in Norco, California
  • Year of entry for the foreign-born population in Norco, California
  • 2592010 or later
  • 7912000 to 2009
  • 5121990 to 1999
  • 1941980 to 1989
  • 4541970 to 1979
  • 658Before 1970
Ancestries in Norco, CA

First ancestries reported:

  • English: 1,277 (8.2%)
  • German: 665 (4.2%)
  • American: 595 (3.8%)
  • European: 593 (3.8%)
  • Irish: 469 (3.0%)
  • Italian: 447 (2.9%)
  • Polish: 210 (1.3%)
  • Dutch: 205 (1.3%)
  • French: 118 (0.8%)
  • Swedish: 107 (0.7%)
  • Scottish: 102 (0.7%)
  • Norwegian: 73 (0.5%)
  • Scotch-Irish: 63 (0.4%)
  • Scandinavian: 59 (0.4%)
  • Canadian: 58 (0.4%)
  • Russian: 48 (0.3%)
  • Danish: 44 (0.3%)
  • African: 44 (0.3%)
  • Portuguese: 35 (0.2%)
  • Eastern European: 31 (0.2%)
  • Finnish: 27 (0.2%)
  • Hungarian: 24 (0.2%)
  • Slovak: 18 (0.1%)
  • Lebanese: 14 (0.09%)
  • Austrian: 13 (0.08%)
  • Ethiopian: 12 (0.08%)
  • French Canadian: 8 (0.05%)
  • Ukrainian: 7 (0.04%)
  • Yugoslavian: 7 (0.04%)
  • British: 6 (0.04%)
  • Iraqi: 6 (0.04%)
  • Northern European: 5 (0.03%)
  • Armenian: 5 (0.03%)
  • Greek: 5 (0.03%)
  • Jamaican: 5 (0.03%)
  • Welsh: 3 (0.02%)
  • Czechoslovakian: 2 (0.01%)
  • Guyanese: 2 (0.01%)

Most common places of birth for foreign-born residents (%):

Mexico
Norco:

62.5% (2,121)
California:

37.2% (3,881,193)

Philippines
Norco:

4.8% (164)
California:

7.8% (818,297)

Colombia
Norco:

4.2% (141)
California:

0.5% (55,249)

El Salvador
Norco:

3.0% (103)
California:

4.2% (440,287)

Nicaragua
Norco:

2.7% (92)
California:

0.6% (58,161)

Korea
Norco:

2.5% (84)
California:

3.0% (315,248)

Guatemala
Norco:

1.7% (58)
California:

2.8% (290,436)

Taiwan
Norco:

1.6% (55)
California:

1.7% (176,274)

Place of birth for U.S.-born residents:

  • This state: 18,288
  • Other state: 3,893
  • Northeast: 694
  • Midwest: 1,196
  • South: 883
  • West: 1,116

88.1% of Norco residents lived in the same house 1 years ago.
   Out of people who lived in different houses, 28.0% lived in this county.
   Out of people who lived in different counties, 95.7% lived in California.


Norco:

88.1%
State average:

88.9%

Education attainment for males 25 years and older:

  • No schooling: 291
  • Nursery to 4th grade: 56
  • 5th and 6th grade: 162
  • 7th and 8th grade: 119
  • 9th grade: 278
  • 10th grade: 193
  • 11th grade: 284
  • 12th grade, no diploma: 324
  • High school graduate (or equivalency): 3,612
  • Less than 1 year of college: 904
  • Some college more than 1 year, no degree: 1,589
  • Associate degree: 860
  • Bachelor's degree: 1,302
  • Master's degree: 391
  • Professional school degree: 102
  • Doctorate degree: 72
Educational Attainment for Males

Education attainment for females 25 years and older:

  • No schooling: 116
  • Nursery to 4th grade: 113
  • 5th and 6th grade: 83
  • 7th and 8th grade: 60
  • 9th grade: 16
  • 10th grade: 51
  • 11th grade: 140
  • 12th grade, no diploma: 265
  • High school graduate (or equivalency): 2,535
  • Less than 1 year of college: 728
  • Some college more than 1 year, no degree: 1,284
  • Associate degree: 842
  • Bachelor's degree: 1,523
  • Master's degree: 672
  • Professional school degree: 61
  • Doctorate degree: 20
Educational Attainment for Females
Norco marital status for males
Norco marital status for females

Housing units in structures:

  • One, detached: 7,048
  • One, attached: 136
  • Two: 21
  • 3 or 4: 32
  • 5 to 9: 29
  • 10 to 19: 14
  • 20 to 49: 76
  • 50 or more: 55
Housing units lacking complete plumbing facilities in 2022: 0.8%

Housing units lacking complete kitchen facilities in 2022: 3.2%

House/condo owner moved in on average 15 years ago

Renter moved in on average 5 years ago

Year householders moved into residence in Norco
Houses and condos Apartments
Most commonly used house heating fuel in houses and condos in Norco, CA
  • 87.0%Utility gas
  • 10.9%Electricity
  • 0.8%Solar energy
  • 0.4%Other fuel
  • 0.3%Coal or coke
  • 0.2%Wood
  • 0.2%Bottled, tank, or LP gas
  • 0.2%No fuel used
Most commonly used house heating fuel in apartments in Norco, CA
  • 69.4%Utility gas
  • 25.5%Electricity
  • 2.2%Bottled, tank, or LP gas
  • 2.1%Other fuel
  • 0.7%No fuel used

Private vs. public school enrollment:

Students in private schools in grades 1 to 8 (elementary and middle school): 190
Here:

8.4%
California:

10.5%

Students in private schools in grades 9 to 12 (high school): 58
Here:

4.1%
California:

8.5%

Students in private undergraduate colleges: 157
Here:

9.5%
California:

15.9%
School Enrollment by Level of School for Male Students
School Enrollment by Level of School for Female Students
Age and Sex of Sensory-Disabled Noninstitutionalized Residents
Age and Sex of Physically-Disabled Noninstitutionalized Residents
Age and Sex of Mentally-Disabled Noninstitutionalized Residents
Age and Sex of Self-Care Disabled Noninstitutionalized Residents
Age and Sex of Go-Outside-Home Disabled Noninstitutionalized Residents
Age and Sex of Noninstitutionalized Residents with Employment Disability