Norfolk, VA (Virginia) Houses and Residents
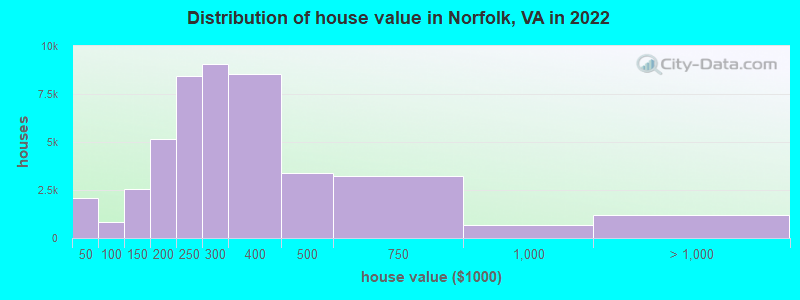
Estimated median house or condo value in 2022: $269,500 (it was $88,300 in 2000 )
Norfolk:
$269,500Virginia:
$365,700
Lower value quartile - upper value quartile: $204,100 - $367,200Mean price in 2022: Detached houses: $337,508 Here:
$337,508State:
$472,865
Townhouses or other attached units: $343,953 Here:
$343,953State:
$457,437
In 2-unit structures: $874,988 Here:
$874,988State:
$396,289
In 3-to-4-unit structures: $195,271 Here:
$195,271State:
$252,346
In 5-or-more-unit structures: $184,853 Here:
$184,853State:
$382,551
Mobile homes: $39,966 Here:
$39,966State:
$100,736
Total population: 245,428 (Urban population: 234,403, Rural population: 0)
Houses: 103,573 (94,532 occupied: 45,153 owner occupied, 49,379 renter occupied )
% of renters here:
52%State:
33%
Housing density: 1,928 houses/condos per square mile
Median price asked for vacant for-sale houses and condos in 2022: $377,655.
Median contract rent in 2022: $1,035 (lower quartile is $791, upper quartile is $1,432)
Median rent asked for vacant for-rent units in 2022: $1,587
Median gross rent in Norfolk, VA in 2022: $1,224
Housing units in Norfolk with a mortgage: 31,601 (3,516 second mortgage, 79 home equity loan, 2,652 both second mortgage and home equity loan )Houses without a mortgage: 506
Median household income for houses/condos with a mortgage: $98,965
Median household income for apartments without a mortgage: $76,638
Median monthly housing costs: $1,292
Data:
Median house or condo value ($)
Median house or condo value ($ change since 2000)
Median house or condo value ($) - White
Median house or condo value ($) - Black or African American
Median house or condo value ($) - Asian
Median house or condo value ($) - Hispanic or Latino
Median house or condo value ($) - American Indian and Alaska Native
Median house or condo value ($) - Multirace
Median house or condo value ($) - Other Race
Median price asked for mobile homes ($)
Household density (households per square mile)
Mean house or condo value by units in structure - 1, detached ($)
Mean house or condo value by units in structure - 1, attached ($)
Mean house or condo value by units in structure - 2 ($)
Mean house or condo value by units in structure by units in structure - 3 or 4 ($)
Mean house or condo value by units in structure - 5 or more ($)
Mean house or condo value by units in structure - Boat, RV, van, etc. ($)
Mean house or condo value by units in structure - Mobile home ($)
Median contract rent ($)
Median contract rent - Lower quartile ($)
Median contract rent - Upper quartile ($)
Median gross rent ($)
Urban houses (%)
Rural houses (%)
Houses occupied (%)
Houses occupied (% change since 2000)
Houses owner occupied (%)
Houses owner occupied (% change since 2000)
Houses renter occupied (%)
Houses renter occupied (% change since 2000)
Vacant housing units - For rent (%)
Vacant housing units - For rent (% change since 2000)
Vacant housing units - For sale only (%)
Vacant housing units - For sale only (% change since 2000)
Vacant housing units - Rented or sold, not occupied (%)
Vacant housing units - Rented or sold, not occupied (% change since 2000)
Vacant housing units - For seasonal, recreational, or occasional use (%)
Vacant housing units - For seasonal, recreational, or occasional use (% change since 2000)
Vacant housing units - For migrant workers (%)
Vacant housing units - For migrant workers (% change since 2000)
Vacant housing units - Other vacant (%)
Vacant housing units - Other vacant (% change since 2000)
Median monthly housing costs ($)
Median household income for houses/condos with a mortgage ($)
Median household income for houses/condos without a mortgage ($)
Median household income ($)
Median household income ($) - White
Median household income ($) - Black or African American
Median household income ($) - Asian
Median household income ($) - Hispanic or Latino
Median household income ($) - American Indian and Alaska Native
Median household income ($) - Multirace
Median household income ($) - Other Race
Mortgage status - with mortgage (%)
Mortgage status - with second mortgage (%)
Mortgage status - with home equity loan (%)
Mortgage status - with both second mortgage and home equity loan (%)
Mortgage status - without a mortgage (%)
Median year house/condo built
Median year apartment built
Household type by relationship - Male householder living alone (%)
Household type by relationship - Male householder not living alone (%)
Household type by relationship - Female householder living alone (%)
Household type by relationship - Female householder not living alone (%)
Household type by relationship - Opposite-Sex spouse (%)
Household type by relationship - Same-Sex spouse (%)
Household type by relationship - Opposite-Sex unmarried partner (%)
Household type by relationship - Same-Sex unmarried partner (%)
Household type by relationship - In group quarters (%)
Size of family households - 2-person household (%)
Size of family households - 3-person household (%)
Size of family households - 4-person household (%)
Size of family households - 5-person household (%)
Size of family households - 6-person household (%)
Size of family households - 7-or-more-person household (%)
Size of nonfamily households - 1-person household (%)
Size of nonfamily households - 2-person household (%)
Size of nonfamily households - 3-person household (%)
Size of nonfamily households - 4-person household (%)
Size of nonfamily households - 5-person household (%)
Size of nonfamily households - 6-person household (%)
Size of nonfamily households - 7-or-moreperson household (%)
Year house built - Built 2010 or later (%)
Year house built - Built 2000 to 2009 (%)
Year house built - Built 1990 to 1999 (%)
Year house built - Built 1980 to 1989 (%)
Year house built - Built 1970 to 1979 (%)
Year house built - Built 1960 to 1969 (%)
Year house built - Built 1950 to 1959 (%)
Year house built - Built 1940 to 1949 (%)
Year house built - Built 1939 or earlier (%)
Median number of rooms in houses and condos
Median number of rooms in apartments
Median number of bedrooms in owner occupied houses
Mean number of bedrooms in owner occupied houses
Median number of bedrooms in renter occupied houses
Mean number of bedrooms in renter occupied houses
Median number of vehichles in owner occupied houses
Mean number of vehichles in owner occupied houses
Median number of vehichles in renter occupied houses
Mean number of vehichles in renter occupied houses
Rooms in owner-occupied houses - 1 room (%)
Rooms in owner-occupied houses - 2 rooms (%)
Rooms in owner-occupied houses - 3 rooms (%)
Rooms in owner-occupied houses - 4 rooms (%)
Rooms in owner-occupied houses - 5 rooms (%)
Rooms in owner-occupied houses - 6 rooms (%)
Rooms in owner-occupied houses - 7 rooms (%)
Rooms in owner-occupied houses - 8 rooms (%)
Rooms in owner-occupied houses - 9+ rooms (%)
Rooms in renter-occupied houses - 1 room (%)
Rooms in renter-occupied houses - 2 rooms (%)
Rooms in renter-occupied houses - 3 rooms (%)
Rooms in renter-occupied houses - 4 rooms (%)
Rooms in renter-occupied houses - 5 rooms (%)
Rooms in renter-occupied houses - 6 rooms (%)
Rooms in renter-occupied houses - 7 rooms (%)
Rooms in renter-occupied houses - 8 rooms (%)
Rooms in renter-occupied houses - 9+ rooms (%)
Bedrooms in owner-occupied houses - no bedrooms (%)
Bedrooms in owner-occupied houses - 1 bedroom (%)
Bedrooms in owner-occupied houses - 2 bedrooms (%)
Bedrooms in owner-occupied houses - 3 bedrooms (%)
Bedrooms in owner-occupied houses - 4 bedrooms (%)
Bedrooms in owner-occupied houses - 5+ bedrooms (%)
Bedrooms in renter-occupied houses - no bedrooms (%)
Bedrooms in renter-occupied houses - 1 bedroom (%)
Bedrooms in renter-occupied houses - 2 bedrooms (%)
Bedrooms in renter-occupied houses - 3 bedrooms (%)
Bedrooms in renter-occupied houses - 4 bedrooms (%)
Bedrooms in renter-occupied houses - 5+ bedrooms (%)
Vehicles available in owner-occupied houses - no vehicle available (%)
Vehicles available in owner-occupied houses - 1 vehicle available(%)
Vehicles available in owner-occupied houses - 2 Vehicles available (%)
Vehicles available in owner-occupied houses - 3 Vehicles available (%)
Vehicles available in owner-occupied houses - 4 Vehicles available (%)
Vehicles available in owner-occupied houses - 5+ Vehicles available (%)
Vehicles available in renter-occupied houses - no vehicle available (%)
Vehicles available in renter-occupied houses - 1 vehicle available (%)
Vehicles available in renter-occupied houses - 2 Vehicles available (%)
Vehicles available in renter-occupied houses - 3 Vehicles available (%)
Vehicles available in renter-occupied houses - 4 Vehicles available (%)
Vehicles available in renter-occupied houses - 5+ Vehicles available (%)
Housing units in structures - 1, detached (%)
Housing units in structures - 1, attached (%)
Housing units in structures - 2 (%)
Housing units in structures - 3 or 4 (%)
Housing units in structures - 5 to 9 (%)
Housing units in structures - 10 to 19 (%)
Housing units in structures - 20 to 49 (%)
Housing units in structures - 50 or more (%)
Housing units in structures - Mobile home (%)
Housing units in structures - Boat, RV, van, etc. (%)
Housing units in structures - Owners - 1, detached (%)
Housing units in structures - Owners - 1, attached (%)
Housing units in structures - Owners - 2 (%)
Housing units in structures - Owners - 3 or 4 (%)
Housing units in structures - Owners - 5 to 9 (%)
Housing units in structures - Owners - 10 to 19 (%)
Housing units in structures - Owners - 20 to 49 (%)
Housing units in structures - Owners - 50 or more (%)
Housing units in structures - Owners - Mobile home (%)
Housing units in structures - Owners - Boat, RV, van, etc. (%)
Housing units in structures - Renters - 1, detached (%)
Housing units in structures - Renters - 1, attached (%)
Housing units in structures - Renters - 2 (%)
Housing units in structures - Renters - 3 or 4 (%)
Housing units in structures - Renters - 5 to 9 (%)
Housing units in structures - Renters - 10 to 19 (%)
Housing units in structures - Renters - 20 to 49 (%)
Housing units in structures - Renters - 50 or more (%)
Housing units in structures - Renters - Mobile home (%)
Housing units in structures - Renters - Boat, RV, van, etc. (%)
House/condo owner moved in on average (years ago)
Renter moved in on average (years ago)
Year householder moved into unit - Moved in 1999 to March 2000 (%)
Year householder moved into unit - Moved in 1999 to March 2000 (%) - White
Year householder moved into unit - Moved in 1999 to March 2000 (%) - Black or African American
Year householder moved into unit - Moved in 1999 to March 2000 (%) - Asian
Year householder moved into unit - Moved in 1999 to March 2000 (%) - Hispanic or Latino
Year householder moved into unit - Moved in 1999 to March 2000 (%) - American Indian and Alaska Native
Year householder moved into unit - Moved in 1999 to March 2000 (%) - Multirace
Year householder moved into unit - Moved in 1999 to March 2000 (%) - Other Race
Year householder moved into unit - Moved in 1995 to 1998 (%)
Year householder moved into unit - Moved in 1995 to 1998 (%) - White
Year householder moved into unit - Moved in 1995 to 1998 (%) - Black or African American
Year householder moved into unit - Moved in 1995 to 1998 (%) - Asian
Year householder moved into unit - Moved in 1995 to 1998 (%) - Hispanic or Latino
Year householder moved into unit - Moved in 1995 to 1998 (%) - American Indian and Alaska Native
Year householder moved into unit - Moved in 1995 to 1998 (%) - Multirace
Year householder moved into unit - Moved in 1995 to 1998 (%) - Other Race
Year householder moved into unit - Moved in 1990 to 1994 (%)
Year householder moved into unit - Moved in 1990 to 1994 (%) - White
Year householder moved into unit - Moved in 1990 to 1994 (%) - Black or African American
Year householder moved into unit - Moved in 1990 to 1994 (%) - Asian
Year householder moved into unit - Moved in 1990 to 1994 (%) - Hispanic or Latino
Year householder moved into unit - Moved in 1990 to 1994 (%) - American Indian and Alaska Native
Year householder moved into unit - Moved in 1990 to 1994 (%) - Multirace
Year householder moved into unit - Moved in 1990 to 1994 (%) - Other Race
Year householder moved into unit - Moved in 1980 to 1989 (%)
Year householder moved into unit - Moved in 1980 to 1989 (%) - White
Year householder moved into unit - Moved in 1980 to 1989 (%) - Black or African American
Year householder moved into unit - Moved in 1980 to 1989 (%) - Asian
Year householder moved into unit - Moved in 1980 to 1989 (%) - Hispanic or Latino
Year householder moved into unit - Moved in 1980 to 1989 (%) - American Indian and Alaska Native
Year householder moved into unit - Moved in 1980 to 1989 (%) - Multirace
Year householder moved into unit - Moved in 1980 to 1989 (%) - Other Race
Year householder moved into unit - Moved in 1970 to 1979 (%)
Year householder moved into unit - Moved in 1970 to 1979 (%) - White
Year householder moved into unit - Moved in 1970 to 1979 (%) - Black or African American
Year householder moved into unit - Moved in 1970 to 1979 (%) - Asian
Year householder moved into unit - Moved in 1970 to 1979 (%) - Hispanic or Latino
Year householder moved into unit - Moved in 1970 to 1979 (%) - American Indian and Alaska Native
Year householder moved into unit - Moved in 1970 to 1979 (%) - Multirace
Year householder moved into unit - Moved in 1970 to 1979 (%) - Other Race
Year householder moved into unit - Moved in 1969 or earlier (%)
Year householder moved into unit - Moved in 1969 or earlier (%) - White
Year householder moved into unit - Moved in 1969 or earlier (%) - Black or African American
Year householder moved into unit - Moved in 1969 or earlier (%) - Asian
Year householder moved into unit - Moved in 1969 or earlier (%) - Hispanic or Latino
Year householder moved into unit - Moved in 1969 or earlier (%) - American Indian and Alaska Native
Year householder moved into unit - Moved in 1969 or earlier (%) - Multirace
Year householder moved into unit - Moved in 1969 or earlier (%) - Other Race
Housing units lacking complete plumbing facilities (%)
Housing units lacking complete kitchen facilities (%)
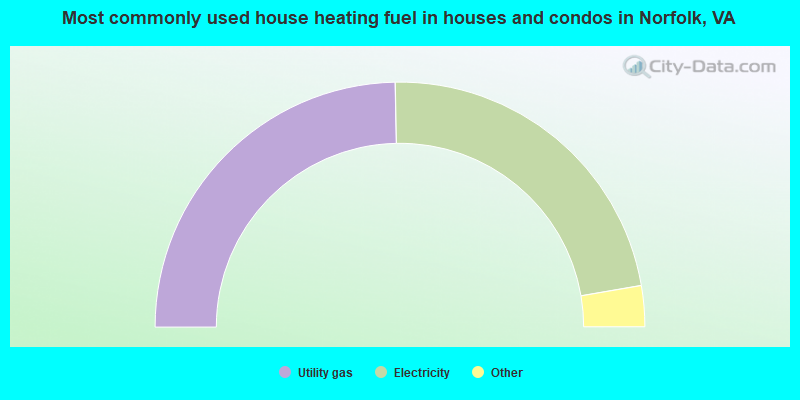
House heating fuel used in houses and condos - Utility gas (%)
House heating fuel used in houses and condos - Bottled, tank, or LP gas (%)
House heating fuel used in houses and condos - Electricity (%)
House heating fuel used in houses and condos - Fuel oil, kerosene, etc. (%)
House heating fuel used in houses and condos - Coal or coke (%)
House heating fuel used in houses and condos - Wood (%)
House heating fuel used in houses and condos - Solar energy (%)
House heating fuel used in houses and condos - Other fuel (%)
House heating fuel used in houses and condos - No fuel used (%)
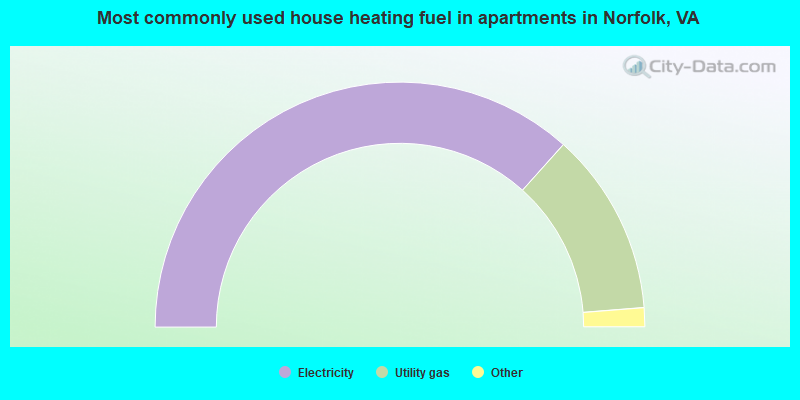
House heating fuel used in apartments - Utility gas (%)
House heating fuel used in apartments - Bottled, tank, or LP gas (%)
House heating fuel used in apartments - Electricity (%)
House heating fuel used in apartments - Fuel oil, kerosene, etc. (%)
House heating fuel used in apartments - Coal or coke (%)
House heating fuel used in apartments - Wood (%)
House heating fuel used in apartments - Solar energy (%)
House heating fuel used in apartments - Other fuel (%)
House heating fuel used in apartments - No fuel used (%)
Latest news about housing in Norfolk, VA collected exclusively by city-data.com from local newspapers, TV, and radio stations
Median year house/condo built: 1957Median year apartment built: 1973Household type by relationship:
Households: 232,995
Male householders: 42,571 (14,777 living alone ), Female householders: 51,961 (17,486 living alone )29,640 spouses (29,150 opposite-sex spouses ), 9,003 unmarried partners , (8,551 opposite-sex unmarried partners ), 57,430 children (54,048 natural , 1,458 adopted , 1,924 stepchildren ), 5,569 grandchildren , 2,969 brothers or sisters , 3,354 parents , 82 foster children , 2,883 other relatives , 10,339 non-relatives In group quarters: 17,194
Size of family households: 25,918 2-persons , 12,503 3-persons , 9,531 4-persons , 2,184 5-persons , 1,459 6-persons , 541 7-or-more-persons .
Size of nonfamily households: 32,263 1-person , 8,296 2-persons , 1,197 3-persons , 238 4-persons , 402 5-persons .
19,956 married couples with children. single-parent households (4,015 men , 16,088 women ).
88.6% of residents of Norfolk speak English at home. of residents speak Spanish at home (68% speak English very well , 13% speak English well , 12% speak English not well , 7% don't speak English at all ).of residents speak other Indo-European language at home (74% speak English very well , 19% speak English well , 6% speak English not well , 1% don't speak English at all ).of residents speak Asian or Pacific Island language at home (67% speak English very well , 27% speak English well , 5% speak English not well , 1% don't speak English at all ).of residents speak other language at home (82% speak English very well , 16% speak English well , 2% speak English not well , 1% don't speak English at all ).
Foreign born population: 15,119 (6.5%)of them are naturalized citizens )
Median number of rooms in houses and condos:
Median number of rooms in apartments
Owner-occupied Renter-occupied
Bedrooms in owner-occupied houses and condos in Norfolk, Virginia
134 no bedroom 834 1 bedroom 8,234 2 bedrooms 23,449 3 bedrooms 9,533 4 bedrooms 2,969 5+ bedrooms
Bedrooms in renter-occupied apartments in Norfolk, Virginia
1,628 no bedroom 11,747 1 bedroom 21,581 2 bedrooms 11,072 3 bedrooms 2,800 4 bedrooms 551 5+ bedrooms
Owner-occupied Renter-occupied
Rooms in owner-occupied houses in Norfolk, Virginia
60 1 room 74 2 rooms 1,387 3 rooms 3,262 4 rooms 7,612 5 rooms 9,690 6 rooms 8,591 7 rooms 5,809 8 rooms 8,668 9+ rooms
Rooms in renter-occupied apartments in Norfolk, Virginia
1,173 1 room 3,288 2 rooms 8,307 3 rooms 13,735 4 rooms 11,365 5 rooms 6,107 6 rooms 2,488 7 rooms 1,088 8 rooms 1,828 9+ rooms
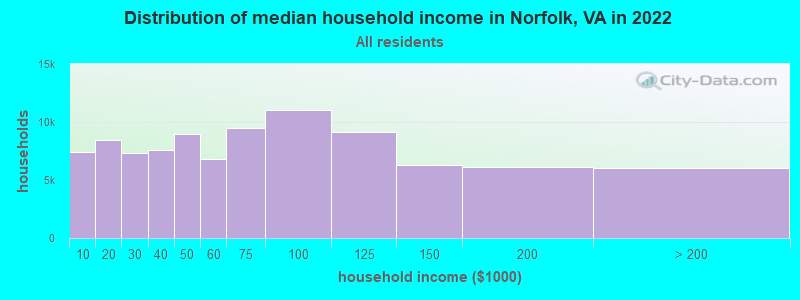
Norfolk, VA household income distribution 7,384 Less than $10,0008,439 $10,000 to $19,9997,337 $20,000 to $29,9997,569 $30,000 to $39,9998,950 $40,000 to $49,9996,779 $50,000 to $59,9999,461 $60,000 to $74,99910,998 $75,000 to $99,9999,173 $100,000 to $124,9996,256 $125,000 to $149,9996,127 $150,000 to $199,9996,059 $200,000 or more
Home value of owner - occupied houses in 2022 in Norfolk, VA 232 Less than $10,000295 $10,000 to $14,999509 $15,000 to $19,999327 $20,000 to $24,999565 $25,000 to $29,99996 $30,000 to $34,99945 $35,000 to $39,99951 $50,000 to $59,999451 $60,000 to $69,999219 $70,000 to $79,99933 $80,000 to $89,99978 $90,000 to $99,999875 $100,000 to $124,9991,663 $125,000 to $149,9992,689 $150,000 to $174,9992,464 $175,000 to $199,9998,436 $200,000 to $249,9999,086 $250,000 to $299,9998,553 $300,000 to $399,9993,407 $400,000 to $499,9993,223 $500,000 to $749,999673 $750,000 to $999,999620 $1,000,000 to $1,499,99958 $1,500,000 to $1,999,999505 $2,000,000 or moreRent paid by renters in 2022 in Norfolk, VA 633 Less than $100162 $100 to $149566 $150 to $1991,644 $200 to $249451 $250 to $299292 $300 to $349320 $350 to $399587 $400 to $44996 $450 to $499453 $500 to $549889 $550 to $5991,007 $600 to $649902 $650 to $6991,952 $700 to $7492,551 $750 to $7995,537 $800 to $8994,900 $900 to $9998,242 $1,000 to $1,2496,801 $1,250 to $1,4996,905 $1,500 to $1,9992,113 $2,000 to $2,499422 $2,500 to $2,999488 $3,000 to $3,499279 $3,500 or more1,187 No cash rent
Percentage of workers working in this county: 61.1%Number of people working at home: 9,042 (7.2% of all workers )
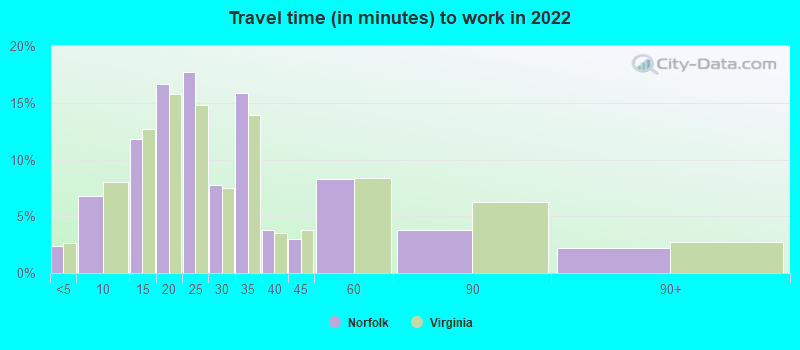
Travel time to work (commute)
Less than 5 minutes: 3,5005 to 9 minutes: 11,43210 to 14 minutes: 17,94415 to 19 minutes: 21,53920 to 24 minutes: 21,10925 to 29 minutes: 8,34330 to 34 minutes: 17,12035 to 39 minutes: 2,25740 to 44 minutes: 2,48545 to 59 minutes: 5,66760 to 89 minutes: 2,64690 or more minutes: 3,132
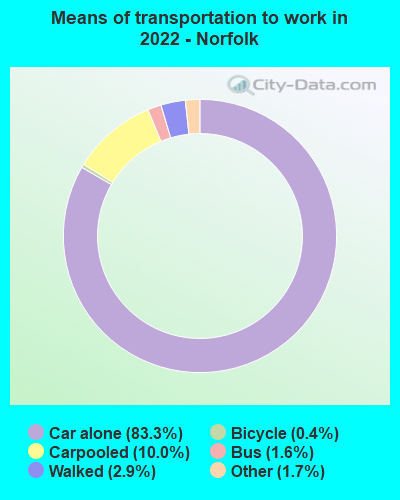
Means of transportation to work:
Drove a car alone: 139,936 (79.0%)Carpooled: 16,751 (9.5%)Bus : 2,696 (1.5%)Light rail, streetcar or trolley : 134 (0.1%)Ferryboat: 59 (0.0%)Taxi: 2,934 (1.7%)Bicycle: 727 (0.4%)Walked: 4,831 (2.7%)Worked at home: 9,042 (5.1%)
Unemployment by race in 2022
Unemployment rate for White non-Hispanic residents 3.6% Males4.2% FemalesUnemployment rate for Black residents 7.5% Males6.8% FemalesUnemployment rate for American Indian and Alaska Native residents 15.4% Males10.9% FemalesUnemployment rate for other race residents 0.7% Males5.3% FemalesUnemployment rate for two or more race residents 2.1% Males8.8% FemalesUnemployment rate for Hispanic or Latino residents 1.7% Males13.6% Females
Year of entry for the foreign-born population in Norfolk, Virginia
8,203 2010 or later 4,043 2000 to 2009 2,517 1990 to 1999 3,006 1980 to 1989 1,672 1970 to 1979 1,969 Before 1970
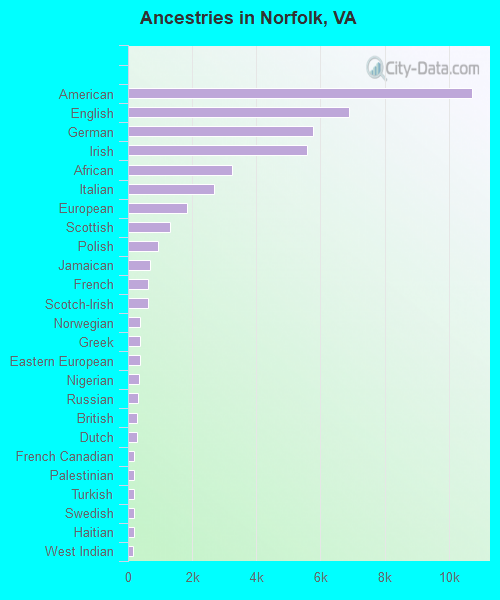
First ancestries reported:
American: 10,717 (8.1%)
English: 6,885 (5.2%)
German: 5,756 (4.4%)
Irish: 5,579 (4.2%)
African: 3,231 (2.4%)
Italian: 2,680 (2.0%)
European: 1,830 (1.4%)
Scottish: 1,311 (1.0%)
Polish: 948 (0.7%)
Jamaican: 690 (0.5%)
French: 635 (0.5%)
Scotch-Irish: 631 (0.5%)
Norwegian: 373 (0.3%)
Greek: 370 (0.3%)
Eastern European: 362 (0.3%)
Nigerian: 358 (0.3%)
Russian: 300 (0.2%)
British: 290 (0.2%)
Dutch: 266 (0.2%)
French Canadian: 199 (0.2%)
Palestinian: 182 (0.1%)
Turkish: 181 (0.1%)
Swedish: 179 (0.1%)
Haitian: 179 (0.1%)
West Indian: 171 (0.1%)
Ukrainian: 151 (0.1%)
Scandinavian: 140 (0.1%)
Welsh: 140 (0.1%)
Hungarian: 135 (0.1%)
Danish: 131 (0.10%)
Lithuanian: 121 (0.09%)
Trinidadian and Tobagonian: 120 (0.09%)
Afghan: 118 (0.09%)
Northern European: 100 (0.08%)
Ethiopian: 94 (0.07%)
Ghanaian: 91 (0.07%)
Iranian: 89 (0.07%)
Sierra Leonean: 89 (0.07%)
Guyanese: 80 (0.06%)
Belizean: 80 (0.06%)
Canadian: 77 (0.06%)
Lebanese: 69 (0.05%)
Finnish: 63 (0.05%)
Jordanian: 62 (0.05%)
Austrian: 62 (0.05%)
Pennsylvania German: 55 (0.04%)
Senegalese: 53 (0.04%)
Israeli: 52 (0.04%)
Romanian: 47 (0.04%)
Armenian: 46 (0.03%)
Swiss: 46 (0.03%)
South African: 45 (0.03%)
Slovak: 45 (0.03%)
Brazilian: 44 (0.03%)
Portuguese: 43 (0.03%)
Moroccan: 37 (0.03%)
U.S. Virgin Islander: 32 (0.02%)
Bahamian: 31 (0.02%)
Serbian: 31 (0.02%)
Liberian: 30 (0.02%)
Czech: 30 (0.02%)
Arab: 27 (0.02%)
Zimbabwean: 26 (0.02%)
Barbadian: 26 (0.02%)
Albanian: 25 (0.02%)
Australian: 24 (0.02%)
Syrian: 19 (0.01%)
Slovene: 15 (0.01%)
Czechoslovakian: 10 (0.01%)
British West Indian: 10 (0.01%)
Yugoslavian: 9 (0.01%)
Ugandan: 7 (0.01%)
Bulgarian: 7 (0.01%)
Slavic: 7 (0.01%)
Most common places of birth for foreign-born residents (%): Philippines Norfolk:
19.7% (3,487)Virginia:
4.8% (52,629)
Honduras Norfolk:
8.2% (1,461)Virginia:
3.0% (32,892)
El Salvador Norfolk:
4.5% (792)Virginia:
9.9% (107,534)
Mexico Norfolk:
3.7% (664)Virginia:
5.3% (57,498)
Jamaica Norfolk:
3.2% (571)Virginia:
1.0% (10,734)
India Norfolk:
3.1% (544)Virginia:
9.0% (97,830)
China, excluding Hong Kong and Taiwan Norfolk:
3.1% (544)Virginia:
3.9% (42,989)
Dominican Republic Norfolk:
2.9% (512)Virginia:
0.6% (6,698)
Ghana Norfolk:
2.9% (509)Virginia:
1.6% (17,346)
Nigeria Norfolk:
2.3% (411)Virginia:
0.6% (6,956)
Germany Norfolk:
2.3% (402)Virginia:
1.7% (18,227)
Canada Norfolk:
2.0% (355)Virginia:
1.2% (12,984)
Vietnam Norfolk:
2.0% (354)Virginia:
4.2% (45,750)
United Kingdom, excluding England and Scotland Norfolk:
1.9% (337)Virginia:
0.8% (8,513)
Korea Norfolk:
1.6% (290)Virginia:
4.9% (52,857)
Italy Norfolk:
1.5% (272)Virginia:
0.5% (5,147)
Place of birth for U.S.-born residents:
This state: 118,976Other state: 95,139Northeast: 24,833Midwest: 14,055South: 40,553West: 15,698 80.4% of Norfolk residents lived in the same house 1 years ago.
Out of people who lived in different houses, 26.6% lived in this county.
Out of people who lived in different counties, 56.9% lived in Virginia.
Norfolk:
80.4%State average:
86.6%
Education attainment for males 25 years and older:
No schooling: 1,503Nursery to 4th grade: 485th and 6th grade: 1307th and 8th grade: 2059th grade: 36310th grade: 87711th grade: 1,00712th grade, no diploma: 1,526High school graduate (or equivalency): 20,633Less than 1 year of college: 6,722Some college more than 1 year, no degree: 12,606Associate degree: 4,958Bachelor's degree: 12,648Master's degree: 7,205Professional school degree: 2,002Doctorate degree: 856
Education attainment for females 25 years and older:
No schooling: 715Nursery to 4th grade: 1375th and 6th grade: 2237th and 8th grade: 1,0319th grade: 48110th grade: 95511th grade: 1,93212th grade, no diploma: 1,433High school graduate (or equivalency): 17,966Less than 1 year of college: 7,253Some college more than 1 year, no degree: 11,494Associate degree: 7,623Bachelor's degree: 15,111Master's degree: 7,599Professional school degree: 1,866Doctorate degree: 934
Housing units in structures:
One, detached: 51,288One, attached: 7,358Two: 8,3423 or 4: 8,7535 to 9: 8,22810 to 19: 5,94320 to 49: 3,70350 or more: 9,138Mobile homes: 820Median worth of mobile homes: $34,489
Housing units lacking complete plumbing facilities in 2022: 1.0%Housing units lacking complete kitchen facilities in 2022: 0.9%House/condo owner moved in on average 9 years ago
Renter moved in on average 2 years ago
Private vs. public school enrollment:
Students in private schools in grades 1 to 8 (elementary and middle school): 3,364 Students in private schools in grades 9 to 12 (high school): 838 Students in private undergraduate colleges: 2,799