Normal, IL (Illinois) Houses and Residents
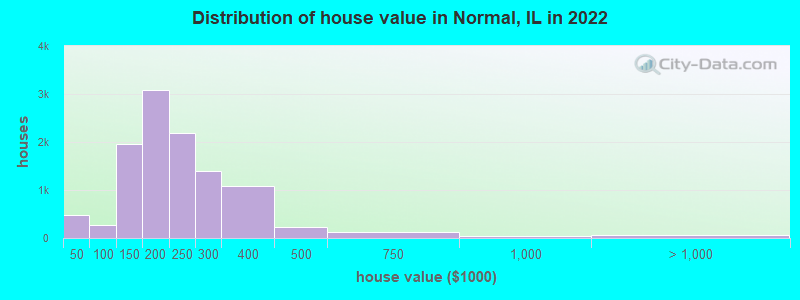
Estimated median house or condo value in 2022: $193,994 (it was $116,200 in 2000 )
Normal:
$193,994Illinois:
$251,600
Lower value quartile - upper value quartile: $153,137 - $259,310Mean price in 2022: Detached houses: $242,471 Here:
$242,471State:
$310,164
Townhouses or other attached units: $197,348 Here:
$197,348State:
$286,230
In 2-unit structures: $138,383 Here:
$138,383State:
$299,638
In 3-to-4-unit structures: $283,930 Here:
$283,930State:
$330,907
In 5-or-more-unit structures: $104,228 Here:
$104,228State:
$318,887
Mobile homes: $27,310 Here:
$27,310State:
$78,855
Total population: 54,594 (Urban population: 45,337, Rural population: 0)
Houses: 22,092 (19,782 occupied: 11,030 owner occupied, 8,739 renter occupied )
% of renters here:
44%State:
33%
Housing density: 1,622 houses/condos per square mile
Median price asked for vacant for-sale houses and condos in 2022: $78,126.
Median contract rent in 2022: $835 (lower quartile is $697, upper quartile is $1,049)
Median rent asked for vacant for-rent units in 2022: $1,413
Median gross rent in Normal, IL in 2022: $936
Housing units in Normal with a mortgage: 7,240 (608 second mortgage, 43 home equity loan, 471 both second mortgage and home equity loan )Houses without a mortgage: 73
Median household income for houses/condos with a mortgage: $108,251
Median household income for apartments without a mortgage: $80,439
Median monthly housing costs: $1,027
Data:
Median house or condo value ($)
Median house or condo value ($ change since 2000)
Median house or condo value ($) - White
Median house or condo value ($) - Black or African American
Median house or condo value ($) - Asian
Median house or condo value ($) - Hispanic or Latino
Median house or condo value ($) - American Indian and Alaska Native
Median house or condo value ($) - Multirace
Median house or condo value ($) - Other Race
Median price asked for mobile homes ($)
Household density (households per square mile)
Mean house or condo value by units in structure - 1, detached ($)
Mean house or condo value by units in structure - 1, attached ($)
Mean house or condo value by units in structure - 2 ($)
Mean house or condo value by units in structure by units in structure - 3 or 4 ($)
Mean house or condo value by units in structure - 5 or more ($)
Mean house or condo value by units in structure - Boat, RV, van, etc. ($)
Mean house or condo value by units in structure - Mobile home ($)
Median contract rent ($)
Median contract rent - Lower quartile ($)
Median contract rent - Upper quartile ($)
Median gross rent ($)
Urban houses (%)
Rural houses (%)
Houses occupied (%)
Houses occupied (% change since 2000)
Houses owner occupied (%)
Houses owner occupied (% change since 2000)
Houses renter occupied (%)
Houses renter occupied (% change since 2000)
Vacant housing units - For rent (%)
Vacant housing units - For rent (% change since 2000)
Vacant housing units - For sale only (%)
Vacant housing units - For sale only (% change since 2000)
Vacant housing units - Rented or sold, not occupied (%)
Vacant housing units - Rented or sold, not occupied (% change since 2000)
Vacant housing units - For seasonal, recreational, or occasional use (%)
Vacant housing units - For seasonal, recreational, or occasional use (% change since 2000)
Vacant housing units - For migrant workers (%)
Vacant housing units - For migrant workers (% change since 2000)
Vacant housing units - Other vacant (%)
Vacant housing units - Other vacant (% change since 2000)
Median monthly housing costs ($)
Median household income for houses/condos with a mortgage ($)
Median household income for houses/condos without a mortgage ($)
Median household income ($)
Median household income ($) - White
Median household income ($) - Black or African American
Median household income ($) - Asian
Median household income ($) - Hispanic or Latino
Median household income ($) - American Indian and Alaska Native
Median household income ($) - Multirace
Median household income ($) - Other Race
Mortgage status - with mortgage (%)
Mortgage status - with second mortgage (%)
Mortgage status - with home equity loan (%)
Mortgage status - with both second mortgage and home equity loan (%)
Mortgage status - without a mortgage (%)
Median year house/condo built
Median year apartment built
Household type by relationship - Male householder living alone (%)
Household type by relationship - Male householder not living alone (%)
Household type by relationship - Female householder living alone (%)
Household type by relationship - Female householder not living alone (%)
Household type by relationship - Opposite-Sex spouse (%)
Household type by relationship - Same-Sex spouse (%)
Household type by relationship - Opposite-Sex unmarried partner (%)
Household type by relationship - Same-Sex unmarried partner (%)
Household type by relationship - In group quarters (%)
Size of family households - 2-person household (%)
Size of family households - 3-person household (%)
Size of family households - 4-person household (%)
Size of family households - 5-person household (%)
Size of family households - 6-person household (%)
Size of family households - 7-or-more-person household (%)
Size of nonfamily households - 1-person household (%)
Size of nonfamily households - 2-person household (%)
Size of nonfamily households - 3-person household (%)
Size of nonfamily households - 4-person household (%)
Size of nonfamily households - 5-person household (%)
Size of nonfamily households - 6-person household (%)
Size of nonfamily households - 7-or-moreperson household (%)
Year house built - Built 2010 or later (%)
Year house built - Built 2000 to 2009 (%)
Year house built - Built 1990 to 1999 (%)
Year house built - Built 1980 to 1989 (%)
Year house built - Built 1970 to 1979 (%)
Year house built - Built 1960 to 1969 (%)
Year house built - Built 1950 to 1959 (%)
Year house built - Built 1940 to 1949 (%)
Year house built - Built 1939 or earlier (%)
Median number of rooms in houses and condos
Median number of rooms in apartments
Median number of bedrooms in owner occupied houses
Mean number of bedrooms in owner occupied houses
Median number of bedrooms in renter occupied houses
Mean number of bedrooms in renter occupied houses
Median number of vehichles in owner occupied houses
Mean number of vehichles in owner occupied houses
Median number of vehichles in renter occupied houses
Mean number of vehichles in renter occupied houses
Rooms in owner-occupied houses - 1 room (%)
Rooms in owner-occupied houses - 2 rooms (%)
Rooms in owner-occupied houses - 3 rooms (%)
Rooms in owner-occupied houses - 4 rooms (%)
Rooms in owner-occupied houses - 5 rooms (%)
Rooms in owner-occupied houses - 6 rooms (%)
Rooms in owner-occupied houses - 7 rooms (%)
Rooms in owner-occupied houses - 8 rooms (%)
Rooms in owner-occupied houses - 9+ rooms (%)
Rooms in renter-occupied houses - 1 room (%)
Rooms in renter-occupied houses - 2 rooms (%)
Rooms in renter-occupied houses - 3 rooms (%)
Rooms in renter-occupied houses - 4 rooms (%)
Rooms in renter-occupied houses - 5 rooms (%)
Rooms in renter-occupied houses - 6 rooms (%)
Rooms in renter-occupied houses - 7 rooms (%)
Rooms in renter-occupied houses - 8 rooms (%)
Rooms in renter-occupied houses - 9+ rooms (%)
Bedrooms in owner-occupied houses - no bedrooms (%)
Bedrooms in owner-occupied houses - 1 bedroom (%)
Bedrooms in owner-occupied houses - 2 bedrooms (%)
Bedrooms in owner-occupied houses - 3 bedrooms (%)
Bedrooms in owner-occupied houses - 4 bedrooms (%)
Bedrooms in owner-occupied houses - 5+ bedrooms (%)
Bedrooms in renter-occupied houses - no bedrooms (%)
Bedrooms in renter-occupied houses - 1 bedroom (%)
Bedrooms in renter-occupied houses - 2 bedrooms (%)
Bedrooms in renter-occupied houses - 3 bedrooms (%)
Bedrooms in renter-occupied houses - 4 bedrooms (%)
Bedrooms in renter-occupied houses - 5+ bedrooms (%)
Vehicles available in owner-occupied houses - no vehicle available (%)
Vehicles available in owner-occupied houses - 1 vehicle available(%)
Vehicles available in owner-occupied houses - 2 Vehicles available (%)
Vehicles available in owner-occupied houses - 3 Vehicles available (%)
Vehicles available in owner-occupied houses - 4 Vehicles available (%)
Vehicles available in owner-occupied houses - 5+ Vehicles available (%)
Vehicles available in renter-occupied houses - no vehicle available (%)
Vehicles available in renter-occupied houses - 1 vehicle available (%)
Vehicles available in renter-occupied houses - 2 Vehicles available (%)
Vehicles available in renter-occupied houses - 3 Vehicles available (%)
Vehicles available in renter-occupied houses - 4 Vehicles available (%)
Vehicles available in renter-occupied houses - 5+ Vehicles available (%)
Housing units in structures - 1, detached (%)
Housing units in structures - 1, attached (%)
Housing units in structures - 2 (%)
Housing units in structures - 3 or 4 (%)
Housing units in structures - 5 to 9 (%)
Housing units in structures - 10 to 19 (%)
Housing units in structures - 20 to 49 (%)
Housing units in structures - 50 or more (%)
Housing units in structures - Mobile home (%)
Housing units in structures - Boat, RV, van, etc. (%)
Housing units in structures - Owners - 1, detached (%)
Housing units in structures - Owners - 1, attached (%)
Housing units in structures - Owners - 2 (%)
Housing units in structures - Owners - 3 or 4 (%)
Housing units in structures - Owners - 5 to 9 (%)
Housing units in structures - Owners - 10 to 19 (%)
Housing units in structures - Owners - 20 to 49 (%)
Housing units in structures - Owners - 50 or more (%)
Housing units in structures - Owners - Mobile home (%)
Housing units in structures - Owners - Boat, RV, van, etc. (%)
Housing units in structures - Renters - 1, detached (%)
Housing units in structures - Renters - 1, attached (%)
Housing units in structures - Renters - 2 (%)
Housing units in structures - Renters - 3 or 4 (%)
Housing units in structures - Renters - 5 to 9 (%)
Housing units in structures - Renters - 10 to 19 (%)
Housing units in structures - Renters - 20 to 49 (%)
Housing units in structures - Renters - 50 or more (%)
Housing units in structures - Renters - Mobile home (%)
Housing units in structures - Renters - Boat, RV, van, etc. (%)
House/condo owner moved in on average (years ago)
Renter moved in on average (years ago)
Year householder moved into unit - Moved in 1999 to March 2000 (%)
Year householder moved into unit - Moved in 1999 to March 2000 (%) - White
Year householder moved into unit - Moved in 1999 to March 2000 (%) - Black or African American
Year householder moved into unit - Moved in 1999 to March 2000 (%) - Asian
Year householder moved into unit - Moved in 1999 to March 2000 (%) - Hispanic or Latino
Year householder moved into unit - Moved in 1999 to March 2000 (%) - American Indian and Alaska Native
Year householder moved into unit - Moved in 1999 to March 2000 (%) - Multirace
Year householder moved into unit - Moved in 1999 to March 2000 (%) - Other Race
Year householder moved into unit - Moved in 1995 to 1998 (%)
Year householder moved into unit - Moved in 1995 to 1998 (%) - White
Year householder moved into unit - Moved in 1995 to 1998 (%) - Black or African American
Year householder moved into unit - Moved in 1995 to 1998 (%) - Asian
Year householder moved into unit - Moved in 1995 to 1998 (%) - Hispanic or Latino
Year householder moved into unit - Moved in 1995 to 1998 (%) - American Indian and Alaska Native
Year householder moved into unit - Moved in 1995 to 1998 (%) - Multirace
Year householder moved into unit - Moved in 1995 to 1998 (%) - Other Race
Year householder moved into unit - Moved in 1990 to 1994 (%)
Year householder moved into unit - Moved in 1990 to 1994 (%) - White
Year householder moved into unit - Moved in 1990 to 1994 (%) - Black or African American
Year householder moved into unit - Moved in 1990 to 1994 (%) - Asian
Year householder moved into unit - Moved in 1990 to 1994 (%) - Hispanic or Latino
Year householder moved into unit - Moved in 1990 to 1994 (%) - American Indian and Alaska Native
Year householder moved into unit - Moved in 1990 to 1994 (%) - Multirace
Year householder moved into unit - Moved in 1990 to 1994 (%) - Other Race
Year householder moved into unit - Moved in 1980 to 1989 (%)
Year householder moved into unit - Moved in 1980 to 1989 (%) - White
Year householder moved into unit - Moved in 1980 to 1989 (%) - Black or African American
Year householder moved into unit - Moved in 1980 to 1989 (%) - Asian
Year householder moved into unit - Moved in 1980 to 1989 (%) - Hispanic or Latino
Year householder moved into unit - Moved in 1980 to 1989 (%) - American Indian and Alaska Native
Year householder moved into unit - Moved in 1980 to 1989 (%) - Multirace
Year householder moved into unit - Moved in 1980 to 1989 (%) - Other Race
Year householder moved into unit - Moved in 1970 to 1979 (%)
Year householder moved into unit - Moved in 1970 to 1979 (%) - White
Year householder moved into unit - Moved in 1970 to 1979 (%) - Black or African American
Year householder moved into unit - Moved in 1970 to 1979 (%) - Asian
Year householder moved into unit - Moved in 1970 to 1979 (%) - Hispanic or Latino
Year householder moved into unit - Moved in 1970 to 1979 (%) - American Indian and Alaska Native
Year householder moved into unit - Moved in 1970 to 1979 (%) - Multirace
Year householder moved into unit - Moved in 1970 to 1979 (%) - Other Race
Year householder moved into unit - Moved in 1969 or earlier (%)
Year householder moved into unit - Moved in 1969 or earlier (%) - White
Year householder moved into unit - Moved in 1969 or earlier (%) - Black or African American
Year householder moved into unit - Moved in 1969 or earlier (%) - Asian
Year householder moved into unit - Moved in 1969 or earlier (%) - Hispanic or Latino
Year householder moved into unit - Moved in 1969 or earlier (%) - American Indian and Alaska Native
Year householder moved into unit - Moved in 1969 or earlier (%) - Multirace
Year householder moved into unit - Moved in 1969 or earlier (%) - Other Race
Housing units lacking complete plumbing facilities (%)
Housing units lacking complete kitchen facilities (%)
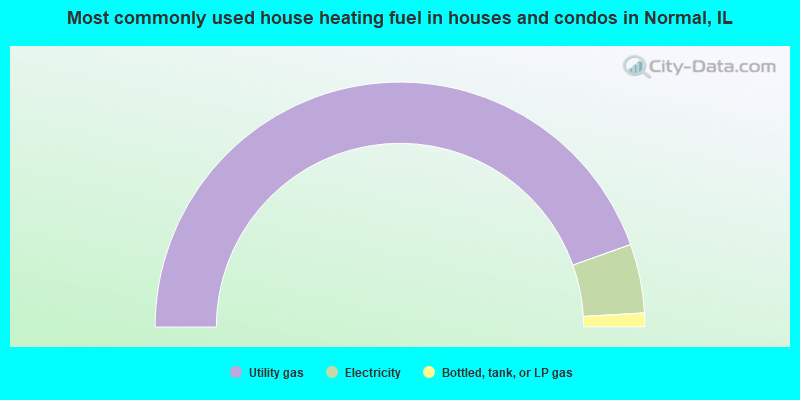
House heating fuel used in houses and condos - Utility gas (%)
House heating fuel used in houses and condos - Bottled, tank, or LP gas (%)
House heating fuel used in houses and condos - Electricity (%)
House heating fuel used in houses and condos - Fuel oil, kerosene, etc. (%)
House heating fuel used in houses and condos - Coal or coke (%)
House heating fuel used in houses and condos - Wood (%)
House heating fuel used in houses and condos - Solar energy (%)
House heating fuel used in houses and condos - Other fuel (%)
House heating fuel used in houses and condos - No fuel used (%)
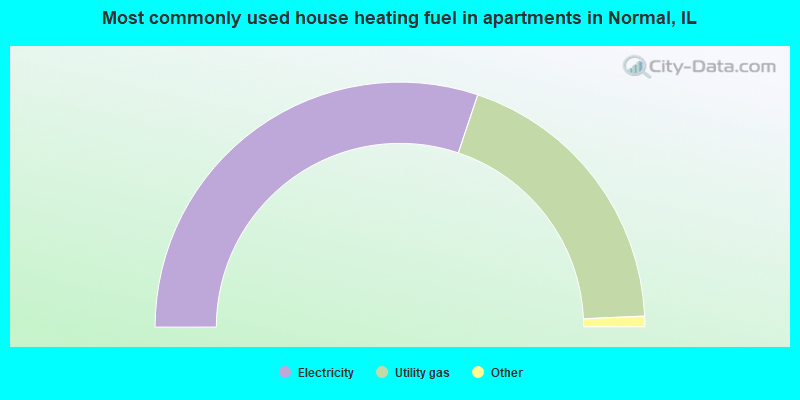
House heating fuel used in apartments - Utility gas (%)
House heating fuel used in apartments - Bottled, tank, or LP gas (%)
House heating fuel used in apartments - Electricity (%)
House heating fuel used in apartments - Fuel oil, kerosene, etc. (%)
House heating fuel used in apartments - Coal or coke (%)
House heating fuel used in apartments - Wood (%)
House heating fuel used in apartments - Solar energy (%)
House heating fuel used in apartments - Other fuel (%)
House heating fuel used in apartments - No fuel used (%)
Latest news about housing in Normal, IL collected exclusively by city-data.com from local newspapers, TV, and radio stations
Median year house/condo built: 1987Median year apartment built: 1989Household type by relationship:
Households: 52,875
Male householders: 9,703 (3,048 living alone ), Female householders: 9,937 (3,228 living alone )7,497 spouses (7,290 opposite-sex spouses ), 1,026 unmarried partners , (901 opposite-sex unmarried partners ), 11,382 children (10,838 natural , 228 adopted , 314 stepchildren ), 402 grandchildren , 340 brothers or sisters , 233 parents , 0 foster children , 379 other relatives , 5,641 non-relatives In group quarters: 6,329
Size of family households: 4,496 2-persons , 2,376 3-persons , 1,525 4-persons , 552 5-persons , 292 6-persons , 149 7-or-more-persons .
Size of nonfamily households: 7,005 1-person , 2,071 2-persons , 475 3-persons , 880 4-persons , 14 5-persons , 33 6-persons .
6,536 married couples with children. single-parent households (219 men , 1,797 women ).
90.7% of residents of Normal speak English at home. of residents speak Spanish at home (79% speak English very well , 17% speak English well , 4% speak English not well ).of residents speak other Indo-European language at home (84% speak English very well , 13% speak English well , 2% speak English not well ).of residents speak Asian or Pacific Island language at home (80% speak English very well , 19% speak English well , 1% speak English not well ).of residents speak other language at home (67% speak English very well , 33% speak English well ).
Foreign born population: 2,934 (5.5%)of them are naturalized citizens )
Median number of rooms in houses and condos:
Median number of rooms in apartments
Owner-occupied Renter-occupied
Bedrooms in owner-occupied houses and condos in Normal, Illinois
7 no bedroom 41 1 bedroom 1,253 2 bedrooms 4,468 3 bedrooms 4,217 4 bedrooms 1,044 5+ bedrooms
Bedrooms in renter-occupied apartments in Normal, Illinois
572 no bedroom 1,736 1 bedroom 3,125 2 bedrooms 1,339 3 bedrooms 1,897 4 bedrooms 71 5+ bedrooms
Owner-occupied Renter-occupied
Rooms in owner-occupied houses in Normal, Illinois
7 1 room 0 2 rooms 42 3 rooms 483 4 rooms 1,581 5 rooms 2,008 6 rooms 1,529 7 rooms 2,039 8 rooms 3,341 9+ rooms
Rooms in renter-occupied apartments in Normal, Illinois
524 1 room 786 2 rooms 1,649 3 rooms 2,000 4 rooms 1,959 5 rooms 1,013 6 rooms 355 7 rooms 243 8 rooms 209 9+ rooms
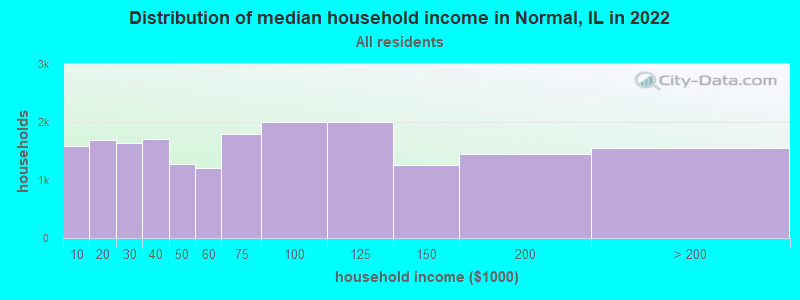
Normal, IL household income distribution 1,586 Less than $10,0001,690 $10,000 to $19,9991,645 $20,000 to $29,9991,713 $30,000 to $39,9991,280 $40,000 to $49,9991,206 $50,000 to $59,9991,794 $60,000 to $74,9992,008 $75,000 to $99,9992,007 $100,000 to $124,9991,251 $125,000 to $149,9991,455 $150,000 to $199,9991,555 $200,000 or more
Home value of owner - occupied houses in 2022 in Normal, IL 84 Less than $10,00038 $10,000 to $14,999175 $15,000 to $19,99941 $20,000 to $24,99971 $25,000 to $29,99932 $30,000 to $34,99914 $35,000 to $39,99915 $40,000 to $49,99927 $50,000 to $59,99946 $60,000 to $69,99923 $70,000 to $79,99970 $80,000 to $89,99987 $90,000 to $99,999885 $100,000 to $124,9991,072 $125,000 to $149,9991,947 $150,000 to $174,9991,134 $175,000 to $199,9992,188 $200,000 to $249,9991,392 $250,000 to $299,9991,075 $300,000 to $399,999221 $400,000 to $499,999133 $500,000 to $749,99935 $750,000 to $999,99929 $1,000,000 to $1,499,99930 $1,500,000 to $1,999,999Rent paid by renters in 2022 in Normal, IL 18 $100 to $14978 $150 to $199181 $250 to $299158 $350 to $39955 $400 to $449174 $450 to $499239 $500 to $549165 $550 to $599549 $600 to $649411 $650 to $699872 $700 to $7491,022 $750 to $7991,571 $800 to $899903 $900 to $999820 $1,000 to $1,249632 $1,250 to $1,499621 $1,500 to $1,999245 $2,000 to $2,49991 $2,500 to $2,999159 $3,000 to $3,49910 $3,500 or more131 No cash rent
Percentage of workers working in this county: 89.8%Number of people working at home: 4,802 (17.8% of all workers )
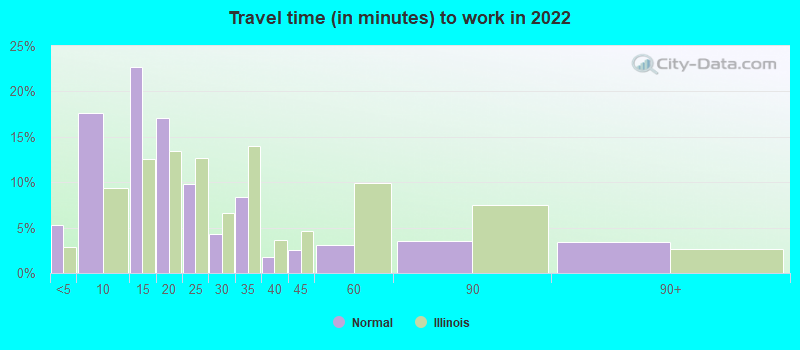
Travel time to work (commute)
Less than 5 minutes: 1,6435 to 9 minutes: 4,46310 to 14 minutes: 5,36915 to 19 minutes: 4,78020 to 24 minutes: 1,88125 to 29 minutes: 35330 to 34 minutes: 96235 to 39 minutes: 30140 to 44 minutes: 29045 to 59 minutes: 33960 to 89 minutes: 66090 or more minutes: 760
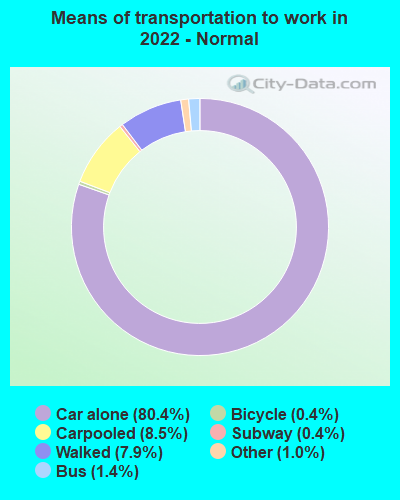
Means of transportation to work:
Drove a car alone: 18,410 (66.8%)Carpooled: 1,648 (6.0%)Bus : 306 (1.1%)Subway or elevated rail : 14 (0.1%)Long-distance train or commuter rail : 101 (0.4%)Taxi: 136 (0.5%)Bicycle: 152 (0.6%)Walked: 1,703 (6.2%)Worked at home: 4,802 (17.4%)
Unemployment by race in 2022
Unemployment rate for White non-Hispanic residents 2.8% Males3.7% FemalesUnemployment rate for Black residents 4.5% Males4.5% FemalesUnemployment rate for American Indian and Alaska Native residents 91.7% MalesUnemployment rate for Asian residents 9.0% Males10.9% FemalesUnemployment rate for two or more race residents 7.4% MalesUnemployment rate for Hispanic or Latino residents 3.1% Females
Year of entry for the foreign-born population in Normal, Illinois
1,489 2010 or later 706 2000 to 2009 601 1990 to 1999 434 1980 to 1989 254 1970 to 1979 191 Before 1970
First ancestries reported:
German: 5,785 (21.3%)
English: 3,190 (11.7%)
Irish: 3,107 (11.4%)
American: 1,929 (7.1%)
Polish: 1,019 (3.7%)
European: 624 (2.3%)
Italian: 575 (2.1%)
African: 461 (1.7%)
Swedish: 394 (1.4%)
Russian: 244 (0.9%)
Norwegian: 224 (0.8%)
French: 174 (0.6%)
Dutch: 164 (0.6%)
Scottish: 155 (0.6%)
Welsh: 147 (0.5%)
Palestinian: 95 (0.3%)
Nigerian: 87 (0.3%)
Ethiopian: 74 (0.3%)
French Canadian: 73 (0.3%)
Northern European: 70 (0.3%)
Greek: 59 (0.2%)
Belgian: 53 (0.2%)
Scandinavian: 49 (0.2%)
Slavic: 48 (0.2%)
Danish: 48 (0.2%)
Moroccan: 43 (0.2%)
British: 43 (0.2%)
Scotch-Irish: 43 (0.2%)
Czech: 36 (0.1%)
Romanian: 34 (0.1%)
Austrian: 32 (0.1%)
Kenyan: 32 (0.1%)
Turkish: 31 (0.1%)
Arab: 29 (0.1%)
Jamaican: 27 (0.10%)
Canadian: 25 (0.09%)
Serbian: 24 (0.09%)
Pennsylvania German: 23 (0.08%)
Czechoslovakian: 23 (0.08%)
Eastern European: 22 (0.08%)
Macedonian: 19 (0.07%)
Ukrainian: 14 (0.05%)
Belizean: 14 (0.05%)
Hungarian: 10 (0.04%)
Haitian: 10 (0.04%)
Slovak: 9 (0.03%)
South African: 8 (0.03%)
Basque: 7 (0.03%)
Finnish: 6 (0.02%)
Most common places of birth for foreign-born residents (%): India Normal:
17.3% (574)Illinois:
9.2% (166,409)
Mexico Normal:
11.2% (372)Illinois:
34.7% (626,958)
Nigeria Normal:
7.3% (244)Illinois:
1.2% (21,186)
Democratic Republic of Congo (Zaire) Normal:
6.9% (231)Illinois:
0.2% (4,414)
Russia Normal:
6.6% (220)Illinois:
0.9% (16,308)
Korea Normal:
4.6% (154)Illinois:
2.2% (40,393)
Germany Normal:
4.3% (143)Illinois:
1.0% (18,753)
China, excluding Hong Kong and Taiwan Normal:
4.1% (135)Illinois:
4.1% (74,364)
Congo Normal:
3.8% (126)Illinois:
0.1% (1,142)
Philippines Normal:
2.8% (92)Illinois:
5.2% (93,003)
Vietnam Normal:
2.8% (92)Illinois:
1.2% (22,269)
Colombia Normal:
2.6% (86)Illinois:
0.9% (16,553)
Canada Normal:
2.5% (84)Illinois:
1.1% (19,306)
Guatemala Normal:
2.0% (66)Illinois:
1.3% (22,793)
Ethiopia Normal:
1.9% (63)Illinois:
0.3% (4,775)
Taiwan Normal:
1.7% (58)Illinois:
0.5% (8,235)
Kenya Normal:
1.6% (54)Illinois:
0.1% (2,357)
Place of birth for U.S.-born residents:
This state: 40,845Other state: 8,667Northeast: 1,140Midwest: 4,668South: 1,648West: 1,249 77.2% of Normal residents lived in the same house 1 years ago.
Out of people who lived in different houses, 27.4% lived in this county.
Out of people who lived in different counties, 74.2% lived in Illinois.
Normal:
77.2%State average:
88.3%
Education attainment for males 25 years and older:
No schooling: 36Nursery to 4th grade: 205th and 6th grade: 17th and 8th grade: 189th grade: 2310th grade: 4111th grade: 6912th grade, no diploma: 107High school graduate (or equivalency): 2,073Less than 1 year of college: 630Some college more than 1 year, no degree: 1,660Associate degree: 772Bachelor's degree: 5,302Master's degree: 1,109Professional school degree: 509Doctorate degree: 517
Education attainment for females 25 years and older:
No schooling: 47Nursery to 4th grade: 155th and 6th grade: 497th and 8th grade: 449th grade: 7310th grade: 3211th grade: 8012th grade, no diploma: 47High school graduate (or equivalency): 2,447Less than 1 year of college: 764Some college more than 1 year, no degree: 1,868Associate degree: 1,120Bachelor's degree: 4,618Master's degree: 1,960Professional school degree: 327Doctorate degree: 389
Housing units in structures:
One, detached: 10,615One, attached: 1,406Two: 3533 or 4: 1,3845 to 9: 2,25010 to 19: 2,95320 to 49: 1,35050 or more: 1,317Mobile homes: 460Median worth of mobile homes: $30,440
Housing units lacking complete plumbing facilities in 2022: 0.4%Housing units lacking complete kitchen facilities in 2022: 2.0%House/condo owner moved in on average 9 years ago
Renter moved in on average 0 years ago
Private vs. public school enrollment:
Students in private schools in grades 1 to 8 (elementary and middle school): 827 Students in private schools in grades 9 to 12 (high school): 339 Students in private undergraduate colleges: 731