North Boston, NY (New York) Houses and Residents
| North Boston: | $233,371 |
| New York: | $400,400 |
Mean price in 2022:
Detached houses: $252,841
Here: $252,841 State: $476,719 Mobile homes: $12,094
Here: $12,094 State: $88,925
Total population: 2,521 (Urban population: 2,232, Rural population: 526 (12 farm, 514 nonfarm))
Houses: 1,332 (1,323 occupied: 1,015 owner occupied, 315 renter occupied)
| % of renters here: | 24% |
| State: | 46% |
Housing density: 324 houses/condos per square mile
Median price asked for vacant for-sale houses and condos in 2022 in this county: $275,138.
Median contract rent in 2022: $1,196 (lower quartile is $769, upper quartile is $1,471)
Median rent asked for vacant for-rent units in 2022: $1,380
Median gross rent in North Boston, NY in 2022: $1,358
Housing units in North Boston with a mortgage: 507 (80 second mortgage, 0 home equity loan, 83 both second mortgage and home equity loan)
Houses without a mortgage: 149
Median household income for houses/condos with a mortgage: $101,249
Median household income for apartments without a mortgage: $52,251
Median monthly housing costs: $988
Compare current foreclosures near North Boston, NY:
| Photo | Address | Area | Beds / Baths | Price | Details |
|---|---|---|---|---|---|

|
#1
Cattaraugus St
Springville, NY 14141
|
1,424 sq. feet
|
1 baths 3 beds |
$249,900
|
show details |

|
#2
Heussy Ave
Buffalo, NY 14220
|
1,455 sq. feet
|
2 baths 3 beds |
$245,000
|
show details |

|
#3
Brewster St
Depew, NY 14043
|
1,056 sq. feet
|
1 baths 3 beds |
$159,000
|
show details |

|
#4
George Dr
Buffalo, NY 14224
|
1,706 sq. feet
|
1 baths 3 beds |
show details | |

|
#5
Newman St
Buffalo, NY 14218
|
1,344 sq. feet
|
1 baths 3 beds |
show details | |

|
#6
Central Blvd
Buffalo, NY 14225
|
1,406 sq. feet
|
1 baths 3 beds |
show details | |

|
#7
Blake St
Buffalo, NY 14211
|
1,620 sq. feet
|
2 baths 4 beds |
show details | |

|
#8
Dempster St
Buffalo, NY 14206
|
1,070 sq. feet
|
1 baths 3 beds |
show details | |

|
#9
Abbott Rd
Orchard Park, NY 14127
|
1,232 sq. feet
|
1 baths 3 beds |
show details | |

|
#10
Eastwood Ave
Hamburg, NY 14075
|
2,206 sq. feet
|
2 baths 3 beds |
show details |
| Photo | Address | Area | Beds / Baths | Price | Details |
|---|---|---|---|---|---|

|
#11
Quebec St
Angola, NY 14006
|
1,262 sq. feet
|
1 baths 3 beds |
show details | |

|
#12
Hunters Creek Rd
Holland, NY 14080
|
3,188 sq. feet
|
2 baths 4 beds |
show details | |

|
#13
Vermont St
North Collins, NY 14111
|
1,864 sq. feet
|
1 baths 5 beds |
show details | |

|
#14
Pinehurst Ave
Buffalo, NY 14225
|
1,050 sq. feet
|
1 baths 3 beds |
show details | |

|
#15
Pleasant View Avenue Aka 9 Pleasant Avenue
Angola, NY 14006
|
2,078 sq. feet
|
2 baths 4 beds |
show details | |

|
#16
Main St
Collins, NY 14034
|
2,560 sq. feet
|
1 baths 4 beds |
show details | |

|
#17
Hayes Hollow Rd
Colden, NY 14033
|
3,752 sq. feet
|
3 baths 7 beds |
show details | |

|
#18
Jamison Rd
Elma, NY 14059
|
2,457 sq. feet
|
2 baths 4 beds |
show details | |

|
#19
Eureka Pl
Buffalo, NY 14204
|
1,308 sq. feet
|
1 baths 3 beds |
show details | |

|
#20
Evergreen Dr
Lake View, NY 14085
|
1,952 sq. feet
|
4 baths 5 beds |
show details |
| Photo | Address | Area | Beds / Baths | Price | Details |
|---|---|---|---|---|---|

|
#21
Madison St
Buffalo, NY 14210
|
1,177 sq. feet
|
1 baths 3 beds |
show details | |

|
#22
E Lovejoy St
Buffalo, NY 14206
|
2,688 sq. feet
|
2 baths 6 beds |
show details | |

|
#23
Constance Ln
Buffalo, NY 14227
|
2,504 sq. feet
|
2 baths 5 beds |
show details | |

|
#24
Country Pl
Lancaster, NY 14086
|
1,360 sq. feet
|
1 baths 3 beds |
show details | |

|
#25
John Paul Ct
Buffalo, NY 14206
|
1,072 sq. feet
|
1 baths 3 beds |
show details | |

|
#26
Sycamore Ave
Angola, NY 14006
|
1,024 sq. feet
|
1 baths 3 beds |
show details | |

|
#27
Guilford St
Buffalo, NY 14211
|
1,444 sq. feet
|
1 baths 3 beds |
show details | |

|
#28
Four Rod Rd
East Aurora, NY 14052
|
2,380 sq. feet
|
1 baths 2 beds |
show details | |

|
#29
Dubonnet Dr
Depew, NY 14043
|
1,516 sq. feet
|
1 baths 3 beds |
show details | |

|
#30
Howard St
Buffalo, NY 14206
|
1,290 sq. feet
|
1 baths 4 beds |
show details |
| Photo | Address | Area | Beds / Baths | Price | Details |
|---|---|---|---|---|---|

|
#31
Linden St
Buffalo, NY 14206
|
1,522 sq. feet
|
1 baths 4 beds |
show details | |

|
#32
Grape St
Buffalo, NY 14204
|
2,324 sq. feet
|
2 baths 4 beds |
show details | |

|
#33
E Lovejoy St
Buffalo, NY 14206
|
1,091 sq. feet
|
1 baths 3 beds |
show details | |

|
#34
Losson Rd
Buffalo, NY 14227
|
1,728 sq. feet
|
1 baths 3 beds |
show details | |

|
#35
Madeira Dr
Depew, NY 14043
|
1,120 sq. feet
|
1 baths 3 beds |
show details | |

|
#36
Girard Ave
Buffalo, NY 14227
|
2,848 sq. feet
|
3 baths 4 beds |
show details | |

|
#37
Grote Rd
Springville, NY 14141
|
1,652 sq. feet
|
1 baths 2 beds |
show details | |

|
#38
William St
Buffalo, NY 14206
|
1,604 sq. feet
|
2 baths 3 beds |
show details | |

|
#39
Cayuga Creek Rd
Buffalo, NY 14227
|
1,622 sq. feet
|
1 baths 4 beds |
show details | |

|
#40
Transit Rd
Depew, NY 14043
|
1,554 sq. feet
|
1 baths 4 beds |
show details |
| Photo | Address | Area | Beds / Baths | Price | Details |
|---|---|---|---|---|---|

|
#41
Ashley Dr
Lancaster, NY 14086
|
1,020 sq. feet
|
1 baths 3 beds |
show details | |

|
#42
Seymour St
Buffalo, NY 14210
|
2,490 sq. feet
|
2 baths 6 beds |
show details | |

|
#43
Sobieski St
Buffalo, NY 14212
|
1,652 sq. feet
|
2 baths 3 beds |
show details | |

|
#44
Wallace Ave
Buffalo, NY 14227
|
1,153 sq. feet
|
1 baths 3 beds |
show details | |

|
#45
Summer Ave
Angola, NY 14006
|
1,064 sq. feet
|
1 baths 2 beds |
show details | |

|
#46
Savage Rd
Chaffee, NY 14030
|
1,086 sq. feet
|
1 baths 3 beds |
show details | |

|
#47
William St
Lancaster, NY 14086
|
1,617 sq. feet
|
1 baths 3 beds |
show details | |

|
#48
Lemoine Ave
Buffalo, NY 14227
|
1,040 sq. feet
|
1 baths 3 beds |
show details | |

|
#49
Wyndmoor Ct
Depew, NY 14043
|
1,118 sq. feet
|
1 baths 3 beds |
show details | |

|
Check over 1 million property listings on Foreclosure.com!
|
browse all offers | |||


 | Potential Relocation to Buffalo Area (9 replies) |
| What are the wealthiest suburbs in the Buffalo/Niagara Falls area? (38 replies) |

Median year apartment built: 1987
Household type by relationship:
Households: 2,551- Male householders: 748 (281 living alone), Female householders: 565 (251 living alone)
538 spouses (538 opposite-sex spouses), 109 unmarried partners, (109 opposite-sex unmarried partners), 509 children (459 natural, 49 adopted, 0 stepchildren), 0 grandchildren, 0 brothers or sisters, 23 parents, 0 foster children, 12 other relatives, 42 non-relatives
Size of family households: 421 2-persons, 209 3-persons, 21 4-persons, 75 5-persons.
Size of nonfamily households: 533 1-person, 82 2-persons.
217 married couples with children.
84 single-parent households (14 men, 70 women).
All residents speak only English at home
Foreign born population: 31 (1.2%)
(51.6% of them are naturalized citizens)
| Here: | 6.0 |
| State: | 6.3 |
| Here: | 4.2 |
| State: | 3.8 |

- Bedrooms in owner-occupied houses and condos in North Boston, New York
- 43no bedroom
- 261 bedroom
- 1632 bedrooms
- 6503 bedrooms
- 1344 bedrooms
- 05+ bedrooms

- Bedrooms in renter-occupied apartments in North Boston, New York
- 0no bedroom
- 691 bedroom
- 2322 bedrooms
- 153 bedrooms
- 04 bedrooms
- 05+ bedrooms

- Cars and other vehicles available in North Boston in owner-occupied houses/condos
- 25no vehicle
- 3121 vehicle
- 3062 vehicles
- 3343 vehicles
- 124 vehicles
- 265+ vehicles

- Cars and other vehicles available in North Boston in renter-occupied apartments
- 0no vehicle
- 1911 vehicle
- 1062 vehicles
- 183 vehicles
- 04 vehicles
- 05+ vehicles

- Rooms in owner-occupied houses in North Boston, New York
- 431 room
- 02 rooms
- 03 rooms
- 914 rooms
- 2345 rooms
- 2696 rooms
- 1477 rooms
- 978 rooms
- 1359+ rooms

- Rooms in renter-occupied apartments in North Boston, New York
- 01 room
- 02 rooms
- 153 rooms
- 1904 rooms
- 765 rooms
- 166 rooms
- 187 rooms
- 08 rooms
- 09+ rooms


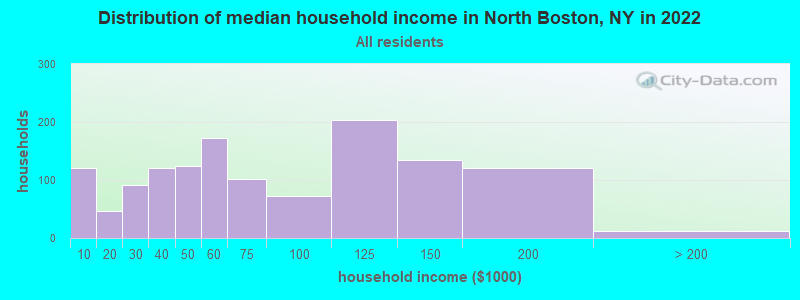
North Boston, NY household income distribution

- 120Less than $10,000
- 46$10,000 to $19,999
- 91$20,000 to $29,999
- 121$30,000 to $39,999
- 124$40,000 to $49,999
- 173$50,000 to $59,999
- 101$60,000 to $74,999
- 72$75,000 to $99,999
- 204$100,000 to $124,999
- 134$125,000 to $149,999
- 121$150,000 to $199,999
- 12$200,000 or more
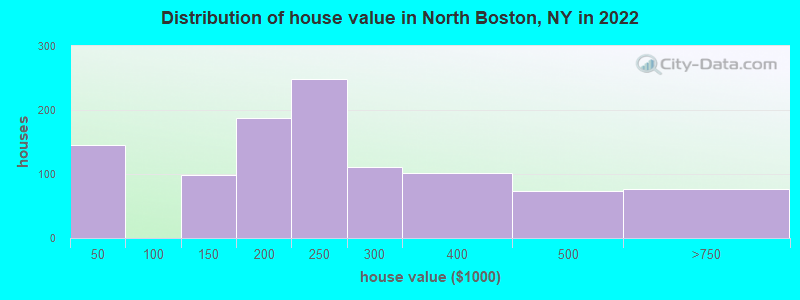
Home value of owner - occupied houses in 2022 in North Boston, NY
-
- 41Less than $10,000
- 42$10,000 to $14,999
- 12$15,000 to $19,999
- 48$35,000 to $39,999
- 24$100,000 to $124,999
- 75$125,000 to $149,999
- 43$150,000 to $174,999
- 143$175,000 to $199,999
- 248$200,000 to $249,999
- 111$250,000 to $299,999
- 101$300,000 to $399,999
- 73$400,000 to $499,999
- 76$500,000 to $749,999
Rent paid by renters in 2022 in North Boston, NY
-
- 16$200 to $249
- 22$450 to $499
- 8$550 to $599
- 18$700 to $749
- 14$750 to $799
- 16$800 to $899
- 12$900 to $999
- 40$1,000 to $1,249
- 155$1,250 to $1,499
- 23$1,500 to $1,999


Percentage of workers working in this county: 98.1%
Number of people working at home: 161 (12.0% of all workers)
Travel time to work (commute)
- Less than 5 minutes: 0
- 5 to 9 minutes: 72
- 10 to 14 minutes: 235
- 15 to 19 minutes: 240
- 20 to 24 minutes: 118
- 25 to 29 minutes: 98
- 30 to 34 minutes: 271
- 35 to 39 minutes: 0
- 40 to 44 minutes: 62
- 45 to 59 minutes: 68
- 60 to 89 minutes: 0
- 90 or more minutes: 0
Means of transportation to work:
- Drove a car alone: 1,360 (91.4%)
- Carpooled: 85 (5.7%)
- Walked: 6 (0.4%)
- Worked at home: 37 (2.5%)

- Unemployment by race in 2022
- Unemployment rate for White non-Hispanic residents
- 4.2%Males
- 7.6%Females
- Unemployment rate for two or more race residents
- 40.1%Males

- Year of entry for the foreign-born population in North Boston, New York
- 192010 or later
- 02000 to 2009
- 01990 to 1999
- 01980 to 1989
- 01970 to 1979
- 46Before 1970
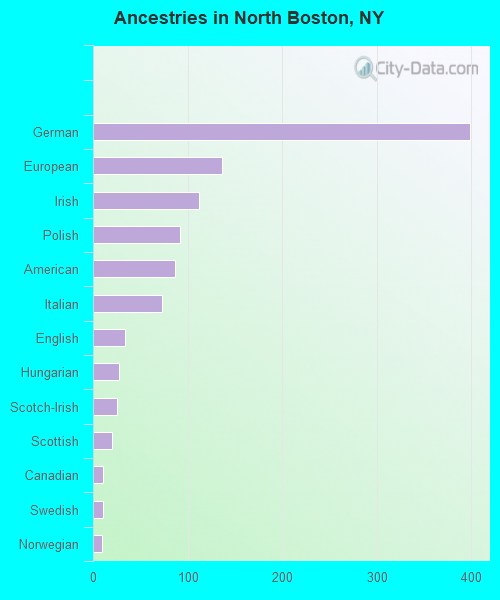
First ancestries reported:
- German: 399 (34.1%)
- European: 136 (11.6%)
- Irish: 112 (9.6%)
- Polish: 92 (7.9%)
- American: 87 (7.4%)
- Italian: 73 (6.2%)
- English: 34 (2.9%)
- Hungarian: 28 (2.4%)
- Scotch-Irish: 25 (2.1%)
- Scottish: 20 (1.7%)
- Canadian: 11 (0.9%)
- Swedish: 11 (0.9%)
- Norwegian: 9 (0.8%)
Most common places of birth for foreign-born residents (%):
| North Boston: | 50.0% (16) |
| New York: | 1.8% (82,786) |
| North Boston: | 46.9% (15) |
| New York: | 1.3% (59,107) |
Place of birth for U.S.-born residents:
- This state: 2,004
- Other state: 497
- Northeast: 59
- Midwest: 75
- South: 66
- West: 317
92.9% of North Boston residents lived in the same house 1 years ago.
Out of people who lived in different houses, 41.6% lived in this county.
Out of people who lived in different counties, 100.0% lived in New York.
| North Boston: | 92.9% |
| State average: | 89.6% |
Education attainment for males 25 years and older:
- No schooling: 0
- Nursery to 4th grade: 0
- 5th and 6th grade: 0
- 7th and 8th grade: 0
- 9th grade: 0
- 10th grade: 0
- 11th grade: 0
- 12th grade, no diploma: 11
- High school graduate (or equivalency): 272
- Less than 1 year of college: 155
- Some college more than 1 year, no degree: 105
- Associate degree: 201
- Bachelor's degree: 189
- Master's degree: 11
- Professional school degree: 0
- Doctorate degree: 14

Education attainment for females 25 years and older:
- No schooling: 19
- Nursery to 4th grade: 10
- 5th and 6th grade: 0
- 7th and 8th grade: 0
- 9th grade: 0
- 10th grade: 14
- 11th grade: 0
- 12th grade, no diploma: 0
- High school graduate (or equivalency): 383
- Less than 1 year of college: 54
- Some college more than 1 year, no degree: 88
- Associate degree: 166
- Bachelor's degree: 210
- Master's degree: 57
- Professional school degree: 0
- Doctorate degree: 41


Housing units in structures:
- One, detached: 955
- One, attached: 54
- 3 or 4: 33
- 5 to 9: 133
- Mobile homes: 154
Median worth of mobile homes: $15,130
House/condo owner moved in on average 18 years ago
Renter moved in on average 5 years ago

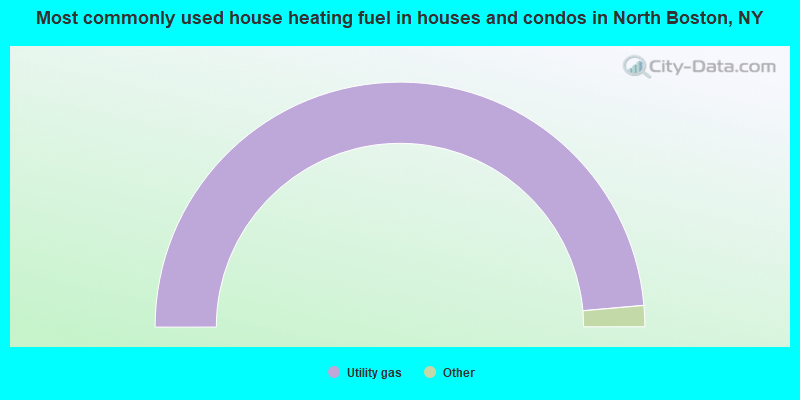
- 97.2%Utility gas
- 1.5%Bottled, tank, or LP gas
- 1.3%Electricity
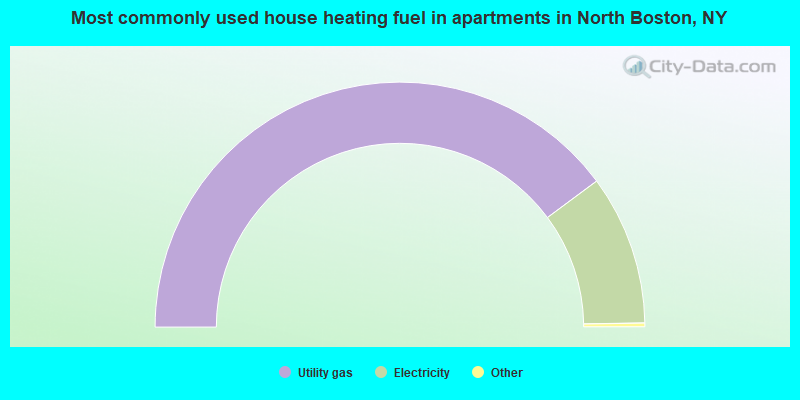
- 80.1%Utility gas
- 19.9%Electricity
Private vs. public school enrollment:
| Here: | 38.0% |
| New York: | 15.6% |
| Here: | 20.6% |
| New York: | 15.0% |
| Here: | 6.7% |
| New York: | 39.2% |


