North Charleston, SC (South Carolina) Houses and Residents
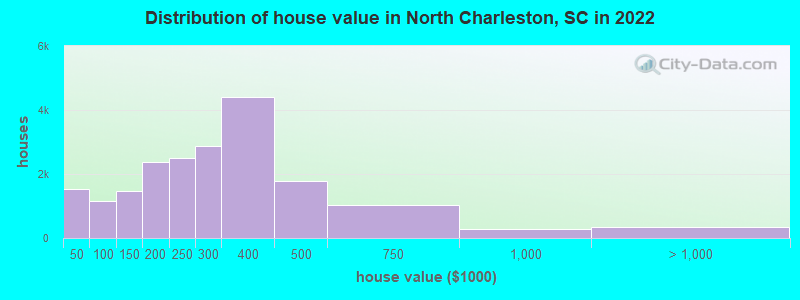
Estimated median house or condo value in 2022: $310,700 (it was $64,500 in 2000 )
North Charleston:
$310,700South Carolina:
$254,600
Lower value quartile - upper value quartile: $217,300 - $389,700Mean price in 2022: Detached houses: $286,451 Here:
$286,451State:
$368,255
Townhouses or other attached units: $203,658 Here:
$203,658State:
$292,023
In 2-unit structures: $565,522 Here:
$565,522State:
$358,283
In 3-to-4-unit structures: $124,962 Here:
$124,962State:
$230,702
In 5-or-more-unit structures: $286,292 Here:
$286,292State:
$326,361
Mobile homes: $53,883 Here:
$53,883State:
$102,531
Total population: 106,749 (Urban population: 77,073, Rural population: 2,369 (all nonfarm) )
Houses: 51,846 (47,683 occupied: 22,522 owner occupied, 25,161 renter occupied )
% of renters here:
53%State:
28%
Housing density: 886 houses/condos per square mile
Median price asked for vacant for-sale houses and condos in 2022: $443,452.
Median contract rent in 2022: $1,123 (lower quartile is $857, upper quartile is $1,384)
Median rent asked for vacant for-rent units in 2022: $899
Median gross rent in North Charleston, SC in 2022: $1,291
Housing units in North Charleston with a mortgage: 15,428 (1,089 second mortgage, 0 home equity loan, 599 both second mortgage and home equity loan )Houses without a mortgage: 88
Median household income for houses/condos with a mortgage: $95,950
Median household income for apartments without a mortgage: $58,713
Median monthly housing costs: $1,272
Data:
Median house or condo value ($)
Median house or condo value ($ change since 2000)
Median house or condo value ($) - White
Median house or condo value ($) - Black or African American
Median house or condo value ($) - Asian
Median house or condo value ($) - Hispanic or Latino
Median house or condo value ($) - American Indian and Alaska Native
Median house or condo value ($) - Multirace
Median house or condo value ($) - Other Race
Median price asked for mobile homes ($)
Household density (households per square mile)
Mean house or condo value by units in structure - 1, detached ($)
Mean house or condo value by units in structure - 1, attached ($)
Mean house or condo value by units in structure - 2 ($)
Mean house or condo value by units in structure by units in structure - 3 or 4 ($)
Mean house or condo value by units in structure - 5 or more ($)
Mean house or condo value by units in structure - Boat, RV, van, etc. ($)
Mean house or condo value by units in structure - Mobile home ($)
Median contract rent ($)
Median contract rent - Lower quartile ($)
Median contract rent - Upper quartile ($)
Median gross rent ($)
Urban houses (%)
Rural houses (%)
Houses occupied (%)
Houses occupied (% change since 2000)
Houses owner occupied (%)
Houses owner occupied (% change since 2000)
Houses renter occupied (%)
Houses renter occupied (% change since 2000)
Vacant housing units - For rent (%)
Vacant housing units - For rent (% change since 2000)
Vacant housing units - For sale only (%)
Vacant housing units - For sale only (% change since 2000)
Vacant housing units - Rented or sold, not occupied (%)
Vacant housing units - Rented or sold, not occupied (% change since 2000)
Vacant housing units - For seasonal, recreational, or occasional use (%)
Vacant housing units - For seasonal, recreational, or occasional use (% change since 2000)
Vacant housing units - For migrant workers (%)
Vacant housing units - For migrant workers (% change since 2000)
Vacant housing units - Other vacant (%)
Vacant housing units - Other vacant (% change since 2000)
Median monthly housing costs ($)
Median household income for houses/condos with a mortgage ($)
Median household income for houses/condos without a mortgage ($)
Median household income ($)
Median household income ($) - White
Median household income ($) - Black or African American
Median household income ($) - Asian
Median household income ($) - Hispanic or Latino
Median household income ($) - American Indian and Alaska Native
Median household income ($) - Multirace
Median household income ($) - Other Race
Mortgage status - with mortgage (%)
Mortgage status - with second mortgage (%)
Mortgage status - with home equity loan (%)
Mortgage status - with both second mortgage and home equity loan (%)
Mortgage status - without a mortgage (%)
Median year house/condo built
Median year apartment built
Household type by relationship - Male householder living alone (%)
Household type by relationship - Male householder not living alone (%)
Household type by relationship - Female householder living alone (%)
Household type by relationship - Female householder not living alone (%)
Household type by relationship - Opposite-Sex spouse (%)
Household type by relationship - Same-Sex spouse (%)
Household type by relationship - Opposite-Sex unmarried partner (%)
Household type by relationship - Same-Sex unmarried partner (%)
Household type by relationship - In group quarters (%)
Size of family households - 2-person household (%)
Size of family households - 3-person household (%)
Size of family households - 4-person household (%)
Size of family households - 5-person household (%)
Size of family households - 6-person household (%)
Size of family households - 7-or-more-person household (%)
Size of nonfamily households - 1-person household (%)
Size of nonfamily households - 2-person household (%)
Size of nonfamily households - 3-person household (%)
Size of nonfamily households - 4-person household (%)
Size of nonfamily households - 5-person household (%)
Size of nonfamily households - 6-person household (%)
Size of nonfamily households - 7-or-moreperson household (%)
Year house built - Built 2010 or later (%)
Year house built - Built 2000 to 2009 (%)
Year house built - Built 1990 to 1999 (%)
Year house built - Built 1980 to 1989 (%)
Year house built - Built 1970 to 1979 (%)
Year house built - Built 1960 to 1969 (%)
Year house built - Built 1950 to 1959 (%)
Year house built - Built 1940 to 1949 (%)
Year house built - Built 1939 or earlier (%)
Median number of rooms in houses and condos
Median number of rooms in apartments
Median number of bedrooms in owner occupied houses
Mean number of bedrooms in owner occupied houses
Median number of bedrooms in renter occupied houses
Mean number of bedrooms in renter occupied houses
Median number of vehichles in owner occupied houses
Mean number of vehichles in owner occupied houses
Median number of vehichles in renter occupied houses
Mean number of vehichles in renter occupied houses
Rooms in owner-occupied houses - 1 room (%)
Rooms in owner-occupied houses - 2 rooms (%)
Rooms in owner-occupied houses - 3 rooms (%)
Rooms in owner-occupied houses - 4 rooms (%)
Rooms in owner-occupied houses - 5 rooms (%)
Rooms in owner-occupied houses - 6 rooms (%)
Rooms in owner-occupied houses - 7 rooms (%)
Rooms in owner-occupied houses - 8 rooms (%)
Rooms in owner-occupied houses - 9+ rooms (%)
Rooms in renter-occupied houses - 1 room (%)
Rooms in renter-occupied houses - 2 rooms (%)
Rooms in renter-occupied houses - 3 rooms (%)
Rooms in renter-occupied houses - 4 rooms (%)
Rooms in renter-occupied houses - 5 rooms (%)
Rooms in renter-occupied houses - 6 rooms (%)
Rooms in renter-occupied houses - 7 rooms (%)
Rooms in renter-occupied houses - 8 rooms (%)
Rooms in renter-occupied houses - 9+ rooms (%)
Bedrooms in owner-occupied houses - no bedrooms (%)
Bedrooms in owner-occupied houses - 1 bedroom (%)
Bedrooms in owner-occupied houses - 2 bedrooms (%)
Bedrooms in owner-occupied houses - 3 bedrooms (%)
Bedrooms in owner-occupied houses - 4 bedrooms (%)
Bedrooms in owner-occupied houses - 5+ bedrooms (%)
Bedrooms in renter-occupied houses - no bedrooms (%)
Bedrooms in renter-occupied houses - 1 bedroom (%)
Bedrooms in renter-occupied houses - 2 bedrooms (%)
Bedrooms in renter-occupied houses - 3 bedrooms (%)
Bedrooms in renter-occupied houses - 4 bedrooms (%)
Bedrooms in renter-occupied houses - 5+ bedrooms (%)
Vehicles available in owner-occupied houses - no vehicle available (%)
Vehicles available in owner-occupied houses - 1 vehicle available(%)
Vehicles available in owner-occupied houses - 2 Vehicles available (%)
Vehicles available in owner-occupied houses - 3 Vehicles available (%)
Vehicles available in owner-occupied houses - 4 Vehicles available (%)
Vehicles available in owner-occupied houses - 5+ Vehicles available (%)
Vehicles available in renter-occupied houses - no vehicle available (%)
Vehicles available in renter-occupied houses - 1 vehicle available (%)
Vehicles available in renter-occupied houses - 2 Vehicles available (%)
Vehicles available in renter-occupied houses - 3 Vehicles available (%)
Vehicles available in renter-occupied houses - 4 Vehicles available (%)
Vehicles available in renter-occupied houses - 5+ Vehicles available (%)
Housing units in structures - 1, detached (%)
Housing units in structures - 1, attached (%)
Housing units in structures - 2 (%)
Housing units in structures - 3 or 4 (%)
Housing units in structures - 5 to 9 (%)
Housing units in structures - 10 to 19 (%)
Housing units in structures - 20 to 49 (%)
Housing units in structures - 50 or more (%)
Housing units in structures - Mobile home (%)
Housing units in structures - Boat, RV, van, etc. (%)
Housing units in structures - Owners - 1, detached (%)
Housing units in structures - Owners - 1, attached (%)
Housing units in structures - Owners - 2 (%)
Housing units in structures - Owners - 3 or 4 (%)
Housing units in structures - Owners - 5 to 9 (%)
Housing units in structures - Owners - 10 to 19 (%)
Housing units in structures - Owners - 20 to 49 (%)
Housing units in structures - Owners - 50 or more (%)
Housing units in structures - Owners - Mobile home (%)
Housing units in structures - Owners - Boat, RV, van, etc. (%)
Housing units in structures - Renters - 1, detached (%)
Housing units in structures - Renters - 1, attached (%)
Housing units in structures - Renters - 2 (%)
Housing units in structures - Renters - 3 or 4 (%)
Housing units in structures - Renters - 5 to 9 (%)
Housing units in structures - Renters - 10 to 19 (%)
Housing units in structures - Renters - 20 to 49 (%)
Housing units in structures - Renters - 50 or more (%)
Housing units in structures - Renters - Mobile home (%)
Housing units in structures - Renters - Boat, RV, van, etc. (%)
House/condo owner moved in on average (years ago)
Renter moved in on average (years ago)
Year householder moved into unit - Moved in 1999 to March 2000 (%)
Year householder moved into unit - Moved in 1999 to March 2000 (%) - White
Year householder moved into unit - Moved in 1999 to March 2000 (%) - Black or African American
Year householder moved into unit - Moved in 1999 to March 2000 (%) - Asian
Year householder moved into unit - Moved in 1999 to March 2000 (%) - Hispanic or Latino
Year householder moved into unit - Moved in 1999 to March 2000 (%) - American Indian and Alaska Native
Year householder moved into unit - Moved in 1999 to March 2000 (%) - Multirace
Year householder moved into unit - Moved in 1999 to March 2000 (%) - Other Race
Year householder moved into unit - Moved in 1995 to 1998 (%)
Year householder moved into unit - Moved in 1995 to 1998 (%) - White
Year householder moved into unit - Moved in 1995 to 1998 (%) - Black or African American
Year householder moved into unit - Moved in 1995 to 1998 (%) - Asian
Year householder moved into unit - Moved in 1995 to 1998 (%) - Hispanic or Latino
Year householder moved into unit - Moved in 1995 to 1998 (%) - American Indian and Alaska Native
Year householder moved into unit - Moved in 1995 to 1998 (%) - Multirace
Year householder moved into unit - Moved in 1995 to 1998 (%) - Other Race
Year householder moved into unit - Moved in 1990 to 1994 (%)
Year householder moved into unit - Moved in 1990 to 1994 (%) - White
Year householder moved into unit - Moved in 1990 to 1994 (%) - Black or African American
Year householder moved into unit - Moved in 1990 to 1994 (%) - Asian
Year householder moved into unit - Moved in 1990 to 1994 (%) - Hispanic or Latino
Year householder moved into unit - Moved in 1990 to 1994 (%) - American Indian and Alaska Native
Year householder moved into unit - Moved in 1990 to 1994 (%) - Multirace
Year householder moved into unit - Moved in 1990 to 1994 (%) - Other Race
Year householder moved into unit - Moved in 1980 to 1989 (%)
Year householder moved into unit - Moved in 1980 to 1989 (%) - White
Year householder moved into unit - Moved in 1980 to 1989 (%) - Black or African American
Year householder moved into unit - Moved in 1980 to 1989 (%) - Asian
Year householder moved into unit - Moved in 1980 to 1989 (%) - Hispanic or Latino
Year householder moved into unit - Moved in 1980 to 1989 (%) - American Indian and Alaska Native
Year householder moved into unit - Moved in 1980 to 1989 (%) - Multirace
Year householder moved into unit - Moved in 1980 to 1989 (%) - Other Race
Year householder moved into unit - Moved in 1970 to 1979 (%)
Year householder moved into unit - Moved in 1970 to 1979 (%) - White
Year householder moved into unit - Moved in 1970 to 1979 (%) - Black or African American
Year householder moved into unit - Moved in 1970 to 1979 (%) - Asian
Year householder moved into unit - Moved in 1970 to 1979 (%) - Hispanic or Latino
Year householder moved into unit - Moved in 1970 to 1979 (%) - American Indian and Alaska Native
Year householder moved into unit - Moved in 1970 to 1979 (%) - Multirace
Year householder moved into unit - Moved in 1970 to 1979 (%) - Other Race
Year householder moved into unit - Moved in 1969 or earlier (%)
Year householder moved into unit - Moved in 1969 or earlier (%) - White
Year householder moved into unit - Moved in 1969 or earlier (%) - Black or African American
Year householder moved into unit - Moved in 1969 or earlier (%) - Asian
Year householder moved into unit - Moved in 1969 or earlier (%) - Hispanic or Latino
Year householder moved into unit - Moved in 1969 or earlier (%) - American Indian and Alaska Native
Year householder moved into unit - Moved in 1969 or earlier (%) - Multirace
Year householder moved into unit - Moved in 1969 or earlier (%) - Other Race
Housing units lacking complete plumbing facilities (%)
Housing units lacking complete kitchen facilities (%)
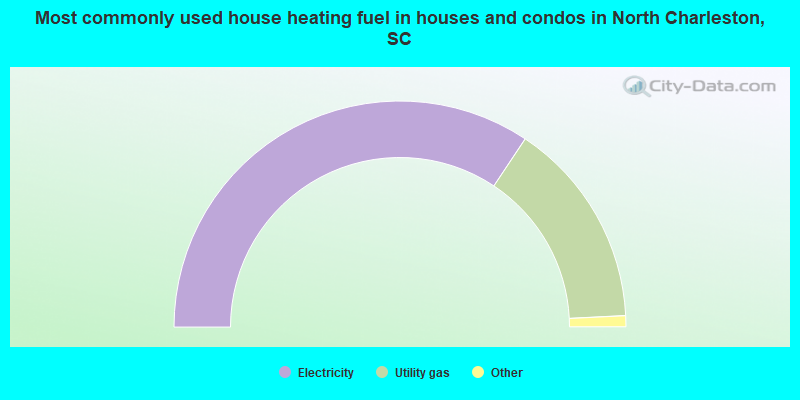
House heating fuel used in houses and condos - Utility gas (%)
House heating fuel used in houses and condos - Bottled, tank, or LP gas (%)
House heating fuel used in houses and condos - Electricity (%)
House heating fuel used in houses and condos - Fuel oil, kerosene, etc. (%)
House heating fuel used in houses and condos - Coal or coke (%)
House heating fuel used in houses and condos - Wood (%)
House heating fuel used in houses and condos - Solar energy (%)
House heating fuel used in houses and condos - Other fuel (%)
House heating fuel used in houses and condos - No fuel used (%)
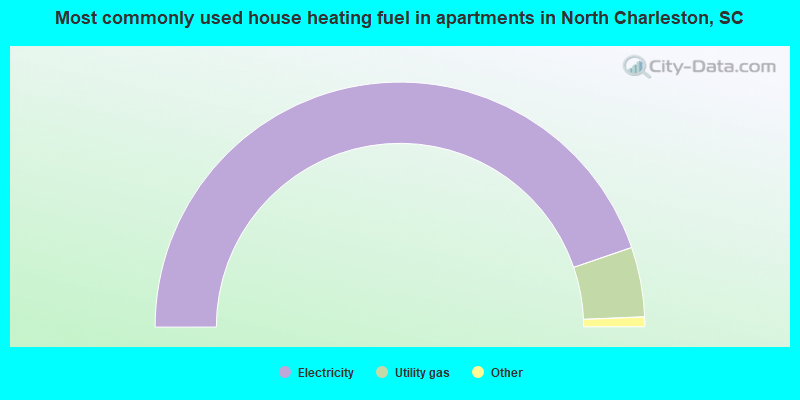
House heating fuel used in apartments - Utility gas (%)
House heating fuel used in apartments - Bottled, tank, or LP gas (%)
House heating fuel used in apartments - Electricity (%)
House heating fuel used in apartments - Fuel oil, kerosene, etc. (%)
House heating fuel used in apartments - Coal or coke (%)
House heating fuel used in apartments - Wood (%)
House heating fuel used in apartments - Solar energy (%)
House heating fuel used in apartments - Other fuel (%)
House heating fuel used in apartments - No fuel used (%)
Median year house/condo built: 2001Median year apartment built: 1990Household type by relationship:
Households: 118,604
Male householders: 21,319 (8,413 living alone ), Female householders: 26,364 (9,317 living alone )16,422 spouses (15,995 opposite-sex spouses ), 3,724 unmarried partners , (3,687 opposite-sex unmarried partners ), 34,551 children (31,957 natural , 1,175 adopted , 1,419 stepchildren ), 4,310 grandchildren , 1,261 brothers or sisters , 1,216 parents , 82 foster children , 2,765 other relatives , 3,278 non-relatives In group quarters: 3,312
Size of family households: 11,756 2-persons , 6,353 3-persons , 5,415 4-persons , 1,676 5-persons , 798 6-persons , 456 7-or-more-persons .
Size of nonfamily households: 17,730 1-person , 3,042 2-persons , 373 3-persons , 84 4-persons .
14,063 married couples with children. single-parent households (1,841 men , 7,269 women ).
85.7% of residents of North Charleston speak English at home. of residents speak Spanish at home (44% speak English very well , 26% speak English well , 25% speak English not well , 5% don't speak English at all ).of residents speak other Indo-European language at home (62% speak English very well , 16% speak English well , 22% speak English not well ).of residents speak Asian or Pacific Island language at home (68% speak English very well , 24% speak English well , 8% speak English not well ).of residents speak other language at home (95% speak English very well , 5% speak English well ).
Foreign born population: 8,749 (7.4%)of them are naturalized citizens )
Median number of rooms in houses and condos:
Median number of rooms in apartments
Owner-occupied Renter-occupied
Bedrooms in owner-occupied houses and condos in North Charleston, South Carolina
0 no bedroom 0 1 bedroom 1,780 2 bedrooms 13,123 3 bedrooms 6,032 4 bedrooms 1,587 5+ bedrooms
Bedrooms in renter-occupied apartments in North Charleston, South Carolina
1,439 no bedroom 7,219 1 bedroom 8,990 2 bedrooms 6,251 3 bedrooms 1,233 4 bedrooms 29 5+ bedrooms
Owner-occupied Renter-occupied
Rooms in owner-occupied houses in North Charleston, South Carolina
0 1 room 0 2 rooms 95 3 rooms 2,369 4 rooms 5,027 5 rooms 5,357 6 rooms 3,137 7 rooms 3,389 8 rooms 3,148 9+ rooms
Rooms in renter-occupied apartments in North Charleston, South Carolina
1,439 1 room 1,550 2 rooms 5,146 3 rooms 6,552 4 rooms 6,032 5 rooms 2,436 6 rooms 801 7 rooms 710 8 rooms 495 9+ rooms
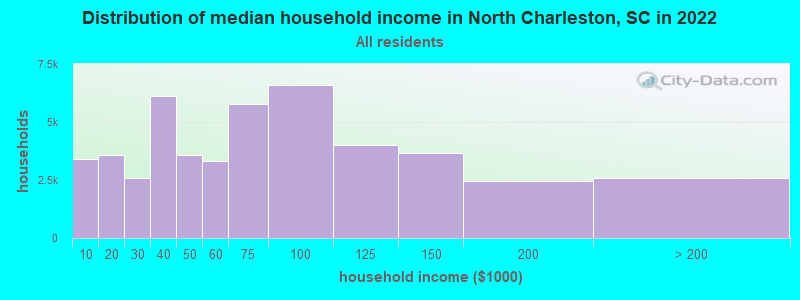
North Charleston, SC household income distribution 3,385 Less than $10,0003,588 $10,000 to $19,9992,586 $20,000 to $29,9996,138 $30,000 to $39,9993,590 $40,000 to $49,9993,335 $50,000 to $59,9995,768 $60,000 to $74,9996,598 $75,000 to $99,9993,988 $100,000 to $124,9993,666 $125,000 to $149,9992,449 $150,000 to $199,9992,592 $200,000 or more
Home value of owner - occupied houses in 2022 in North Charleston, SC 451 Less than $10,000236 $10,000 to $14,99988 $15,000 to $19,999223 $20,000 to $24,99988 $25,000 to $29,99999 $30,000 to $34,999124 $35,000 to $39,999228 $40,000 to $49,999106 $50,000 to $59,999160 $60,000 to $69,999329 $70,000 to $79,999116 $80,000 to $89,999203 $90,000 to $99,999855 $100,000 to $124,999604 $125,000 to $149,9991,394 $150,000 to $174,999978 $175,000 to $199,9992,487 $200,000 to $249,9992,887 $250,000 to $299,9994,393 $300,000 to $399,9991,772 $400,000 to $499,9991,029 $500,000 to $749,999292 $750,000 to $999,999102 $1,000,000 to $1,499,99984 $1,500,000 to $1,999,999147 $2,000,000 or moreRent paid by renters in 2022 in North Charleston, SC 228 Less than $100157 $100 to $149149 $150 to $19961 $200 to $249155 $250 to $299163 $300 to $349107 $350 to $399141 $400 to $449177 $450 to $499530 $500 to $549400 $550 to $599807 $600 to $649559 $650 to $699459 $700 to $749890 $750 to $7992,820 $800 to $8991,697 $900 to $9996,566 $1,000 to $1,2494,468 $1,250 to $1,4992,877 $1,500 to $1,999454 $2,000 to $2,49973 $2,500 to $2,99923 $3,000 to $3,49960 $3,500 or more232 No cash rent
Percentage of workers working in this county: 72.7%Number of people working at home: 5,446 (8.8% of all workers )
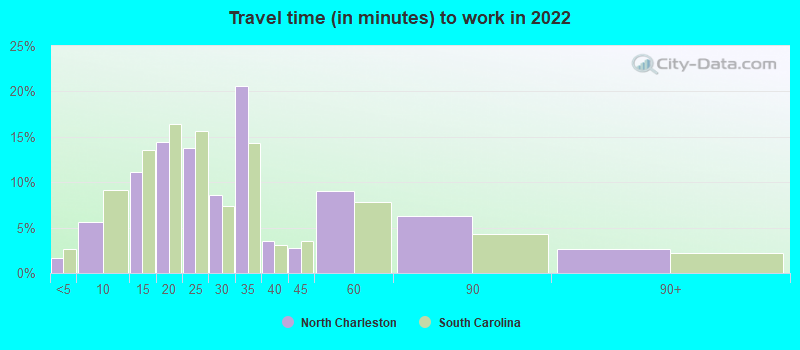
Travel time to work (commute)
Less than 5 minutes: 1,7235 to 9 minutes: 4,62010 to 14 minutes: 6,31615 to 19 minutes: 8,22420 to 24 minutes: 10,43025 to 29 minutes: 3,77030 to 34 minutes: 11,03135 to 39 minutes: 1,23140 to 44 minutes: 1,90945 to 59 minutes: 4,44560 to 89 minutes: 2,70090 or more minutes: 609
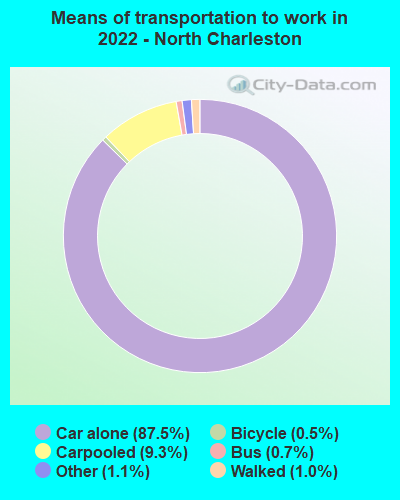
Means of transportation to work:
Drove a car alone: 81,393 (79.9%)Carpooled: 9,807 (9.6%)Bus : 610 (0.6%)Taxi: 855 (0.8%)Bicycle: 483 (0.5%)Walked: 1,043 (1.0%)Worked at home: 5,446 (5.3%)
Unemployment by race in 2022
Unemployment rate for White non-Hispanic residents 0.8% Males4.0% FemalesUnemployment rate for Black residents 2.7% Males9.9% FemalesUnemployment rate for Asian residents 4.6% Males2.5% FemalesUnemployment rate for other race residents 0.4% Males6.1% FemalesUnemployment rate for two or more race residents 6.7% Males9.0% FemalesUnemployment rate for Hispanic or Latino residents 1.0% Males8.2% Females
Year of entry for the foreign-born population in North Charleston, South Carolina
6,034 2010 or later 3,900 2000 to 2009 1,083 1990 to 1999 616 1980 to 1989 387 1970 to 1979 397 Before 1970
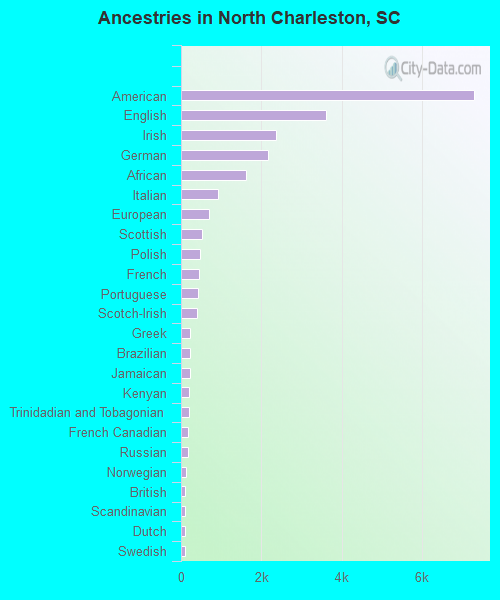
First ancestries reported:
American: 7,310 (9.5%)
English: 3,617 (4.7%)
Irish: 2,358 (3.1%)
German: 2,163 (2.8%)
African: 1,616 (2.1%)
Italian: 934 (1.2%)
European: 697 (0.9%)
Scottish: 530 (0.7%)
Polish: 474 (0.6%)
French: 456 (0.6%)
Portuguese: 425 (0.6%)
Scotch-Irish: 389 (0.5%)
Greek: 235 (0.3%)
Brazilian: 234 (0.3%)
Jamaican: 222 (0.3%)
Kenyan: 208 (0.3%)
Trinidadian and Tobagonian: 194 (0.3%)
French Canadian: 182 (0.2%)
Russian: 165 (0.2%)
Norwegian: 124 (0.2%)
British: 110 (0.1%)
Scandinavian: 107 (0.1%)
Dutch: 98 (0.1%)
Swedish: 90 (0.1%)
Ghanaian: 46 (0.06%)
Finnish: 42 (0.05%)
Romanian: 40 (0.05%)
Ukrainian: 39 (0.05%)
Hungarian: 34 (0.04%)
Welsh: 34 (0.04%)
Ethiopian: 29 (0.04%)
Swiss: 29 (0.04%)
Canadian: 28 (0.04%)
Iranian: 25 (0.03%)
Austrian: 24 (0.03%)
Haitian: 23 (0.03%)
Egyptian: 20 (0.03%)
Lebanese: 20 (0.03%)
Czech: 18 (0.02%)
Slovak: 18 (0.02%)
Latvian: 15 (0.02%)
Iraqi: 13 (0.02%)
Eastern European: 11 (0.01%)
Serbian: 10 (0.01%)
Turkish: 10 (0.01%)
Slavic: 8 (0.01%)
Danish: 4 (0.01%)
Most common places of birth for foreign-born residents (%): Mexico North Charleston:
25.7% (3,158)South Carolina:
22.5% (60,774)
India North Charleston:
10.7% (1,321)South Carolina:
6.8% (18,307)
Guatemala North Charleston:
8.8% (1,080)South Carolina:
3.4% (9,058)
Philippines North Charleston:
4.8% (594)South Carolina:
4.1% (11,031)
Honduras North Charleston:
4.0% (493)South Carolina:
4.8% (12,834)
Brazil North Charleston:
3.0% (375)South Carolina:
2.0% (5,344)
Dominican Republic North Charleston:
3.0% (364)South Carolina:
0.9% (2,357)
Canada North Charleston:
2.8% (348)South Carolina:
3.0% (8,193)
China, excluding Hong Kong and Taiwan North Charleston:
2.4% (297)South Carolina:
3.2% (8,721)
Portugal North Charleston:
2.0% (245)South Carolina:
0.3% (876)
Germany North Charleston:
1.9% (234)South Carolina:
3.7% (9,982)
Cuba North Charleston:
1.8% (227)South Carolina:
1.5% (3,987)
Jamaica North Charleston:
1.6% (198)South Carolina:
2.6% (7,073)
Vietnam North Charleston:
1.6% (196)South Carolina:
2.3% (6,308)
Place of birth for U.S.-born residents:
This state: 64,247Other state: 42,798Northeast: 8,463Midwest: 7,457South: 21,395West: 5,483 83.9% of North Charleston residents lived in the same house 1 years ago.
Out of people who lived in different houses, 28.3% lived in this county.
Out of people who lived in different counties, 40.8% lived in South Carolina.
North Charleston:
83.9%State average:
86.5%
Education attainment for males 25 years and older:
No schooling: 1,063Nursery to 4th grade: 05th and 6th grade: 2127th and 8th grade: 6249th grade: 40810th grade: 32711th grade: 2,00612th grade, no diploma: 645High school graduate (or equivalency): 10,316Less than 1 year of college: 2,799Some college more than 1 year, no degree: 6,450Associate degree: 2,693Bachelor's degree: 6,795Master's degree: 1,882Professional school degree: 442Doctorate degree: 210
Education attainment for females 25 years and older:
No schooling: 371Nursery to 4th grade: 765th and 6th grade: 817th and 8th grade: 5459th grade: 48010th grade: 44711th grade: 63412th grade, no diploma: 954High school graduate (or equivalency): 9,684Less than 1 year of college: 2,871Some college more than 1 year, no degree: 8,283Associate degree: 5,058Bachelor's degree: 7,232Master's degree: 3,072Professional school degree: 555Doctorate degree: 387
Housing units in structures:
One, detached: 25,198One, attached: 3,437Two: 1,8713 or 4: 2,4875 to 9: 4,62310 to 19: 3,96620 to 49: 4,73650 or more: 1,630Mobile homes: 3,898Median worth of mobile homes: $36,277
Housing units lacking complete plumbing facilities in 2022: 1.5%Housing units lacking complete kitchen facilities in 2022: 1.5%House/condo owner moved in on average 7 years ago
Renter moved in on average 2 years ago
Private vs. public school enrollment:
Students in private schools in grades 1 to 8 (elementary and middle school): 958 Here:
8.5%South Carolina:
14.4%
Students in private schools in grades 9 to 12 (high school): 972 Here:
18.8%South Carolina:
11.1%
Students in private undergraduate colleges: 1,849 Here:
29.2%South Carolina:
21.9%