North City, IL (Illinois) Houses and Residents
| North City: | $113,015 |
| Illinois: | $251,600 |
Mean price in 2022:
Detached houses: $121,403
Here: $121,403 State: $310,164 Mobile homes: $45,736
Here: $45,736 State: $78,855
Total population: 596 (Urban population: 331 (all inside urban clusters), Rural population: 312 (4 farm, 308 nonfarm))
Houses: 342 (323 occupied: 293 owner occupied, 34 renter occupied)
| % of renters here: | 10% |
| State: | 33% |
Housing density: 156 houses/condos per square mile
Median price asked for vacant for-sale houses and condos in 2022 in this county: $63,101.
Median contract rent in 2022: $569 (lower quartile is $523, upper quartile is $671)
Median gross rent in North City, IL in 2022: $903
Housing units in North City with a mortgage: 74 (2 second mortgage, 0 home equity loan, 2 both second mortgage and home equity loan)
Houses without a mortgage: 3
Median household income for houses/condos with a mortgage: $55,091
Median household income for apartments without a mortgage: $54,334
Median monthly housing costs: $620
Compare current foreclosures near North City, IL:
| Photo | Address | Area | Beds / Baths | Price | Details |
|---|---|---|---|---|---|

|
#1
N Maple St
Du Quoin, IL 62832
|
1,100 sq. feet
|
1 baths 2 beds |
$99,000
|
show details |

|
#2
Kim St
De Soto, IL 62924
|
1,260 sq. feet
|
2 baths 3 beds |
$125,000
|
show details |

|
#3
S Gardner St
West Frankfort, IL 62896
|
1,196 sq. feet
|
1 baths 3 beds |
$105,000
|
show details |

|
#4
E Cleveland St
West Frankfort, IL 62896
|
1,500 sq. feet
|
2 baths 3 beds |
show details | |

|
#5
Harmony Church Rd
West Frankfort, IL 62896
|
1,610 sq. feet
|
2 baths 3 beds |
show details | |

|
#6
N Buchanan St
Benton, IL 62812
|
2,304 sq. feet
|
2 baths 3 beds |
show details | |

|
#7
Cherry St
Vergennes, IL 62994
|
1,452 sq. feet
|
1 baths 3 beds |
show details | |

|
#8
E 7th St
West Frankfort, IL 62896
|
- sq. feet
|
2 baths 3 beds |
show details | |

|
#9
Holt St
Vergennes, IL 62994
|
836 sq. feet
|
1 baths 2 beds |
show details | |

|
#10
N Lincoln St
West Frankfort, IL 62896
|
729 sq. feet
|
1 baths 1 beds |
show details |
| Photo | Address | Area | Beds / Baths | Price | Details |
|---|---|---|---|---|---|

|
#11
Court H
Herrin, IL 62948
|
1,024 sq. feet
|
1 baths 3 beds |
show details | |

|
#12
Napolean Rd
Marion, IL 62959
|
920 sq. feet
|
2 baths 3 beds |
show details | |

|
#13
W Tyler St
Herrin, IL 62948
|
1,120 sq. feet
|
1 baths 2 beds |
show details | |

|
#14
N Division St
Carterville, IL 62918
|
1,442 sq. feet
|
1 baths 3 beds |
show details | |

|
#15
S T. Road
Mulkeytown, IL 62865
|
1,823 sq. feet
|
1 baths 3 beds |
show details | |

|
#16
N Division St
Carterville, IL 62918
|
- sq. feet
|
- baths - beds |
$14,900
|
show details |

|
#17
N Emma St
Christopher, IL 62822
|
- sq. feet
|
- baths - beds |
$19,900
|
show details |

|
#18
N Manering St
Royalton, IL 62983
|
- sq. feet
|
1 baths 3 beds |
show details | |

|
#19
S Douglas St
West Frankfort, IL 62896
|
1 sq. feet
|
1 baths 3 beds |
show details | |

|
#20
S 18th St
Herrin, IL 62948
|
- sq. feet
|
1 baths 3 beds |
show details |
| Photo | Address | Area | Beds / Baths | Price | Details |
|---|---|---|---|---|---|

|
#21
E Florence St
Sesser, IL 62884
|
- sq. feet
|
2 baths 3 beds |
show details | |

|
#22
W Reed St
Benton, IL 62812
|
1,712 sq. feet
|
- baths 3 beds |
show details | |

|
#23
W Ray Ave
Christopher, IL 62822
|
720 sq. feet
|
1 baths 2 beds |
show details | |

|
#24
N Horn St
West Frankfort, IL 62896
|
- sq. feet
|
- baths - beds |
$19,900
|
show details |

|
#25
Joplin St
Benton, IL 62812
|
1 sq. feet
|
1 baths 3 beds |
show details | |

|
#26
Main St
Carterville, IL 62918
|
910 sq. feet
|
- baths - beds |
show details | |

|
#27
N Maple St
Carterville, IL 62918
|
- sq. feet
|
- baths - beds |
show details | |

|
#28
W Broadway Blvd
Johnston City, IL 62951
|
- sq. feet
|
- baths - beds |
show details | |

|
#29
W 5th St
Johnston City, IL 62951
|
- sq. feet
|
- baths - beds |
show details | |

|
#30
Benton Ave
Johnston City, IL 62951
|
- sq. feet
|
- baths - beds |
show details |
| Photo | Address | Area | Beds / Baths | Price | Details |
|---|---|---|---|---|---|

|
#31
Harris School Rd
Johnston City, IL 62951
|
- sq. feet
|
- baths - beds |
show details | |

|
#32
Walker Rd
Johnston City, IL 62951
|
- sq. feet
|
- baths - beds |
show details | |

|
#33
Empress Ln
Herrin, IL 62948
|
- sq. feet
|
- baths - beds |
show details | |

|
#34
Adams Ave
Johnston City, IL 62951
|
- sq. feet
|
- baths - beds |
show details | |

|
#35
E 14th St # D
Johnston City, IL 62951
|
- sq. feet
|
- baths - beds |
show details | |

|
#36
Montebello Dr
Herrin, IL 62948
|
- sq. feet
|
- baths - beds |
show details | |

|
#37
Ween Rd
De Soto, IL 62924
|
- sq. feet
|
- baths - beds |
show details | |

|
#38
N 11th St
Herrin, IL 62948
|
- sq. feet
|
- baths - beds |
show details | |

|
#39
W Cherry St
Herrin, IL 62948
|
- sq. feet
|
- baths - beds |
show details | |

|
#40
Long Prairie Rd
Benton, IL 62812
|
- sq. feet
|
- baths - beds |
show details |
| Photo | Address | Area | Beds / Baths | Price | Details |
|---|---|---|---|---|---|

|
#41
N 19th St
Herrin, IL 62948
|
- sq. feet
|
- baths - beds |
show details | |

|
#42
N 35th St
Herrin, IL 62948
|
- sq. feet
|
- baths - beds |
show details | |

|
#43
N 17th St
Herrin, IL 62948
|
- sq. feet
|
- baths - beds |
show details | |

|
#44
Pierce Sq
Herrin, IL 62948
|
- sq. feet
|
- baths - beds |
show details | |

|
#45
Stardust Dr
Herrin, IL 62948
|
- sq. feet
|
- baths - beds |
show details | |

|
#46
Switch Back Rd
Mulkeytown, IL 62865
|
- sq. feet
|
- baths - beds |
show details | |

|
#47
Bevard St
Carterville, IL 62918
|
- sq. feet
|
- baths - beds |
show details | |

|
#48
S Division St
Carterville, IL 62918
|
- sq. feet
|
- baths - beds |
show details | |

|
#49
Rae Ln
Carterville, IL 62918
|
- sq. feet
|
- baths - beds |
show details | |

|
Check over 1 million property listings on Foreclosure.com!
|
browse all offers | |||


 | Chicago hate: Does the negativity bother you ? (342 replies) |
| Moving to Chicago from Missouri (49 replies) |

Median year apartment built: 1970
Household type by relationship:
Households: 687- Male householders: 205 (61 living alone), Female householders: 112 (26 living alone)
174 spouses (174 opposite-sex spouses), 22 unmarried partners, (22 opposite-sex unmarried partners), 113 children (101 natural, 4 adopted, 6 stepchildren), 26 grandchildren, 0 brothers or sisters, 0 parents, 3 foster children, 13 other relatives, 14 non-relatives
Size of family households: 102 2-persons, 59 3-persons, 16 4-persons, 1 5-persons, 9 6-persons.
Size of nonfamily households: 92 1-person, 42 2-persons, 6 3-persons.
44 married couples with children.
6 single-parent households (0 men, 6 women).
98.2% of residents of North City speak English at home.
0.6% of residents speak Spanish at home (100% speak English very well).
0.6% of residents speak Asian or Pacific Island language at home (100% speak English very well).
0.5% of residents speak other language at home (100% speak English very well).
Foreign born population: 9 (1.3%)
(22.2% of them are naturalized citizens)
| Here: | 6.1 |
| State: | 6.4 |
| Here: | 3.8 |
| State: | 4.1 |

- Bedrooms in owner-occupied houses and condos in North City, Illinois
- 0no bedroom
- 141 bedroom
- 1122 bedrooms
- 1383 bedrooms
- 204 bedrooms
- 85+ bedrooms

- Bedrooms in renter-occupied apartments in North City, Illinois
- 8no bedroom
- 01 bedroom
- 122 bedrooms
- 143 bedrooms
- 04 bedrooms
- 05+ bedrooms

- Cars and other vehicles available in North City in owner-occupied houses/condos
- 2no vehicle
- 591 vehicle
- 1772 vehicles
- 463 vehicles
- 24 vehicles
- 75+ vehicles

- Cars and other vehicles available in North City in renter-occupied apartments
- 6no vehicle
- 161 vehicle
- 122 vehicles
- 03 vehicles
- 04 vehicles
- 05+ vehicles

- Rooms in owner-occupied houses in North City, Illinois
- 01 room
- 22 rooms
- 133 rooms
- 94 rooms
- 845 rooms
- 616 rooms
- 647 rooms
- 488 rooms
- 119+ rooms

- Rooms in renter-occupied apartments in North City, Illinois
- 81 room
- 02 rooms
- 23 rooms
- 164 rooms
- 25 rooms
- 06 rooms
- 67 rooms
- 08 rooms
- 09+ rooms


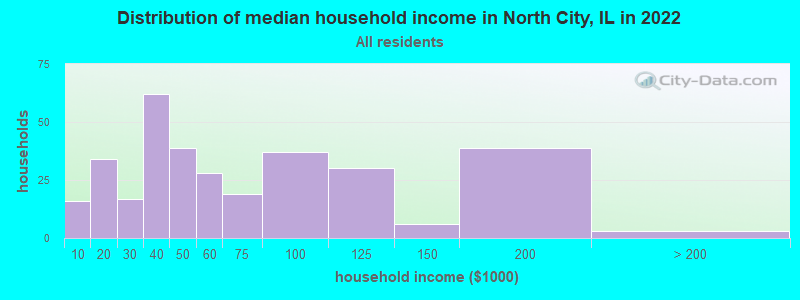
North City, IL household income distribution

- 16Less than $10,000
- 34$10,000 to $19,999
- 17$20,000 to $29,999
- 62$30,000 to $39,999
- 39$40,000 to $49,999
- 28$50,000 to $59,999
- 19$60,000 to $74,999
- 37$75,000 to $99,999
- 30$100,000 to $124,999
- 6$125,000 to $149,999
- 39$150,000 to $199,999
- 3$200,000 or more
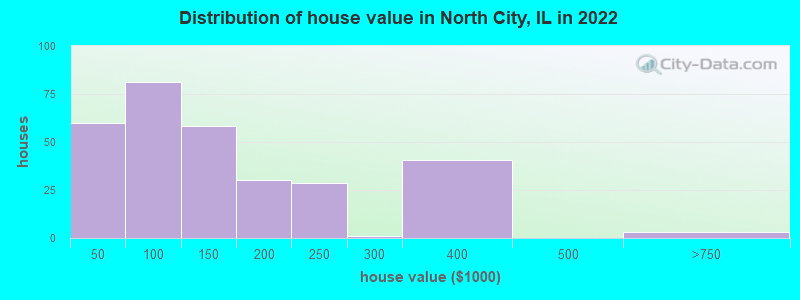
Home value of owner - occupied houses in 2022 in North City, IL
-
- 7$10,000 to $14,999
- 3$15,000 to $19,999
- 4$20,000 to $24,999
- 12$25,000 to $29,999
- 4$30,000 to $34,999
- 10$35,000 to $39,999
- 17$40,000 to $49,999
- 14$50,000 to $59,999
- 10$60,000 to $69,999
- 13$70,000 to $79,999
- 16$80,000 to $89,999
- 9$90,000 to $99,999
- 52$100,000 to $124,999
- 6$125,000 to $149,999
- 28$150,000 to $174,999
- 1$175,000 to $199,999
- 28$200,000 to $249,999
- 1$250,000 to $299,999
- 40$300,000 to $399,999
- 3$500,000 to $749,999
Rent paid by renters in 2022 in North City, IL
-
- 9$500 to $549
- 1$550 to $599
- 9$650 to $699
- 16No cash rent


Percentage of workers working in this county: 64.4%
Number of people working at home: 61 (21.9% of all workers)
Travel time to work (commute)
- Less than 5 minutes: 45
- 5 to 9 minutes: 14
- 10 to 14 minutes: 12
- 15 to 19 minutes: 40
- 20 to 24 minutes: 11
- 25 to 29 minutes: 6
- 30 to 34 minutes: 34
- 35 to 39 minutes: 3
- 40 to 44 minutes: 14
- 45 to 59 minutes: 28
- 60 to 89 minutes: 6
- 90 or more minutes: 2
Means of transportation to work:
- Drove a car alone: 199 (76.0%)
- Carpooled: 51 (19.5%)
- Walked: 6 (2.3%)
- Worked at home: 6 (2.3%)

- Unemployment by race in 2022
- Unemployment rate for White non-Hispanic residents
- 9.0%Males
- 4.1%Females
- Unemployment rate for two or more race residents
- 34.4%Males
- 100.0%Females

- Year of entry for the foreign-born population in North City, Illinois
- 02010 or later
- 82000 to 2009
- 01990 to 1999
- 01980 to 1989
- 01970 to 1979
- 9Before 1970

First ancestries reported:
- Italian: 87 (29.9%)
- American: 51 (17.5%)
- English: 46 (15.8%)
- German: 43 (14.8%)
- Polish: 23 (7.9%)
- French: 7 (2.4%)
- Irish: 5 (1.7%)
- Palestinian: 4 (1.4%)
- Scotch-Irish: 3 (1.0%)
- Danish: 1 (0.3%)
- Dutch: 1 (0.3%)
Most common places of birth for foreign-born residents (%):
| North City: | 33.3% (3) |
| Illinois: | 0.1% (1,630) |
| North City: | 33.3% (3) |
| Illinois: | 5.2% (93,003) |
| North City: | 11.1% (1) |
| Illinois: | 1.1% (19,306) |
Place of birth for U.S.-born residents:
- This state: 583
- Other state: 92
- Northeast: 21
- Midwest: 41
- South: 21
- West: 9
92.6% of North City residents lived in the same house 1 years ago.
Out of people who lived in different houses, 29.6% lived in this county.
Out of people who lived in different counties, 51.7% lived in Illinois.
| North City: | 92.6% |
| State average: | 88.3% |
Education attainment for males 25 years and older:
- No schooling: 0
- Nursery to 4th grade: 0
- 5th and 6th grade: 0
- 7th and 8th grade: 2
- 9th grade: 0
- 10th grade: 5
- 11th grade: 0
- 12th grade, no diploma: 13
- High school graduate (or equivalency): 127
- Less than 1 year of college: 41
- Some college more than 1 year, no degree: 44
- Associate degree: 35
- Bachelor's degree: 31
- Master's degree: 0
- Professional school degree: 0
- Doctorate degree: 0

Education attainment for females 25 years and older:
- No schooling: 0
- Nursery to 4th grade: 0
- 5th and 6th grade: 0
- 7th and 8th grade: 0
- 9th grade: 0
- 10th grade: 0
- 11th grade: 5
- 12th grade, no diploma: 3
- High school graduate (or equivalency): 78
- Less than 1 year of college: 49
- Some college more than 1 year, no degree: 49
- Associate degree: 39
- Bachelor's degree: 12
- Master's degree: 4
- Professional school degree: 0
- Doctorate degree: 0


Housing units in structures:
- One, detached: 281
- One, attached: 5
- Mobile homes: 56
Median worth of mobile homes: $70,704
Housing units lacking complete kitchen facilities in 2022: 2.6%
House/condo owner moved in on average 27 years ago
Renter moved in on average 2 years ago

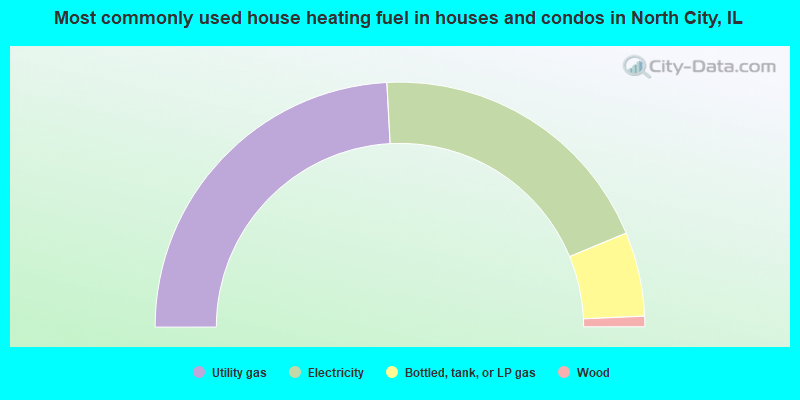
- 48.3%Utility gas
- 39.2%Electricity
- 11.1%Bottled, tank, or LP gas
- 1.4%Wood
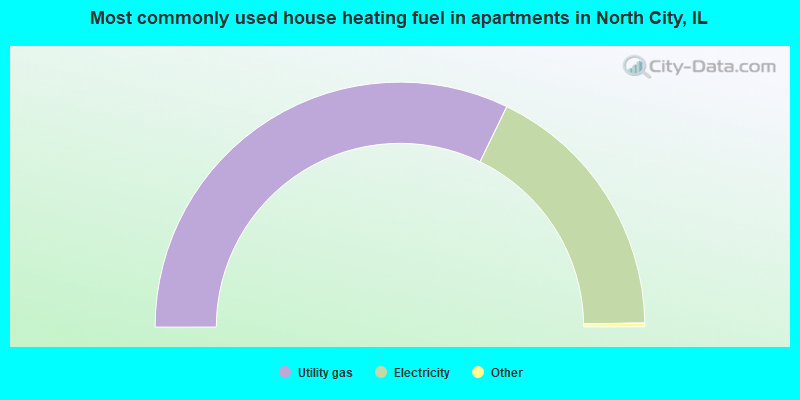
- 64.7%Utility gas
- 35.3%Electricity
Private vs. public school enrollment:
| Here: | 0.0% |
| Illinois: | 13.3% |
| Here: | 0.0% |
| Illinois: | 9.9% |
| Here: | 40.0% |
| Illinois: | 27.4% |


