Housing density: 701 houses/condos per square mile
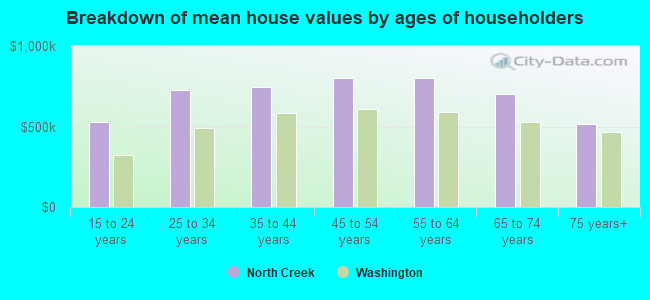
Median price asked for vacant for-sale houses and condos in 2022 in this county: $628,500.
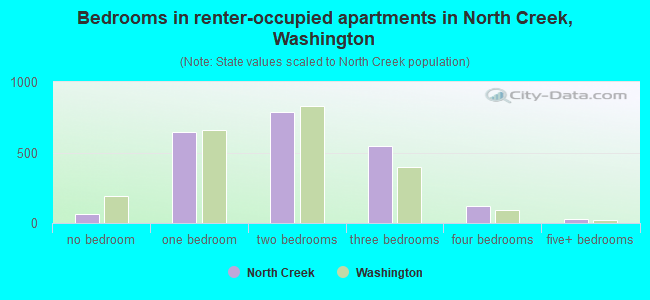
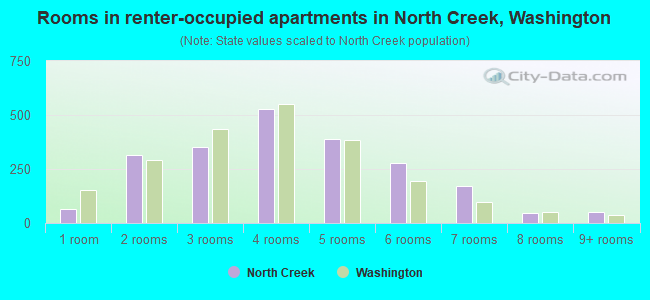
Median contract rent in 2022: over $2,000 (lower quartile is $1,785, upper quartile is over $2,000)
Median rent asked for vacant for-rent units in 2022: $2,181
Median gross rent in North Creek, WA in 2022: over $2,000
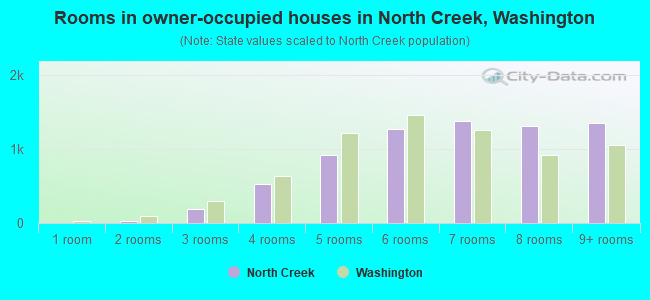
Housing units in North Creek with a mortgage: 5,265 (696 second mortgage, 606 home equity loan, 35 both second mortgage and home equity loan) Houses without a mortgage: 531
Compare current foreclosures near North Creek, WA:
In family households: 589,694 (132,675 male householders, 49,607 female householders)
140,500 spouses, 208,748 children (193,212 natural, 5,027 adopted, 10,509 stepchildren), 9,881 grandchildren, 6,965 brothers or sisters, 6,533 parents, foster children, 9,131 other relatives, 20,713 non-relatives
In nonfamily households: 113,244 (43,016 male householders (30,707 living alone)), 43,027 female householders (34,612 living alone)), 27,201 nonrelatives
In group quarters: 10,397 (5,769 institutionalized population)
121,078 married couples with children.
33,184 single-parent households (9,051 men, 24,133 women).
89.6% of residents of North Creek speak English at home.
3.0% of residents speak Spanish at home (63% speak English very well, 20% speak English well, 16% speak English not well, 2% don't speak English at all).
3.0% of residents speak other Indo-European language at home (64% speak English very well, 21% speak English well, 12% speak English not well, 3% don't speak English at all).
4.1% of residents speak Asian or Pacific Island language at home (51% speak English very well, 29% speak English well, 17% speak English not well, 3% don't speak English at all).
0.3% of residents speak other language at home (51% speak English very well, 36% speak English well, 13% speak English not well).
Foreign born population: 5,596 (15.5%)
(52.9% of them are naturalized citizens)
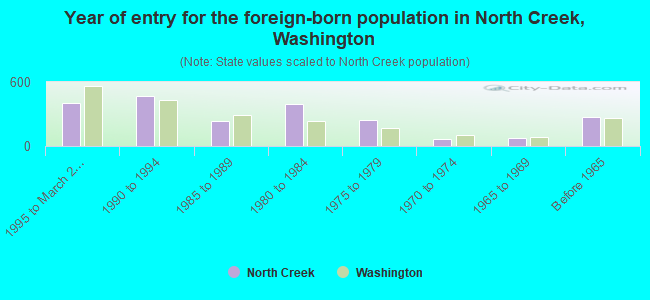
Year of entry for the foreign-born population in North Creek, Washington
4071995 to March 2000
4721990 to 1994
2351985 to 1989
3921980 to 1984
2411975 to 1979
611970 to 1974
711965 to 1969
268Before 1965
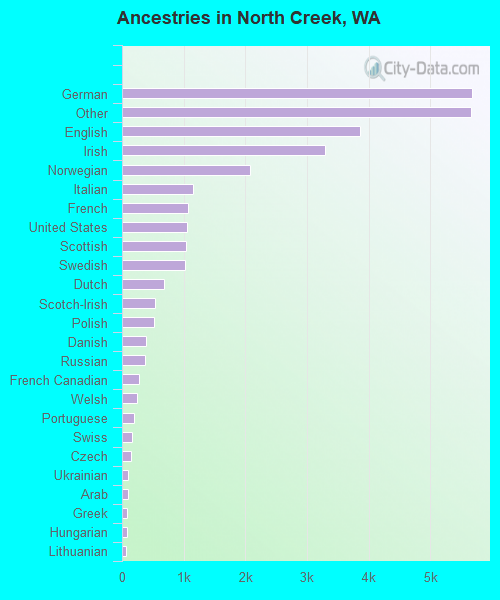
First ancestries reported:
German: 5,668 (18.9%)
Other: 5,659 (18.9%)
English: 3,860 (12.9%)
Irish: 3,299 (11.0%)
Norwegian: 2,079 (6.9%)
Italian: 1,153 (3.9%)
French: 1,064 (3.6%)
United States: 1,057 (3.5%)
Scottish: 1,033 (3.5%)
Swedish: 1,029 (3.4%)
Dutch: 677 (2.3%)
Scotch-Irish: 531 (1.8%)
Polish: 527 (1.8%)
Danish: 390 (1.3%)
Russian: 371 (1.2%)
French Canadian: 275 (0.9%)
Welsh: 249 (0.8%)
Portuguese: 187 (0.6%)
Swiss: 161 (0.5%)
Czech: 140 (0.5%)
Ukrainian: 100 (0.3%)
Arab: 94 (0.3%)
Greek: 77 (0.3%)
Hungarian: 74 (0.2%)
Lithuanian: 64 (0.2%)
West Indian: 57 (0.2%)
Subsaharan African: 28 (0.09%)
Slovak: 19 (0.06%)
Most common places of birth for foreign-born residents (%):
Mexico
North Creek:
11.0% (236)
Washington:
24.1% (148,115)
Canada
North Creek:
9.8% (211)
Washington:
7.7% (47,568)
Vietnam
North Creek:
9.0% (194)
Washington:
6.7% (40,879)
Korea
North Creek:
8.9% (192)
Washington:
6.2% (38,172)
Cambodia
North Creek:
7.9% (170)
Washington:
1.7% (10,656)
Philippines
North Creek:
6.0% (129)
Washington:
7.6% (46,733)
India
North Creek:
5.3% (114)
Washington:
2.4% (14,714)
Iran
North Creek:
4.4% (94)
Washington:
0.7% (4,573)
Russia
North Creek:
4.0% (85)
Washington:
2.5% (15,491)
United Kingdom
North Creek:
3.9% (83)
Washington:
3.3% (20,321)
Thailand
North Creek:
2.2% (47)
Washington:
1.0% (6,294)
Sweden
North Creek:
2.1% (46)
Washington:
0.4% (2,213)
Other Eastern Africa
North Creek:
2.0% (43)
Washington:
1.0% (6,438)
Ukraine
North Creek:
1.6% (35)
Washington:
3.0% (18,572)
Hong Kong
North Creek:
1.6% (34)
Washington:
1.0% (6,263)
Place of birth for U.S.-born residents:
This state: 13,840
Other state: 9,715
Northeast: 1,060
Midwest: 2,428
South: 1,111
West: 5,116
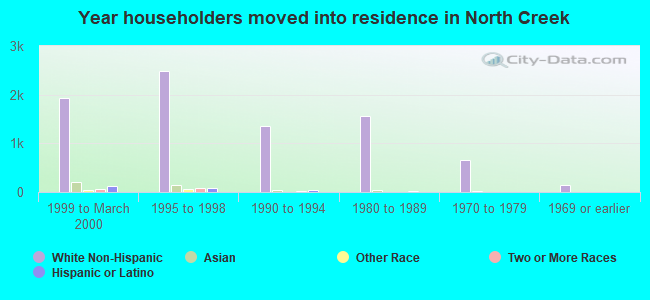
49% of North Creek residents lived in the same house 5 years ago. Out of people who lived in different houses, 35% lived in this county. Out of people who lived in different counties, 68% lived in Washington.
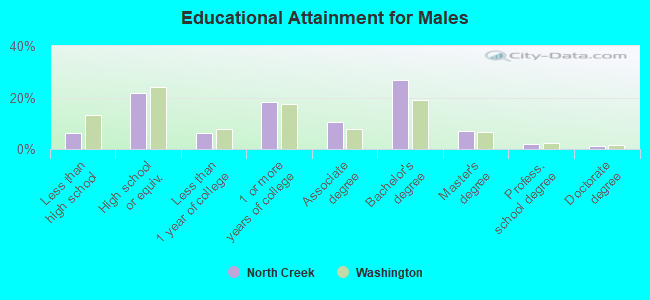
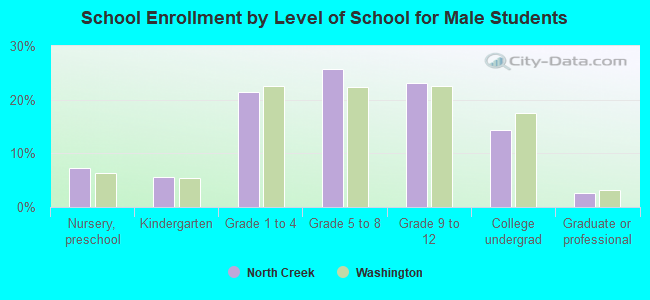
Education attainment for males 25 years and older:
No schooling: 34
Nursery to 4th grade: 5
5th and 6th grade: 24
7th and 8th grade: 41
9th grade: 55
10th grade: 89
11th grade: 92
12th grade, no diploma: 169
High school graduate (or equivalency): 1,756
Less than 1 year of college: 494
Some college more than 1 year, no degree: 1,484
Associate degree: 861
Bachelor's degree: 2,168
Master's degree: 567
Professional school degree: 150
Doctorate degree: 109
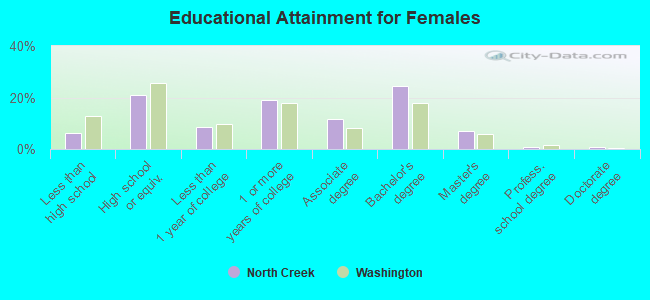
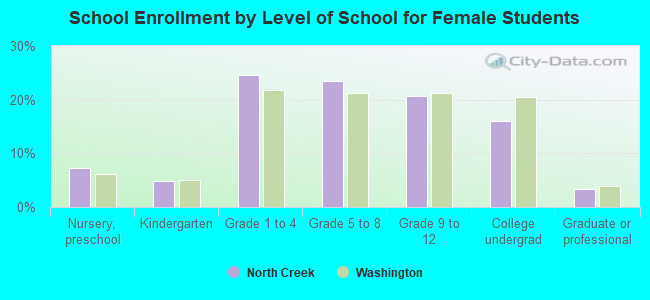
Education attainment for females 25 years and older:
No schooling: 51
Nursery to 4th grade: 8
5th and 6th grade: 19
7th and 8th grade: 12
9th grade: 101
10th grade: 44
11th grade: 123
12th grade, no diploma: 153
High school graduate (or equivalency): 1,733
Less than 1 year of college: 713
Some college more than 1 year, no degree: 1,565
Associate degree: 939
Bachelor's degree: 2,003
Master's degree: 584
Professional school degree: 71
Doctorate degree: 70
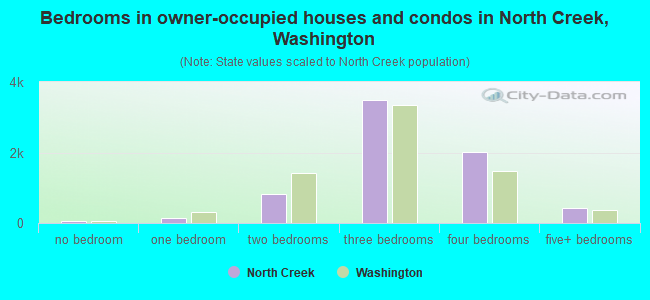
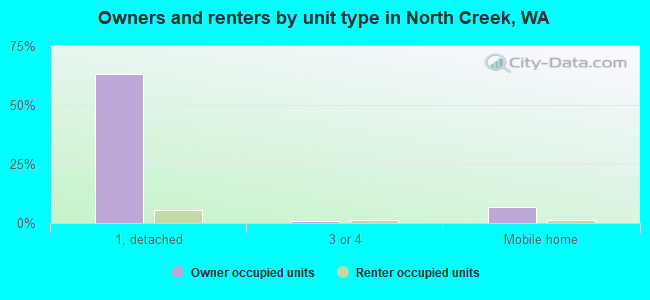
Housing units in structures:
One, detached: 6,375
One, attached: 509
Two: 68
3 or 4: 198
5 to 9: 366
10 to 19: 457
20 to 49: 472
50 or more: 306
Mobile homes: 777
Median worth of mobile homes: $121,912
Housing units lacking complete plumbing facilities: 0.3%
Housing units lacking complete kitchen facilities: 0.5%