Housing density: 128 houses/condos per square mile
Median price asked for vacant for-sale houses and condos in 2022 in this county: $227,726.
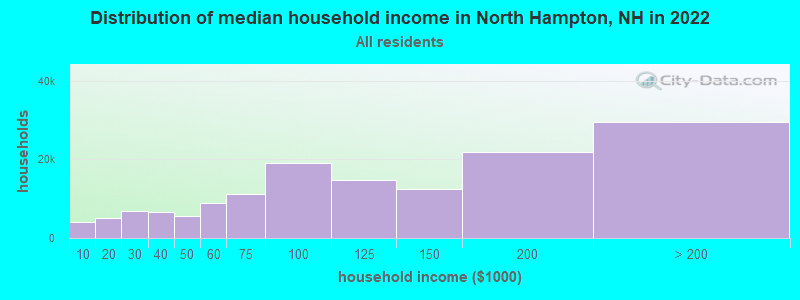
Median contract rent in 2022: $1,440 (lower quartile is $1,077, upper quartile is $1,782)
Median rent asked for vacant for-rent units in 2022: $1,504
Median gross rent in North Hampton, NH in 2022: $1,546
Housing units in North Hampton with a mortgage: 667 (56 second mortgage, 60 home equity loan, 0 both second mortgage and home equity loan) Houses without a mortgage: 386
Compare current foreclosures near North Hampton, NH:
In family households: 247,693 (57,848 male householders, 21,984 female householders)
64,858 spouses, 85,601 children (80,134 natural, 2,077 adopted, 3,390 stepchildren), 3,954 grandchildren, 1,562 brothers or sisters, 2,352 parents, foster children, 1,664 other relatives, 5,842 non-relatives
In nonfamily households: 45,032 (17,024 male householders (12,402 living alone)), 18,177 female householders (14,574 living alone)), 9,831 nonrelatives
In group quarters: 2,498 (1,438 institutionalized population)
57,723 married couples with children.
11,266 single-parent households (3,032 men, 8,234 women).
96.6% of residents of North Hampton speak English at home.
1.1% of residents speak Spanish at home (67% speak English very well, 33% speak English well).
1.9% of residents speak other Indo-European language at home (65% speak English very well, 35% speak English well).
0.2% of residents speak Asian or Pacific Island language at home (100% speak English well).
0.1% of residents speak other language at home (100% speak English very well).
Foreign born population: 153 (3.1%)
(71.2% of them are naturalized citizens)
Year of entry for the foreign-born population in North Hampton, New Hampshire
251995 to March 2000
51990 to 1994
01985 to 1989
61980 to 1984
01975 to 1979
41970 to 1974
121965 to 1969
42Before 1965
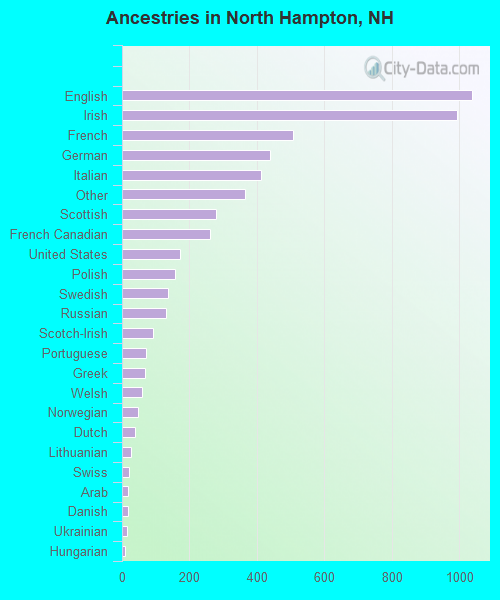
First ancestries reported:
English: 1,037 (19.3%)
Irish: 995 (18.5%)
French: 507 (9.4%)
German: 438 (8.1%)
Italian: 411 (7.6%)
Other: 365 (6.8%)
Scottish: 279 (5.2%)
French Canadian: 261 (4.8%)
United States: 173 (3.2%)
Polish: 156 (2.9%)
Swedish: 137 (2.5%)
Russian: 130 (2.4%)
Scotch-Irish: 93 (1.7%)
Portuguese: 70 (1.3%)
Greek: 67 (1.2%)
Welsh: 60 (1.1%)
Norwegian: 47 (0.9%)
Dutch: 40 (0.7%)
Lithuanian: 28 (0.5%)
Swiss: 22 (0.4%)
Arab: 18 (0.3%)
Danish: 17 (0.3%)
Ukrainian: 15 (0.3%)
Hungarian: 10 (0.2%)
Czech: 7 (0.1%)
Most common places of birth for foreign-born residents (%):
United Kingdom
North Hampton:
24.5% (23)
New Hampshire:
8.1% (4,396)
Canada
North Hampton:
13.8% (13)
New Hampshire:
22.9% (12,397)
Netherlands
North Hampton:
10.6% (10)
New Hampshire:
0.9% (471)
Other Eastern Europe
North Hampton:
10.6% (10)
New Hampshire:
1.5% (786)
Colombia
North Hampton:
9.6% (9)
New Hampshire:
1.7% (940)
Spain
North Hampton:
7.4% (7)
New Hampshire:
0.5% (294)
Germany
North Hampton:
6.4% (6)
New Hampshire:
4.9% (2,670)
Lebanon
North Hampton:
6.4% (6)
New Hampshire:
0.9% (489)
Romania
North Hampton:
5.3% (5)
New Hampshire:
0.9% (483)
Iran
North Hampton:
5.3% (5)
New Hampshire:
0.6% (338)
Place of birth for U.S.-born residents:
This state: 1,428
Other state: 2,719
Northeast: 2,193
Midwest: 168
South: 195
West: 163
62% of North Hampton residents lived in the same house 5 years ago. Out of people who lived in different houses, 50% lived in this county. Out of people who lived in different counties, 21% lived in New Hampshire.
Education attainment for males 25 years and older:
No schooling: 42
Nursery to 4th grade: 0
5th and 6th grade: 0
7th and 8th grade: 10
9th grade: 17
10th grade: 15
11th grade: 33
12th grade, no diploma: 28
High school graduate (or equivalency): 359
Less than 1 year of college: 72
Some college more than 1 year, no degree: 192
Associate degree: 85
Bachelor's degree: 392
Master's degree: 134
Professional school degree: 51
Doctorate degree: 46
Education attainment for females 25 years and older:
No schooling: 39
Nursery to 4th grade: 0
5th and 6th grade: 15
7th and 8th grade: 11
9th grade: 11
10th grade: 16
11th grade: 13
12th grade, no diploma: 30
High school graduate (or equivalency): 387
Less than 1 year of college: 88
Some college more than 1 year, no degree: 250
Associate degree: 121
Bachelor's degree: 389
Master's degree: 187
Professional school degree: 26
Doctorate degree: 14
Housing units in structures:
One, detached: 1,349
One, attached: 19
Two: 41
3 or 4: 35
5 to 9: 30
10 to 19: 21
Mobile homes: 287
Median worth of mobile homes: $168,973
Housing units lacking complete plumbing facilities: 0.4%