North Haven, CT (Connecticut) Houses and Residents
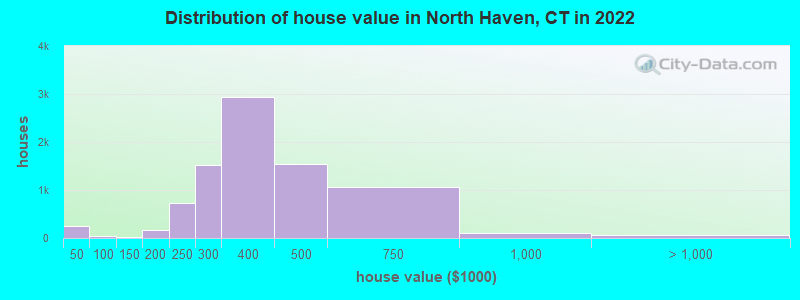
Estimated median house or condo value in 2022: $369,510 (it was $178,400 in 2000 )
North Haven:
$369,510Connecticut:
$347,200
Lower value quartile - upper value quartile: $298,109 - $461,088Mean price in 2022: Detached houses: $345,128 Here:
$345,128State:
$503,946
Townhouses or other attached units: $295,661 Here:
$295,661State:
$304,959
In 2-unit structures: $345,425 Here:
$345,425State:
$304,133
In 3-to-4-unit structures: $182,725 Here:
$182,725State:
$272,970
In 5-or-more-unit structures: $153,114 Here:
$153,114State:
$249,308
Total population: 24,093 (Urban population: 23,035, Rural population: 0)
Houses: 9,931 (9,614 occupied: 8,020 owner occupied, 1,700 renter occupied )
% of renters here:
17%State:
34%
Housing density: 478 houses/condos per square mile
Median price asked for vacant for-sale houses and condos in 2022: $888,926.
Median contract rent in 2022: $1,248 (lower quartile is $1,030, upper quartile is $1,756)
Median rent asked for vacant for-rent units in 2022: $1,015
Median gross rent in North Haven, CT in 2022: $1,430
Housing units in North Haven with a mortgage: 5,320 (673 second mortgage, 0 home equity loan, 508 both second mortgage and home equity loan )Houses without a mortgage: 346
Median household income for houses/condos with a mortgage: $136,549
Median household income for apartments without a mortgage: $106,556
Median monthly housing costs: $1,783
Data:
Median house or condo value ($)
Median house or condo value ($ change since 2000)
Median house or condo value ($) - White
Median house or condo value ($) - Black or African American
Median house or condo value ($) - Asian
Median house or condo value ($) - Hispanic or Latino
Median house or condo value ($) - American Indian and Alaska Native
Median house or condo value ($) - Multirace
Median house or condo value ($) - Other Race
Median price asked for mobile homes ($)
Household density (households per square mile)
Mean house or condo value by units in structure - 1, detached ($)
Mean house or condo value by units in structure - 1, attached ($)
Mean house or condo value by units in structure - 2 ($)
Mean house or condo value by units in structure by units in structure - 3 or 4 ($)
Mean house or condo value by units in structure - 5 or more ($)
Mean house or condo value by units in structure - Boat, RV, van, etc. ($)
Mean house or condo value by units in structure - Mobile home ($)
Median contract rent ($)
Median contract rent - Lower quartile ($)
Median contract rent - Upper quartile ($)
Median gross rent ($)
Urban houses (%)
Rural houses (%)
Houses occupied (%)
Houses occupied (% change since 2000)
Houses owner occupied (%)
Houses owner occupied (% change since 2000)
Houses renter occupied (%)
Houses renter occupied (% change since 2000)
Vacant housing units - For rent (%)
Vacant housing units - For rent (% change since 2000)
Vacant housing units - For sale only (%)
Vacant housing units - For sale only (% change since 2000)
Vacant housing units - Rented or sold, not occupied (%)
Vacant housing units - Rented or sold, not occupied (% change since 2000)
Vacant housing units - For seasonal, recreational, or occasional use (%)
Vacant housing units - For seasonal, recreational, or occasional use (% change since 2000)
Vacant housing units - For migrant workers (%)
Vacant housing units - For migrant workers (% change since 2000)
Vacant housing units - Other vacant (%)
Vacant housing units - Other vacant (% change since 2000)
Median monthly housing costs ($)
Median household income for houses/condos with a mortgage ($)
Median household income for houses/condos without a mortgage ($)
Median household income ($)
Median household income ($) - White
Median household income ($) - Black or African American
Median household income ($) - Asian
Median household income ($) - Hispanic or Latino
Median household income ($) - American Indian and Alaska Native
Median household income ($) - Multirace
Median household income ($) - Other Race
Mortgage status - with mortgage (%)
Mortgage status - with second mortgage (%)
Mortgage status - with home equity loan (%)
Mortgage status - with both second mortgage and home equity loan (%)
Mortgage status - without a mortgage (%)
Median year house/condo built
Median year apartment built
Household type by relationship - Male householder living alone (%)
Household type by relationship - Male householder not living alone (%)
Household type by relationship - Female householder living alone (%)
Household type by relationship - Female householder not living alone (%)
Household type by relationship - Opposite-Sex spouse (%)
Household type by relationship - Same-Sex spouse (%)
Household type by relationship - Opposite-Sex unmarried partner (%)
Household type by relationship - Same-Sex unmarried partner (%)
Household type by relationship - In group quarters (%)
Size of family households - 2-person household (%)
Size of family households - 3-person household (%)
Size of family households - 4-person household (%)
Size of family households - 5-person household (%)
Size of family households - 6-person household (%)
Size of family households - 7-or-more-person household (%)
Size of nonfamily households - 1-person household (%)
Size of nonfamily households - 2-person household (%)
Size of nonfamily households - 3-person household (%)
Size of nonfamily households - 4-person household (%)
Size of nonfamily households - 5-person household (%)
Size of nonfamily households - 6-person household (%)
Size of nonfamily households - 7-or-moreperson household (%)
Year house built - Built 2010 or later (%)
Year house built - Built 2000 to 2009 (%)
Year house built - Built 1990 to 1999 (%)
Year house built - Built 1980 to 1989 (%)
Year house built - Built 1970 to 1979 (%)
Year house built - Built 1960 to 1969 (%)
Year house built - Built 1950 to 1959 (%)
Year house built - Built 1940 to 1949 (%)
Year house built - Built 1939 or earlier (%)
Median number of rooms in houses and condos
Median number of rooms in apartments
Median number of bedrooms in owner occupied houses
Mean number of bedrooms in owner occupied houses
Median number of bedrooms in renter occupied houses
Mean number of bedrooms in renter occupied houses
Median number of vehichles in owner occupied houses
Mean number of vehichles in owner occupied houses
Median number of vehichles in renter occupied houses
Mean number of vehichles in renter occupied houses
Rooms in owner-occupied houses - 1 room (%)
Rooms in owner-occupied houses - 2 rooms (%)
Rooms in owner-occupied houses - 3 rooms (%)
Rooms in owner-occupied houses - 4 rooms (%)
Rooms in owner-occupied houses - 5 rooms (%)
Rooms in owner-occupied houses - 6 rooms (%)
Rooms in owner-occupied houses - 7 rooms (%)
Rooms in owner-occupied houses - 8 rooms (%)
Rooms in owner-occupied houses - 9+ rooms (%)
Rooms in renter-occupied houses - 1 room (%)
Rooms in renter-occupied houses - 2 rooms (%)
Rooms in renter-occupied houses - 3 rooms (%)
Rooms in renter-occupied houses - 4 rooms (%)
Rooms in renter-occupied houses - 5 rooms (%)
Rooms in renter-occupied houses - 6 rooms (%)
Rooms in renter-occupied houses - 7 rooms (%)
Rooms in renter-occupied houses - 8 rooms (%)
Rooms in renter-occupied houses - 9+ rooms (%)
Bedrooms in owner-occupied houses - no bedrooms (%)
Bedrooms in owner-occupied houses - 1 bedroom (%)
Bedrooms in owner-occupied houses - 2 bedrooms (%)
Bedrooms in owner-occupied houses - 3 bedrooms (%)
Bedrooms in owner-occupied houses - 4 bedrooms (%)
Bedrooms in owner-occupied houses - 5+ bedrooms (%)
Bedrooms in renter-occupied houses - no bedrooms (%)
Bedrooms in renter-occupied houses - 1 bedroom (%)
Bedrooms in renter-occupied houses - 2 bedrooms (%)
Bedrooms in renter-occupied houses - 3 bedrooms (%)
Bedrooms in renter-occupied houses - 4 bedrooms (%)
Bedrooms in renter-occupied houses - 5+ bedrooms (%)
Vehicles available in owner-occupied houses - no vehicle available (%)
Vehicles available in owner-occupied houses - 1 vehicle available(%)
Vehicles available in owner-occupied houses - 2 Vehicles available (%)
Vehicles available in owner-occupied houses - 3 Vehicles available (%)
Vehicles available in owner-occupied houses - 4 Vehicles available (%)
Vehicles available in owner-occupied houses - 5+ Vehicles available (%)
Vehicles available in renter-occupied houses - no vehicle available (%)
Vehicles available in renter-occupied houses - 1 vehicle available (%)
Vehicles available in renter-occupied houses - 2 Vehicles available (%)
Vehicles available in renter-occupied houses - 3 Vehicles available (%)
Vehicles available in renter-occupied houses - 4 Vehicles available (%)
Vehicles available in renter-occupied houses - 5+ Vehicles available (%)
Housing units in structures - 1, detached (%)
Housing units in structures - 1, attached (%)
Housing units in structures - 2 (%)
Housing units in structures - 3 or 4 (%)
Housing units in structures - 5 to 9 (%)
Housing units in structures - 10 to 19 (%)
Housing units in structures - 20 to 49 (%)
Housing units in structures - 50 or more (%)
Housing units in structures - Mobile home (%)
Housing units in structures - Boat, RV, van, etc. (%)
Housing units in structures - Owners - 1, detached (%)
Housing units in structures - Owners - 1, attached (%)
Housing units in structures - Owners - 2 (%)
Housing units in structures - Owners - 3 or 4 (%)
Housing units in structures - Owners - 5 to 9 (%)
Housing units in structures - Owners - 10 to 19 (%)
Housing units in structures - Owners - 20 to 49 (%)
Housing units in structures - Owners - 50 or more (%)
Housing units in structures - Owners - Mobile home (%)
Housing units in structures - Owners - Boat, RV, van, etc. (%)
Housing units in structures - Renters - 1, detached (%)
Housing units in structures - Renters - 1, attached (%)
Housing units in structures - Renters - 2 (%)
Housing units in structures - Renters - 3 or 4 (%)
Housing units in structures - Renters - 5 to 9 (%)
Housing units in structures - Renters - 10 to 19 (%)
Housing units in structures - Renters - 20 to 49 (%)
Housing units in structures - Renters - 50 or more (%)
Housing units in structures - Renters - Mobile home (%)
Housing units in structures - Renters - Boat, RV, van, etc. (%)
House/condo owner moved in on average (years ago)
Renter moved in on average (years ago)
Year householder moved into unit - Moved in 1999 to March 2000 (%)
Year householder moved into unit - Moved in 1999 to March 2000 (%) - White
Year householder moved into unit - Moved in 1999 to March 2000 (%) - Black or African American
Year householder moved into unit - Moved in 1999 to March 2000 (%) - Asian
Year householder moved into unit - Moved in 1999 to March 2000 (%) - Hispanic or Latino
Year householder moved into unit - Moved in 1999 to March 2000 (%) - American Indian and Alaska Native
Year householder moved into unit - Moved in 1999 to March 2000 (%) - Multirace
Year householder moved into unit - Moved in 1999 to March 2000 (%) - Other Race
Year householder moved into unit - Moved in 1995 to 1998 (%)
Year householder moved into unit - Moved in 1995 to 1998 (%) - White
Year householder moved into unit - Moved in 1995 to 1998 (%) - Black or African American
Year householder moved into unit - Moved in 1995 to 1998 (%) - Asian
Year householder moved into unit - Moved in 1995 to 1998 (%) - Hispanic or Latino
Year householder moved into unit - Moved in 1995 to 1998 (%) - American Indian and Alaska Native
Year householder moved into unit - Moved in 1995 to 1998 (%) - Multirace
Year householder moved into unit - Moved in 1995 to 1998 (%) - Other Race
Year householder moved into unit - Moved in 1990 to 1994 (%)
Year householder moved into unit - Moved in 1990 to 1994 (%) - White
Year householder moved into unit - Moved in 1990 to 1994 (%) - Black or African American
Year householder moved into unit - Moved in 1990 to 1994 (%) - Asian
Year householder moved into unit - Moved in 1990 to 1994 (%) - Hispanic or Latino
Year householder moved into unit - Moved in 1990 to 1994 (%) - American Indian and Alaska Native
Year householder moved into unit - Moved in 1990 to 1994 (%) - Multirace
Year householder moved into unit - Moved in 1990 to 1994 (%) - Other Race
Year householder moved into unit - Moved in 1980 to 1989 (%)
Year householder moved into unit - Moved in 1980 to 1989 (%) - White
Year householder moved into unit - Moved in 1980 to 1989 (%) - Black or African American
Year householder moved into unit - Moved in 1980 to 1989 (%) - Asian
Year householder moved into unit - Moved in 1980 to 1989 (%) - Hispanic or Latino
Year householder moved into unit - Moved in 1980 to 1989 (%) - American Indian and Alaska Native
Year householder moved into unit - Moved in 1980 to 1989 (%) - Multirace
Year householder moved into unit - Moved in 1980 to 1989 (%) - Other Race
Year householder moved into unit - Moved in 1970 to 1979 (%)
Year householder moved into unit - Moved in 1970 to 1979 (%) - White
Year householder moved into unit - Moved in 1970 to 1979 (%) - Black or African American
Year householder moved into unit - Moved in 1970 to 1979 (%) - Asian
Year householder moved into unit - Moved in 1970 to 1979 (%) - Hispanic or Latino
Year householder moved into unit - Moved in 1970 to 1979 (%) - American Indian and Alaska Native
Year householder moved into unit - Moved in 1970 to 1979 (%) - Multirace
Year householder moved into unit - Moved in 1970 to 1979 (%) - Other Race
Year householder moved into unit - Moved in 1969 or earlier (%)
Year householder moved into unit - Moved in 1969 or earlier (%) - White
Year householder moved into unit - Moved in 1969 or earlier (%) - Black or African American
Year householder moved into unit - Moved in 1969 or earlier (%) - Asian
Year householder moved into unit - Moved in 1969 or earlier (%) - Hispanic or Latino
Year householder moved into unit - Moved in 1969 or earlier (%) - American Indian and Alaska Native
Year householder moved into unit - Moved in 1969 or earlier (%) - Multirace
Year householder moved into unit - Moved in 1969 or earlier (%) - Other Race
Housing units lacking complete plumbing facilities (%)
Housing units lacking complete kitchen facilities (%)
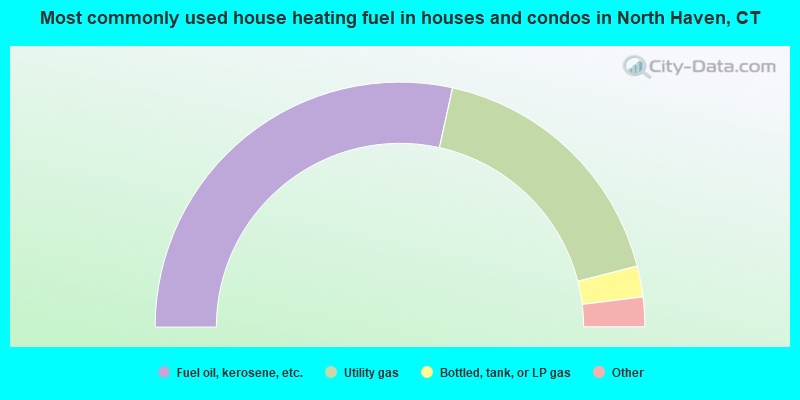
House heating fuel used in houses and condos - Utility gas (%)
House heating fuel used in houses and condos - Bottled, tank, or LP gas (%)
House heating fuel used in houses and condos - Electricity (%)
House heating fuel used in houses and condos - Fuel oil, kerosene, etc. (%)
House heating fuel used in houses and condos - Coal or coke (%)
House heating fuel used in houses and condos - Wood (%)
House heating fuel used in houses and condos - Solar energy (%)
House heating fuel used in houses and condos - Other fuel (%)
House heating fuel used in houses and condos - No fuel used (%)
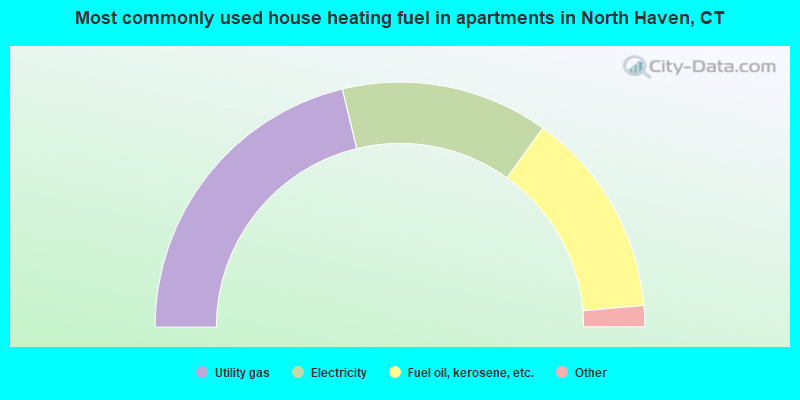
House heating fuel used in apartments - Utility gas (%)
House heating fuel used in apartments - Bottled, tank, or LP gas (%)
House heating fuel used in apartments - Electricity (%)
House heating fuel used in apartments - Fuel oil, kerosene, etc. (%)
House heating fuel used in apartments - Coal or coke (%)
House heating fuel used in apartments - Wood (%)
House heating fuel used in apartments - Solar energy (%)
House heating fuel used in apartments - Other fuel (%)
House heating fuel used in apartments - No fuel used (%)
Median year house/condo built: 1962Median year apartment built: 1981Household type by relationship:
Households: 24,278
Male householders: 4,903 (506 living alone ), Female householders: 4,695 (1,477 living alone )5,336 spouses (5,290 opposite-sex spouses ), 705 unmarried partners , (705 opposite-sex unmarried partners ), 6,748 children (6,585 natural , 82 adopted , 81 stepchildren ), 375 grandchildren , 132 brothers or sisters , 551 parents , 0 foster children , 172 other relatives , 475 non-relatives In group quarters: 180
Size of family households: 3,252 2-persons , 1,716 3-persons , 1,075 4-persons , 363 5-persons , 264 6-persons , 74 7-or-more-persons .
Size of nonfamily households: 2,093 1-person , 799 2-persons , 66 3-persons .
3,948 married couples with children. single-parent households (86 men , 523 women ).
86.1% of residents of North Haven speak English at home. of residents speak Spanish at home (69% speak English very well , 17% speak English well , 12% speak English not well , 2% don't speak English at all ).of residents speak other Indo-European language at home (53% speak English very well , 36% speak English well , 3% speak English not well , 8% don't speak English at all ).of residents speak Asian or Pacific Island language at home (31% speak English very well , 45% speak English well , 24% speak English not well ).of residents speak other language at home (85% speak English very well , 15% speak English well ).
Foreign born population: 2,473 (10.2%)of them are naturalized citizens )
Median number of rooms in houses and condos:
Median number of rooms in apartments
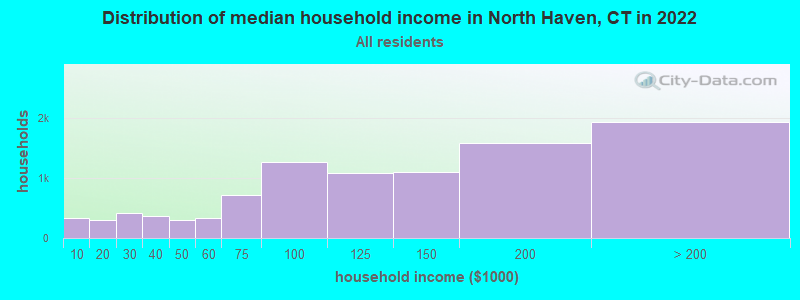
North Haven, CT household income distribution 324 Less than $10,000298 $10,000 to $19,999415 $20,000 to $29,999359 $30,000 to $39,999307 $40,000 to $49,999325 $50,000 to $59,999720 $60,000 to $74,9991,256 $75,000 to $99,9991,073 $100,000 to $124,9991,100 $125,000 to $149,9991,583 $150,000 to $199,9991,926 $200,000 or more
Home value of owner - occupied houses in 2022 in North Haven, CT 62 Less than $10,00095 $25,000 to $29,99918 $30,000 to $34,99934 $35,000 to $39,99933 $40,000 to $49,99911 $80,000 to $89,99913 $100,000 to $124,99991 $150,000 to $174,99966 $175,000 to $199,999722 $200,000 to $249,9991,514 $250,000 to $299,9992,932 $300,000 to $399,9991,552 $400,000 to $499,9991,053 $500,000 to $749,99995 $750,000 to $999,99931 $1,500,000 to $1,999,99938 $2,000,000 or moreRent paid by renters in 2022 in North Haven, CT 9 $200 to $2496 $250 to $29918 $300 to $3496 $350 to $39923 $450 to $49941 $500 to $54929 $550 to $59944 $600 to $64938 $650 to $69916 $700 to $74973 $800 to $8994 $900 to $999470 $1,000 to $1,249280 $1,250 to $1,499187 $1,500 to $1,999243 $2,000 to $2,49915 $2,500 to $2,999186 No cash rent
Percentage of workers working in this county: 82.1%Number of people working at home: 1,700 (13.1% of all workers )
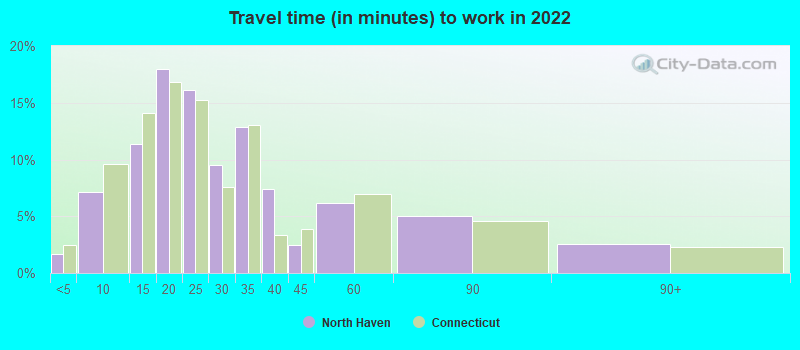
Travel time to work (commute)
Less than 5 minutes: 2805 to 9 minutes: 82110 to 14 minutes: 1,65215 to 19 minutes: 2,76120 to 24 minutes: 2,07525 to 29 minutes: 56430 to 34 minutes: 1,21335 to 39 minutes: 21640 to 44 minutes: 24145 to 59 minutes: 70660 to 89 minutes: 40790 or more minutes: 185
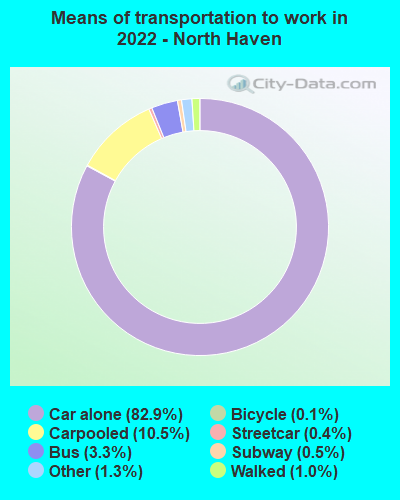
Means of transportation to work:
Drove a car alone: 14,335 (73.4%)Carpooled: 1,925 (9.9%)Bus : 565 (2.9%)Subway or elevated rail : 108 (0.6%)Long-distance train or commuter rail : 60 (0.3%)Taxi: 276 (1.4%)Bicycle: 18 (0.1%)Walked: 182 (0.9%)Worked at home: 1,700 (8.7%)
Unemployment by race in 2022
Unemployment rate for White non-Hispanic residents 1.0% Males1.1% FemalesUnemployment rate for Black residents 20.7% Males37.8% FemalesUnemployment rate for Asian residents 15.9% MalesUnemployment rate for other race residents 1.4% MalesUnemployment rate for two or more race residents 9.7% Males2.3% FemalesUnemployment rate for Hispanic or Latino residents 4.6% Males
Year of entry for the foreign-born population in North Haven, Connecticut
411 2010 or later 793 2000 to 2009 424 1990 to 1999 259 1980 to 1989 239 1970 to 1979 587 Before 1970
First ancestries reported:
Italian: 4,707 (39.4%)
Irish: 1,438 (12.0%)
American: 618 (5.2%)
German: 308 (2.6%)
Polish: 268 (2.2%)
English: 255 (2.1%)
Albanian: 246 (2.1%)
European: 156 (1.3%)
French: 95 (0.8%)
Russian: 71 (0.6%)
French Canadian: 57 (0.5%)
Swedish: 51 (0.4%)
Ukrainian: 51 (0.4%)
Greek: 42 (0.4%)
Turkish: 40 (0.3%)
Portuguese: 35 (0.3%)
Armenian: 20 (0.2%)
Canadian: 17 (0.1%)
Finnish: 17 (0.1%)
African: 16 (0.1%)
Hungarian: 16 (0.1%)
British West Indian: 14 (0.1%)
Scotch-Irish: 13 (0.1%)
Czech: 13 (0.1%)
Dutch: 12 (0.1%)
Moroccan: 7 (0.06%)
Celtic: 6 (0.05%)
British: 6 (0.05%)
Lithuanian: 6 (0.05%)
Northern European: 5 (0.04%)
Scandinavian: 2 (0.02%)
Sudanese: 2 (0.02%)
Cape Verdean: 1 (0.01%) Most common places of birth for foreign-born residents (%): China, excluding Hong Kong and Taiwan North Haven:
14.3% (353)Connecticut:
4.4% (24,001)
Korea North Haven:
12.0% (297)Connecticut:
1.4% (7,495)
Italy North Haven:
9.5% (234)Connecticut:
2.8% (15,141)
Albania North Haven:
8.3% (206)Connecticut:
1.0% (5,447)
Laos North Haven:
5.7% (140)Connecticut:
0.3% (1,845)
Philippines North Haven:
5.7% (140)Connecticut:
1.9% (10,545)
India North Haven:
5.6% (139)Connecticut:
7.3% (39,879)
Mexico North Haven:
4.2% (105)Connecticut:
4.8% (25,802)
Vietnam North Haven:
3.5% (87)Connecticut:
1.2% (6,448)
Honduras North Haven:
3.2% (79)Connecticut:
1.3% (7,220)
El Salvador North Haven:
3.2% (79)Connecticut:
1.1% (6,024)
Spain North Haven:
3.1% (77)Connecticut:
0.4% (2,170)
Taiwan North Haven:
2.4% (60)Connecticut:
0.5% (2,530)
Germany North Haven:
2.4% (59)Connecticut:
1.3% (7,149)
Poland North Haven:
1.9% (46)Connecticut:
4.0% (21,729)
Canada North Haven:
1.8% (44)Connecticut:
2.3% (12,380)
England North Haven:
1.7% (42)Connecticut:
1.2% (6,551)
Place of birth for U.S.-born residents:
This state: 17,060Other state: 4,063Northeast: 2,490Midwest: 598South: 508West: 475 92.3% of North Haven residents lived in the same house 1 years ago.
Out of people who lived in different houses, 32.5% lived in this county.
Out of people who lived in different counties, 34.6% lived in Connecticut.
North Haven:
92.3%State average:
88.4%
Education attainment for males 25 years and older:
No schooling: 114Nursery to 4th grade: 05th and 6th grade: 557th and 8th grade: 89th grade: 1610th grade: 8311th grade: 5412th grade, no diploma: 111High school graduate (or equivalency): 2,526Less than 1 year of college: 566Some college more than 1 year, no degree: 756Associate degree: 526Bachelor's degree: 2,456Master's degree: 804Professional school degree: 373Doctorate degree: 264
Education attainment for females 25 years and older:
No schooling: 74Nursery to 4th grade: 05th and 6th grade: 77th and 8th grade: 929th grade: 2710th grade: 511th grade: 5912th grade, no diploma: 177High school graduate (or equivalency): 2,385Less than 1 year of college: 456Some college more than 1 year, no degree: 862Associate degree: 560Bachelor's degree: 2,312Master's degree: 1,879Professional school degree: 321Doctorate degree: 147
Housing units in structures:
One, detached: 8,104One, attached: 370Two: 933 or 4: 1215 to 9: 19010 to 19: 22120 to 49: 27350 or more: 552Boats, RVs, vans, etc.: 5Housing units lacking complete plumbing facilities in 2022: 0.5%Housing units lacking complete kitchen facilities in 2022: 0.7%House/condo owner moved in on average 16 years ago
Renter moved in on average 2 years ago
Private vs. public school enrollment:
Students in private schools in grades 1 to 8 (elementary and middle school): 126 Here:
5.1%Connecticut:
9.5%
Students in private schools in grades 9 to 12 (high school): 308 Here:
23.2%Connecticut:
12.9%
Students in private undergraduate colleges: 364 Here:
47.8%Connecticut:
35.5%