Housing density: 1,337 houses/condos per square mile
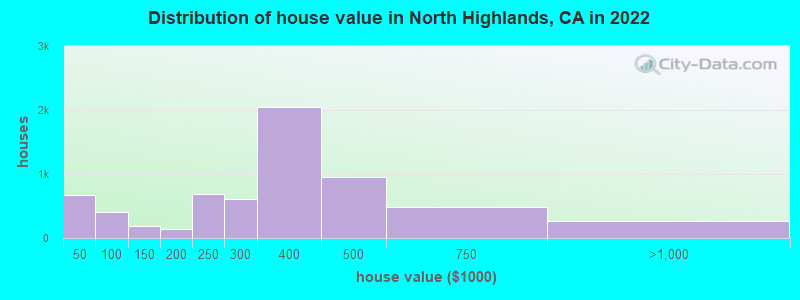
Median price asked for vacant for-sale houses and condos in 2022: $523,998.
Median contract rent in 2022: $1,358 (lower quartile is $1,099, upper quartile is $1,570)
Median rent asked for vacant for-rent units in 2022: $2,385
Median gross rent in North Highlands, CA in 2022: $1,491
Housing units in North Highlands with a mortgage: 5,716 (334 second mortgage, 16 home equity loan, 169 both second mortgage and home equity loan) Houses without a mortgage: 27
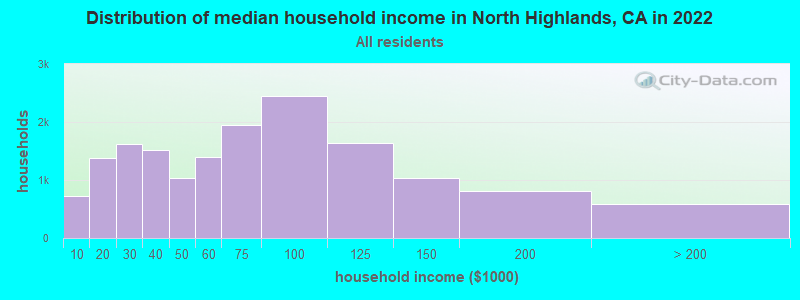
Median household income for houses/condos with a mortgage: $89,631
Median household income for apartments without a mortgage: $53,813
Median monthly housing costs: $1,436
Compare current foreclosures in North Highlands, CA:
7,147 married couples with children.
3,407 single-parent households (844 men, 2,563 women).
57.7% of residents of North Highlands speak English at home.
20.5% of residents speak Spanish at home (64% speak English very well, 14% speak English well, 19% speak English not well, 3% don't speak English at all).
16.2% of residents speak other Indo-European language at home (48% speak English very well, 25% speak English well, 24% speak English not well, 3% don't speak English at all).
5.4% of residents speak Asian or Pacific Island language at home (44% speak English very well, 28% speak English well, 23% speak English not well, 4% don't speak English at all).
1.0% of residents speak other language at home (59% speak English very well, 10% speak English well, 23% speak English not well, 8% don't speak English at all).
Foreign born population: 14,171 (29.4%)
(47.8% of them are naturalized citizens)
Percentage of workers working in this county: 81.8% Number of people working at home: 2,954 (13.6% of all workers)
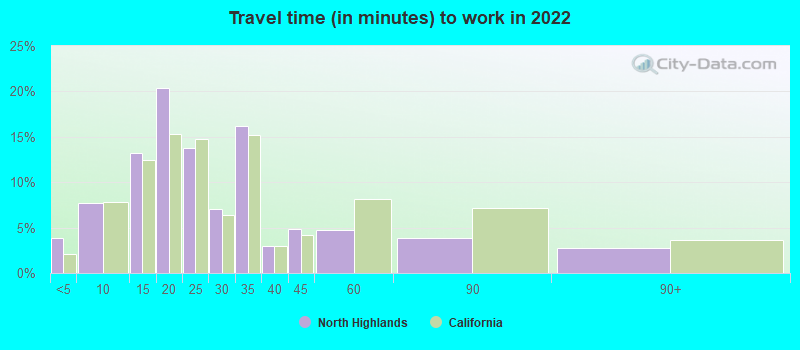
Travel time to work (commute)
Less than 5 minutes: 616
5 to 9 minutes: 660
10 to 14 minutes: 1,931
15 to 19 minutes: 3,227
20 to 24 minutes: 2,976
25 to 29 minutes: 1,673
30 to 34 minutes: 3,161
35 to 39 minutes: 577
40 to 44 minutes: 795
45 to 59 minutes: 991
60 to 89 minutes: 574
90 or more minutes: 1,170
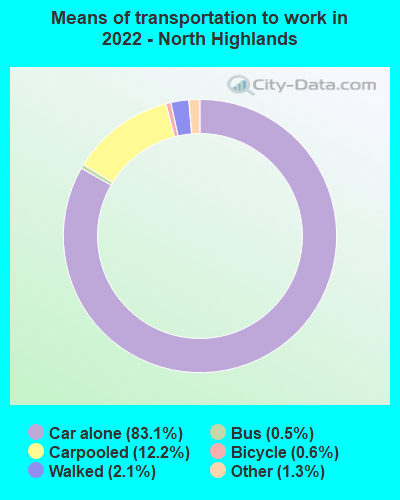
Means of transportation to work:
Drove a car alone: 11,507 (68.2%)
Carpooled: 1,749 (10.4%)
Bus: 36 (0.2%)
Ferryboat: 5 (0.0%)
Taxi: 222 (1.3%)
Bicycle: 66 (0.4%)
Walked: 328 (1.9%)
Worked at home: 2,954 (17.5%)
Unemployment by race in 2022
Unemployment rate for White non-Hispanic residents
5.8%Males
4.3%Females
Unemployment rate for Black residents
8.8%Males
13.1%Females
Unemployment rate for Asian residents
5.0%Males
1.0%Females
Unemployment rate for other race residents
7.4%Females
Unemployment rate for two or more race residents
2.5%Males
2.6%Females
Unemployment rate for Hispanic or Latino residents
1.0%Males
4.0%Females
Year of entry for the foreign-born population in North Highlands, California
5,2632010 or later
4,0572000 to 2009
3,2831990 to 1999
1,3371980 to 1989
4981970 to 1979
708Before 1970
First ancestries reported:
Ukrainian: 3,347 (11.5%)
Russian: 1,343 (4.6%)
German: 772 (2.7%)
Afghan: 711 (2.4%)
Romanian: 605 (2.1%)
American: 448 (1.5%)
Irish: 445 (1.5%)
English: 442 (1.5%)
Italian: 407 (1.4%)
European: 240 (0.8%)
Scottish: 115 (0.4%)
Polish: 109 (0.4%)
Finnish: 101 (0.3%)
Iranian: 90 (0.3%)
Swedish: 88 (0.3%)
African: 82 (0.3%)
Norwegian: 74 (0.3%)
French: 65 (0.2%)
Nigerian: 63 (0.2%)
Canadian: 57 (0.2%)
Scotch-Irish: 55 (0.2%)
Hungarian: 54 (0.2%)
Welsh: 53 (0.2%)
Portuguese: 40 (0.1%)
Kenyan: 40 (0.1%)
Slavic: 35 (0.1%)
Northern European: 30 (0.1%)
Dutch: 27 (0.09%)
Armenian: 26 (0.09%)
Croatian: 26 (0.09%)
Danish: 14 (0.05%)
Iraqi: 12 (0.04%)
British: 10 (0.03%)
Turkish: 6 (0.02%)
Scandinavian: 5 (0.02%)
Greek: 2 (0.01%)
Most common places of birth for foreign-born residents (%):
Ukraine
North Highlands:
21.6% (2,981)
California:
0.6% (60,761)
Mexico
North Highlands:
20.6% (2,836)
California:
37.2% (3,881,193)
Afghanistan
North Highlands:
13.0% (1,789)
California:
0.5% (53,260)
El Salvador
North Highlands:
7.4% (1,019)
California:
4.2% (440,287)
Russia
North Highlands:
5.0% (684)
California:
0.7% (71,932)
Philippines
North Highlands:
4.9% (674)
California:
7.8% (818,297)
Moldova
North Highlands:
4.2% (576)
California:
0.1% (10,171)
Vietnam
North Highlands:
3.4% (473)
California:
4.9% (512,335)
Romania
North Highlands:
2.8% (379)
California:
0.2% (23,058)
Belarus
North Highlands:
2.4% (331)
California:
0.1% (11,157)
Kazakhstan
North Highlands:
2.1% (289)
California:
0.1% (6,648)
Uzbekistan
North Highlands:
1.8% (242)
California:
0.1% (5,897)
Place of birth for U.S.-born residents:
This state: 27,667
Other state: 5,601
Northeast: 875
Midwest: 1,542
South: 1,464
West: 1,718
91.4% of North Highlands residents lived in the same house 1 years ago. Out of people who lived in different houses, 43.7% lived in this county. Out of people who lived in different counties, 84.5% lived in California.
North Highlands:
91.4%
State average:
88.9%
Education attainment for males 25 years and older:
No schooling: 1,046
Nursery to 4th grade: 98
5th and 6th grade: 250
7th and 8th grade: 121
9th grade: 142
10th grade: 130
11th grade: 221
12th grade, no diploma: 228
High school graduate (or equivalency): 5,581
Less than 1 year of college: 1,233
Some college more than 1 year, no degree: 2,509
Associate degree: 1,783
Bachelor's degree: 1,607
Master's degree: 331
Professional school degree: 123
Doctorate degree: 27
Education attainment for females 25 years and older:
No schooling: 800
Nursery to 4th grade: 104
5th and 6th grade: 270
7th and 8th grade: 194
9th grade: 236
10th grade: 96
11th grade: 185
12th grade, no diploma: 341
High school graduate (or equivalency): 4,935
Less than 1 year of college: 1,513
Some college more than 1 year, no degree: 2,954
Associate degree: 1,245
Bachelor's degree: 1,564
Master's degree: 571
Professional school degree: 71
Doctorate degree: 111
Housing units in structures:
One, detached: 10,120
One, attached: 1,649
Two: 440
3 or 4: 1,023
5 to 9: 1,343
10 to 19: 685
20 to 49: 559
50 or more: 554
Mobile homes: 735
Median worth of mobile homes: $56,843
Housing units lacking complete plumbing facilities in 2022: 1.3%
Housing units lacking complete kitchen facilities in 2022: 1.7%