North Platte, NE (Nebraska) Houses and Residents
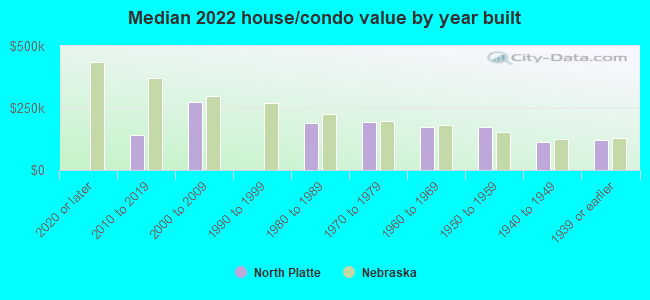
| North Platte: | $172,378 |
| Nebraska: | $232,400 |
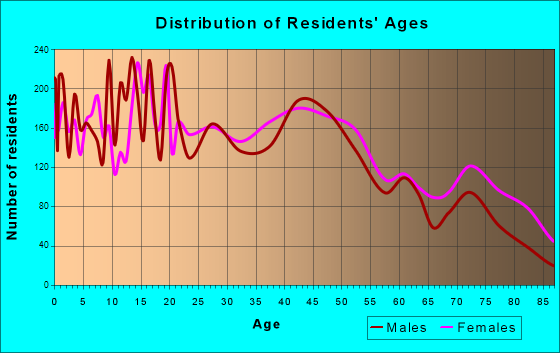
Total population: 24,327 (Urban population: 23,770 (all inside urban clusters), Rural population: 76 (all nonfarm))
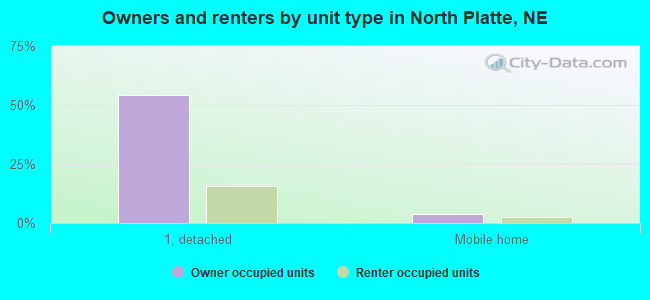
Houses: 11,571 (10,199 occupied: 6,242 owner occupied, 4,116 renter occupied)
| % of renters here: | 40% |
| State: | 34% |
Housing density: 1,106 houses/condos per square mile
Median price asked for vacant for-sale houses and condos in 2022: $494,576.
Median contract rent in 2022: $698 (lower quartile is $544, upper quartile is $891)
Median rent asked for vacant for-rent units in 2022: $552
Median gross rent in North Platte, NE in 2022: $867
Housing units in North Platte with a mortgage: 3,349 (269 second mortgage, 17 home equity loan, 142 both second mortgage and home equity loan)
Houses without a mortgage: 15
Median household income for houses/condos with a mortgage: $91,768
Median household income for apartments without a mortgage: $49,983
Median monthly housing costs: $908
Compare current foreclosures in North Platte, NE:
| Photo | Address | Area | Beds / Baths | Price | Details |
|---|---|---|---|---|---|

|
#1
S Sycamore St
North Platte, NE 69101
|
2,040 sq. feet
|
2 baths 4 beds |
show details | |

|
#2
S Chestnut St
North Platte, NE 69101
|
1,736 sq. feet
|
2 baths 2 beds |
show details | |

|
#3
Birchwood Rd
North Platte, NE 69101
|
2,969 sq. feet
|
2 baths 3 beds |
show details | |

|
#4
W A St
North Platte, NE 69101
|
1,684 sq. feet
|
2 baths 2 beds |
show details | |

|
#5
Sugarberry Rd
North Platte, NE 69101
|
2,324 sq. feet
|
2 baths 3 beds |
show details | |

|
#6
E 5th St
North Platte, NE 69101
|
960 sq. feet
|
1 baths 3 beds |
show details | |

|
#7
Russian Olive Rd
North Platte, NE 69101
|
2,352 sq. feet
|
2 baths 3 beds |
show details | |

|
#8
S Ash St
North Platte, NE 69101
|
1,034 sq. feet
|
2 baths 3 beds |
show details | |

|
#9
W 1st St
North Platte, NE 69101
|
1,416 sq. feet
|
2 baths 3 beds |
show details | |

|
#10
W Philip Ave
North Platte, NE 69101
|
1,624 sq. feet
|
2 baths 3 beds |
show details |
| Photo | Address | Area | Beds / Baths | Price | Details |
|---|---|---|---|---|---|

|
#11
E 5th St
North Platte, NE 69101
|
922 sq. feet
|
1 baths 2 beds |
show details | |

|
#12
E 2nd St
North Platte, NE 69101
|
1,693 sq. feet
|
2 baths 3 beds |
show details | |

|
#13
S Bailey Ave
North Platte, NE 69101
|
1,534 sq. feet
|
1 baths 3 beds |
show details | |

|
#14
W 4th St
North Platte, NE 69101
|
1,703 sq. feet
|
2 baths 2 beds |
show details | |

|
#15
W 3rd St
North Platte, NE 69101
|
2,049 sq. feet
|
1 baths 4 beds |
show details | |

|
#16
Birchwood Rd
North Platte, NE 69101
|
1,000 sq. feet
|
1 baths 3 beds |
show details | |

|
#17
W 3rd St
North Platte, NE 69101
|
2,480 sq. feet
|
1 baths 4 beds |
show details | |

|
#18
Sheridan Ct
North Platte, NE 69101
|
2,226 sq. feet
|
2 baths 3 beds |
show details | |

|
#19
W 10th St
North Platte, NE 69101
|
752 sq. feet
|
1 baths 3 beds |
show details | |

|
#20
W 3rd St
North Platte, NE 69101
|
1,200 sq. feet
|
2 baths 4 beds |
show details |
| Photo | Address | Area | Beds / Baths | Price | Details |
|---|---|---|---|---|---|

|
#21
Bridle Ln
North Platte, NE 69101
|
1,296 sq. feet
|
2 baths - beds |
show details | |

|
#22
E D St
North Platte, NE 69101
|
1,344 sq. feet
|
1 baths - beds |
show details | |

|
#23
Rodeo Rd # 5a
North Platte, NE 69101
|
728 sq. feet
|
2 baths - beds |
show details | |

|
#24
E Hansen Trail Rd
North Platte, NE 69101
|
2,220 sq. feet
|
2 baths - beds |
show details | |

|
#25
Aspen Dr
North Platte, NE 69101
|
2,707 sq. feet
|
3 baths - beds |
show details | |

|
#26
N Sycamore St Apt 1
North Platte, NE 69101
|
- sq. feet
|
- baths - beds |
show details | |

|
#27
W 6th St
North Platte, NE 69101
|
- sq. feet
|
- baths - beds |
show details | |

|
#28
W 4th St
North Platte, NE 69101
|
- sq. feet
|
- baths - beds |
show details | |

|
#29
Lynn Ct Apt 5
North Platte, NE 69101
|
- sq. feet
|
- baths - beds |
show details | |

|
#30
Burlington Blvd
North Platte, NE 69101
|
- sq. feet
|
- baths - beds |
show details |
| Photo | Address | Area | Beds / Baths | Price | Details |
|---|---|---|---|---|---|

|
#31
N Miles Ave
North Platte, NE 69101
|
- sq. feet
|
- baths - beds |
show details | |

|
#32
W A St
North Platte, NE 69101
|
- sq. feet
|
- baths - beds |
show details | |

|
#33
E Philip Ave Trlr 57c
North Platte, NE 69101
|
- sq. feet
|
- baths - beds |
show details | |

|
#34
W C St
North Platte, NE 69101
|
- sq. feet
|
- baths - beds |
show details | |

|
#35
N Bare Ave Lot 207
North Platte, NE 69101
|
- sq. feet
|
- baths - beds |
show details | |

|
#36
S Tabor Ave Apt 401
North Platte, NE 69101
|
- sq. feet
|
- baths - beds |
show details | |

|
#37
N Poplar St
North Platte, NE 69101
|
- sq. feet
|
- baths - beds |
show details | |

|
#38
E Philip Ave
North Platte, NE 69101
|
- sq. feet
|
- baths - beds |
show details | |

|
Check over 1 million property listings on Foreclosure.com!
|
browse all offers | |||


 | North Platte Apartments (1 reply) |
| How is North Platte these days? Kearney? (11 replies) |
| Rental property in Lexington/North Platte areas (3 replies) |
| Wanting out of Denver, thinking of relocating to Western NE (38 replies) |
| RV Lot for sale or rent in North Platte, NE (0 replies) |
| North Platte living (2 replies) |
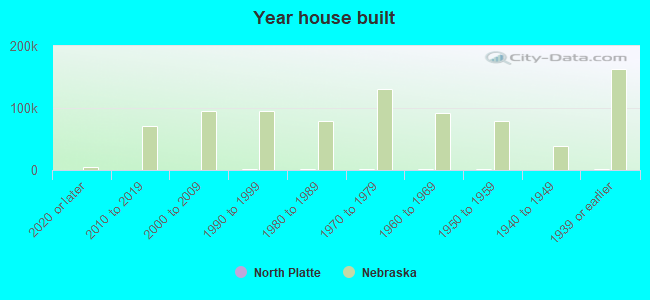
Median year apartment built: 1972
Household type by relationship:
Households: 23,415- Male householders: 5,214 (2,001 living alone), Female householders: 4,844 (1,688 living alone)
4,254 spouses (4,247 opposite-sex spouses), 695 unmarried partners, (681 opposite-sex unmarried partners), 6,501 children (5,962 natural, 226 adopted, 313 stepchildren), 306 grandchildren, 189 brothers or sisters, 70 parents, 19 foster children, 105 other relatives, 626 non-relatives
- In group quarters: 587
Size of family households: 2,655 2-persons, 1,171 3-persons, 1,222 4-persons, 643 5-persons, 223 6-persons, 15 7-or-more-persons.
Size of nonfamily households: 3,894 1-person, 494 2-persons, 37 3-persons, 5 4-persons, 47 5-persons.
3,265 married couples with children.
1,626 single-parent households (138 men, 1,488 women).
94.5% of residents of North Platte speak English at home.
4.3% of residents speak Spanish at home (77% speak English very well, 8% speak English well, 15% speak English not well, 1% don't speak English at all).
0.7% of residents speak other Indo-European language at home (58% speak English very well, 31% speak English well, 10% speak English not well).
0.5% of residents speak Asian or Pacific Island language at home (27% speak English very well, 40% speak English well, 8% speak English not well, 24% don't speak English at all).
Foreign born population: 689 (2.9%)
(65.5% of them are naturalized citizens)
| Here: | 6.7 |
| State: | 7.1 |
| Here: | 4.6 |
| State: | 4.2 |
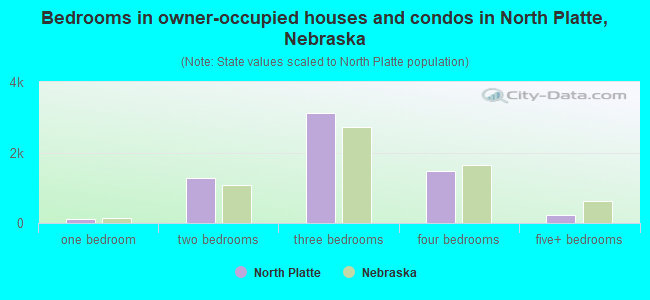
- Bedrooms in owner-occupied houses and condos in North Platte, Nebraska
- 0no bedroom
- 1161 bedroom
- 1,2852 bedrooms
- 3,1253 bedrooms
- 1,4764 bedrooms
- 2405+ bedrooms
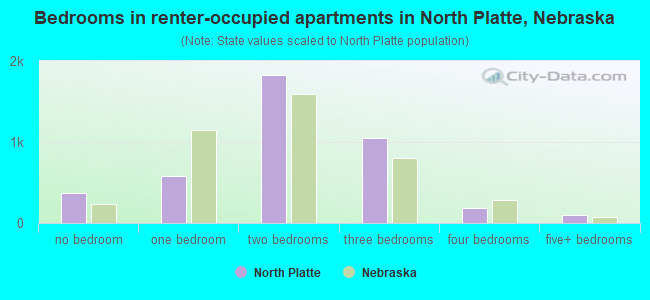
- Bedrooms in renter-occupied apartments in North Platte, Nebraska
- 376no bedroom
- 5841 bedroom
- 1,8272 bedrooms
- 1,0463 bedrooms
- 1814 bedrooms
- 1025+ bedrooms
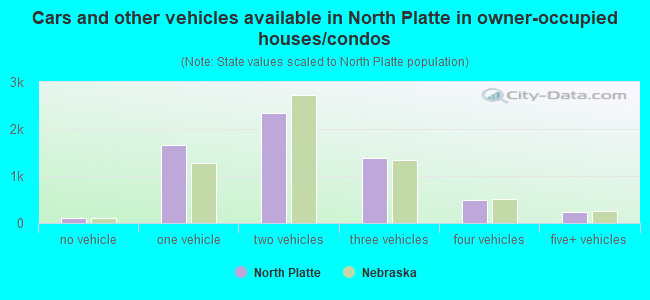
- Cars and other vehicles available in North Platte in owner-occupied houses/condos
- 117no vehicle
- 1,6611 vehicle
- 2,3382 vehicles
- 1,3853 vehicles
- 4984 vehicles
- 2435+ vehicles
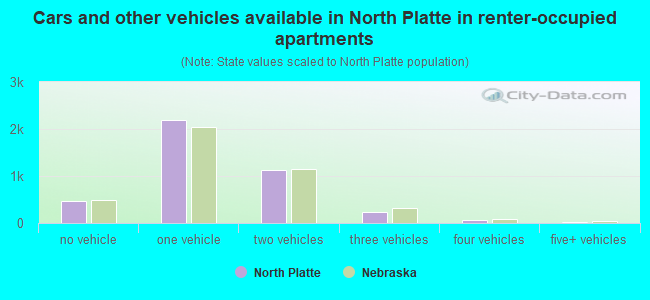
- Cars and other vehicles available in North Platte in renter-occupied apartments
- 463no vehicle
- 2,1991 vehicle
- 1,1262 vehicles
- 2403 vehicles
- 644 vehicles
- 245+ vehicles
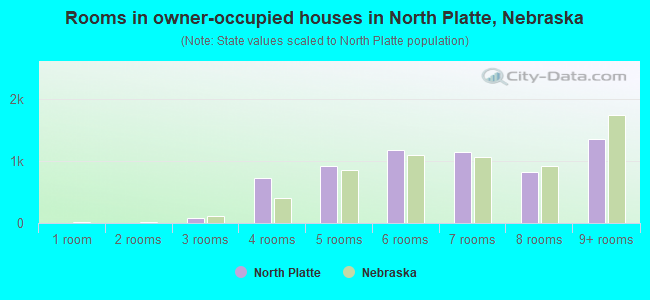
- Rooms in owner-occupied houses in North Platte, Nebraska
- 01 room
- 02 rooms
- 823 rooms
- 7324 rooms
- 9165 rooms
- 1,1806 rooms
- 1,1467 rooms
- 8318 rooms
- 1,3559+ rooms
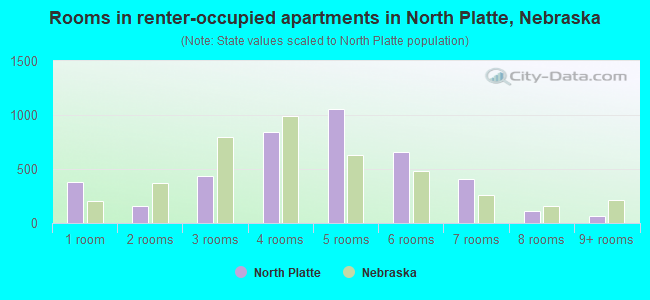
- Rooms in renter-occupied apartments in North Platte, Nebraska
- 3761 room
- 1542 rooms
- 4373 rooms
- 8454 rooms
- 1,0565 rooms
- 6626 rooms
- 4067 rooms
- 1138 rooms
- 689+ rooms
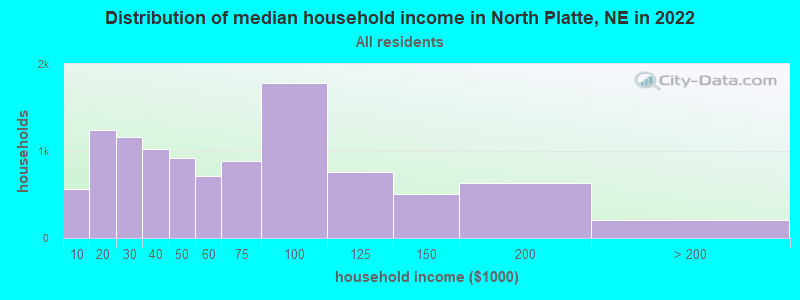
North Platte, NE household income distribution

- 560Less than $10,000
- 1,243$10,000 to $19,999
- 1,164$20,000 to $29,999
- 1,027$30,000 to $39,999
- 924$40,000 to $49,999
- 713$50,000 to $59,999
- 883$60,000 to $74,999
- 1,776$75,000 to $99,999
- 762$100,000 to $124,999
- 504$125,000 to $149,999
- 631$150,000 to $199,999
- 205$200,000 or more
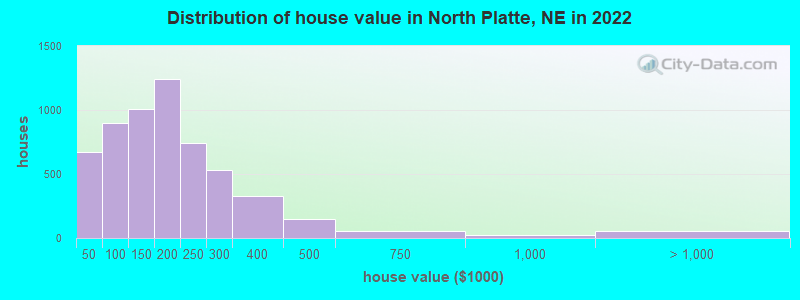
Home value of owner - occupied houses in 2022 in North Platte, NE
-
- 157Less than $10,000
- 103$10,000 to $14,999
- 112$15,000 to $19,999
- 63$20,000 to $24,999
- 29$25,000 to $29,999
- 41$30,000 to $34,999
- 55$35,000 to $39,999
- 104$40,000 to $49,999
- 120$50,000 to $59,999
- 119$60,000 to $69,999
- 190$70,000 to $79,999
- 204$80,000 to $89,999
- 161$90,000 to $99,999
- 530$100,000 to $124,999
- 478$125,000 to $149,999
- 798$150,000 to $174,999
- 443$175,000 to $199,999
- 741$200,000 to $249,999
- 528$250,000 to $299,999
- 330$300,000 to $399,999
- 145$400,000 to $499,999
- 57$500,000 to $749,999
- 21$750,000 to $999,999
- 18$1,000,000 to $1,499,999
- 34$2,000,000 or more
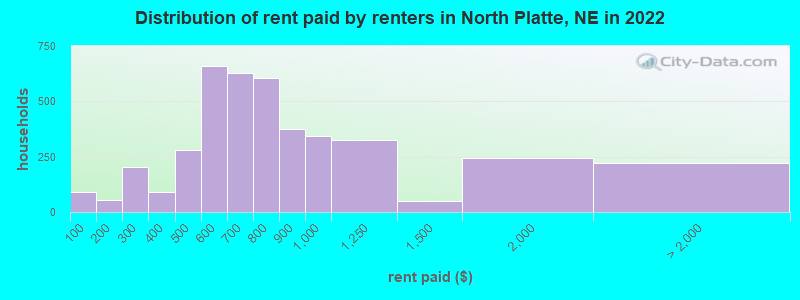
Rent paid by renters in 2022 in North Platte, NE
-
- 89Less than $100
- 14$100 to $149
- 40$150 to $199
- 64$200 to $249
- 140$250 to $299
- 25$300 to $349
- 64$350 to $399
- 105$400 to $449
- 174$450 to $499
- 313$500 to $549
- 344$550 to $599
- 343$600 to $649
- 285$650 to $699
- 164$700 to $749
- 441$750 to $799
- 375$800 to $899
- 342$900 to $999
- 324$1,000 to $1,249
- 50$1,250 to $1,499
- 244$1,500 to $1,999
- 6$2,000 to $2,499
- 18$3,000 to $3,499
- 197No cash rent
Percentage of workers working in this county: 95.7%
Number of people working at home: 305 (2.8% of all workers)
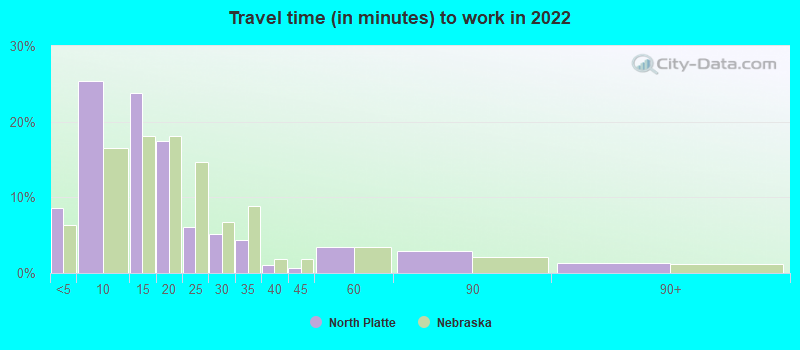
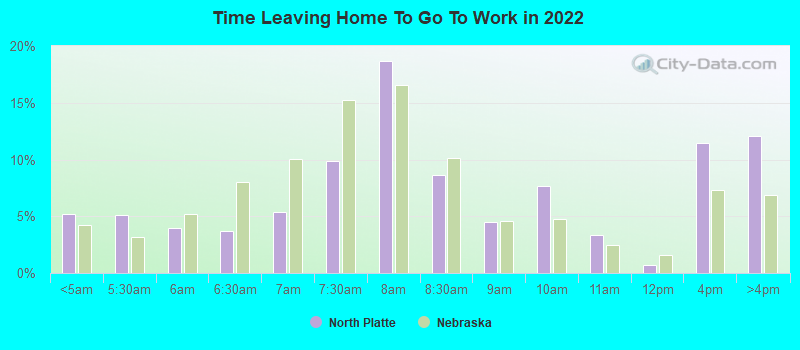
Travel time to work (commute)
- Less than 5 minutes: 1,026
- 5 to 9 minutes: 3,295
- 10 to 14 minutes: 2,751
- 15 to 19 minutes: 2,034
- 20 to 24 minutes: 454
- 25 to 29 minutes: 243
- 30 to 34 minutes: 129
- 35 to 39 minutes: 43
- 40 to 44 minutes: 80
- 45 to 59 minutes: 195
- 60 to 89 minutes: 255
- 90 or more minutes: 50
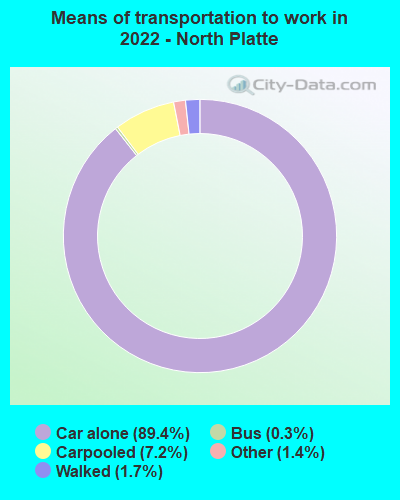
Means of transportation to work:
- Drove a car alone: 10,976 (85.6%)
- Carpooled: 917 (7.2%)
- Bus: 28 (0.2%)
- Taxi: 183 (1.4%)
- Bicycle: 9 (0.1%)
- Walked: 194 (1.5%)
- Worked at home: 305 (2.4%)
- Unemployment by race in 2022
- Unemployment rate for White non-Hispanic residents
- 2.9%Males
- 2.9%Females
- Unemployment rate for Black residents
- 9.6%Males
- 10.8%Females
- Unemployment rate for American Indian and Alaska Native residents
- 16.0%Males
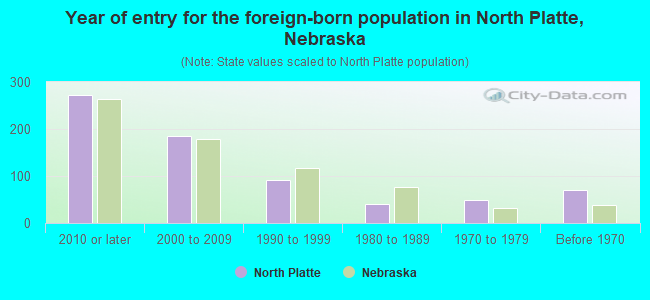
- Year of entry for the foreign-born population in North Platte, Nebraska
- 2732010 or later
- 1852000 to 2009
- 911990 to 1999
- 411980 to 1989
- 481970 to 1979
- 70Before 1970
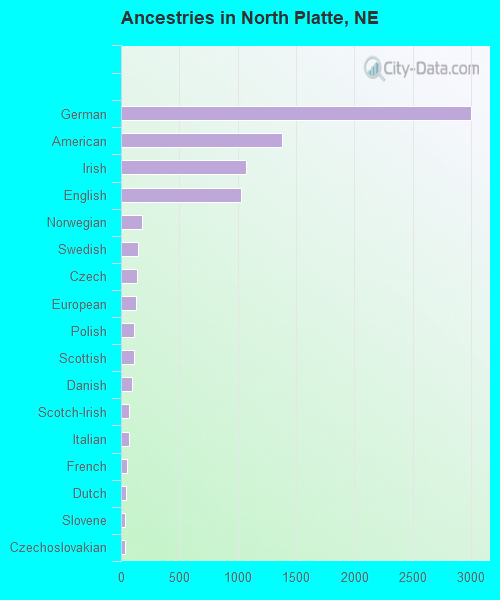
First ancestries reported:
- German: 3,005 (28.8%)
- American: 1,377 (13.2%)
- Irish: 1,076 (10.3%)
- English: 1,031 (9.9%)
- Norwegian: 181 (1.7%)
- Swedish: 150 (1.4%)
- Czech: 136 (1.3%)
- European: 127 (1.2%)
- Polish: 113 (1.1%)
- Scottish: 110 (1.1%)
- Danish: 97 (0.9%)
- Scotch-Irish: 68 (0.7%)
- Italian: 66 (0.6%)
- French: 51 (0.5%)
- Dutch: 44 (0.4%)
- Slovene: 34 (0.3%)
- Czechoslovakian: 31 (0.3%)
- Greek: 19 (0.2%)
- Arab: 16 (0.2%)
- Eastern European: 11 (0.1%)
- Pennsylvania German: 9 (0.09%)
- Scandinavian: 5 (0.05%)
- Russian: 1 (0.01%)
Most common places of birth for foreign-born residents (%):
| North Platte: | 41.8% (303) |
| Nebraska: | 31.7% (46,610) |
| North Platte: | 12.7% (92) |
| Nebraska: | 1.6% (2,312) |
| North Platte: | 9.4% (68) |
| Nebraska: | 0.2% (246) |
| North Platte: | 6.3% (46) |
| Nebraska: | 2.2% (3,173) |
| North Platte: | 6.2% (45) |
| Nebraska: | 1.4% (2,029) |
| North Platte: | 4.4% (32) |
| Nebraska: | 3.7% (5,421) |
| North Platte: | 2.9% (21) |
| Nebraska: | 0.3% (411) |
| North Platte: | 2.5% (18) |
| Nebraska: | 2.2% (3,185) |
| North Platte: | 2.3% (17) |
| Nebraska: | 0.2% (346) |
| North Platte: | 2.1% (15) |
| Nebraska: | 0.4% (636) |
| North Platte: | 1.8% (13) |
| Nebraska: | 4.2% (6,118) |
Place of birth for U.S.-born residents:
- This state: 16,717
- Other state: 5,911
- Northeast: 296
- Midwest: 1,781
- South: 783
- West: 3,177
83.3% of North Platte residents lived in the same house 1 years ago.
Out of people who lived in different houses, 35.4% lived in this county.
Out of people who lived in different counties, 58.8% lived in Nebraska.
| North Platte: | 83.3% |
| State average: | 87.4% |
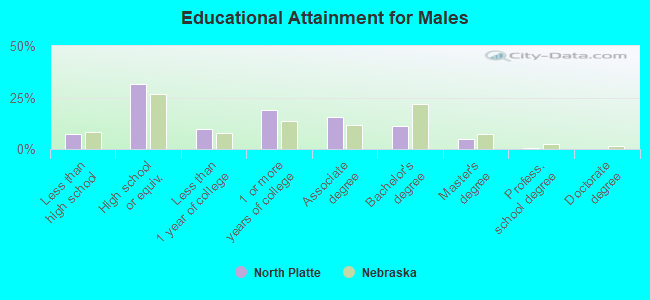
Education attainment for males 25 years and older:
- No schooling: 36
- Nursery to 4th grade: 68
- 5th and 6th grade: 27
- 7th and 8th grade: 90
- 9th grade: 25
- 10th grade: 147
- 11th grade: 59
- 12th grade, no diploma: 135
- High school graduate (or equivalency): 2,461
- Less than 1 year of college: 757
- Some college more than 1 year, no degree: 1,491
- Associate degree: 1,220
- Bachelor's degree: 866
- Master's degree: 381
- Professional school degree: 48
- Doctorate degree: 19
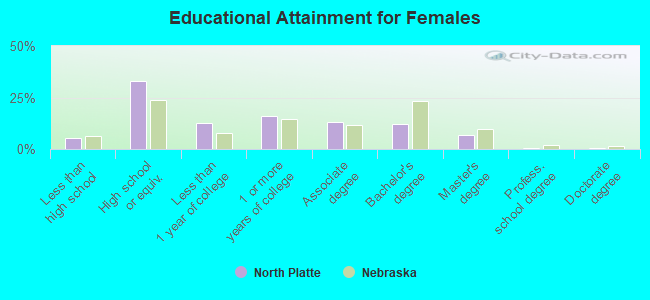
Education attainment for females 25 years and older:
- No schooling: 95
- Nursery to 4th grade: 2
- 5th and 6th grade: 0
- 7th and 8th grade: 68
- 9th grade: 26
- 10th grade: 17
- 11th grade: 114
- 12th grade, no diploma: 106
- High school graduate (or equivalency): 2,697
- Less than 1 year of college: 1,048
- Some college more than 1 year, no degree: 1,293
- Associate degree: 1,066
- Bachelor's degree: 1,005
- Master's degree: 536
- Professional school degree: 49
- Doctorate degree: 41
Housing units in structures:
- One, detached: 7,468
- One, attached: 429
- Two: 609
- 3 or 4: 311
- 5 to 9: 482
- 10 to 19: 406
- 20 to 49: 227
- 50 or more: 632
- Mobile homes: 1,003
Median worth of mobile homes: $17,253
Housing units lacking complete kitchen facilities in 2022: 3.8%
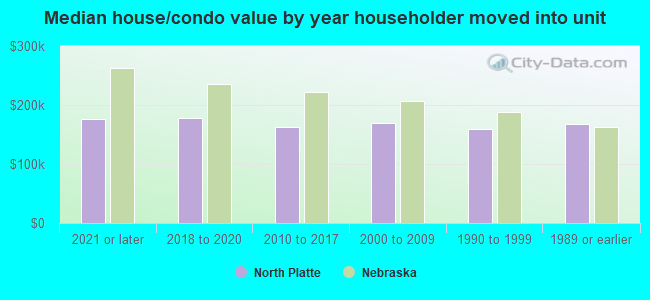
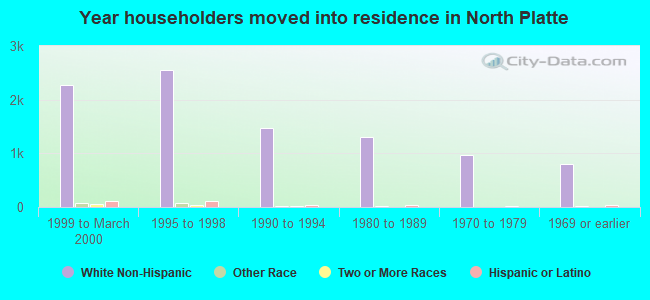
House/condo owner moved in on average 9 years ago
Renter moved in on average 4 years ago
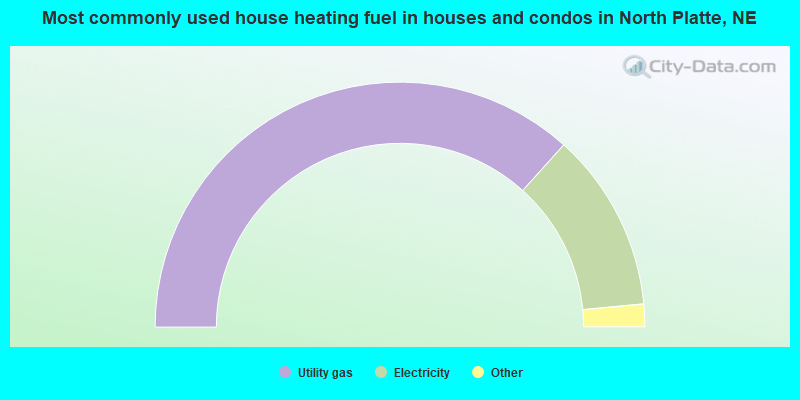
- 73.4%Utility gas
- 23.7%Electricity
- 1.6%Bottled, tank, or LP gas
- 0.7%Other fuel
- 0.4%Fuel oil, kerosene, etc.
- 0.3%No fuel used
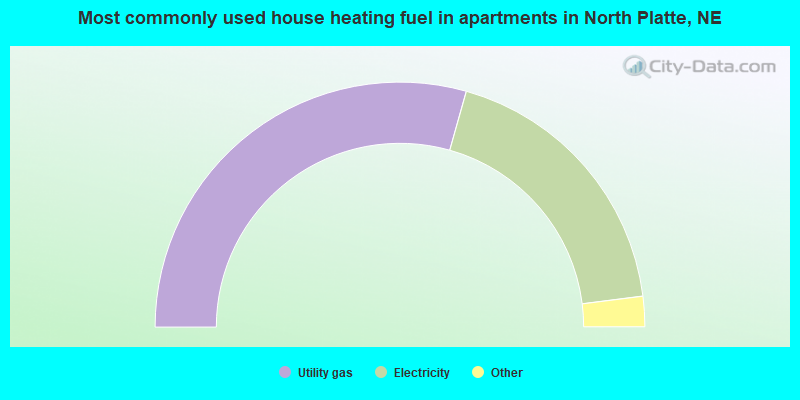
- 58.8%Utility gas
- 37.3%Electricity
- 2.3%Bottled, tank, or LP gas
- 1.4%Other fuel
- 0.2%Wood
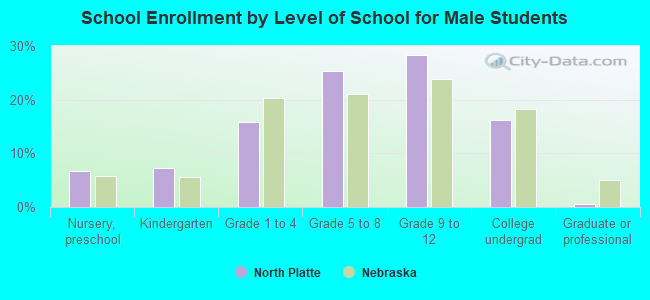
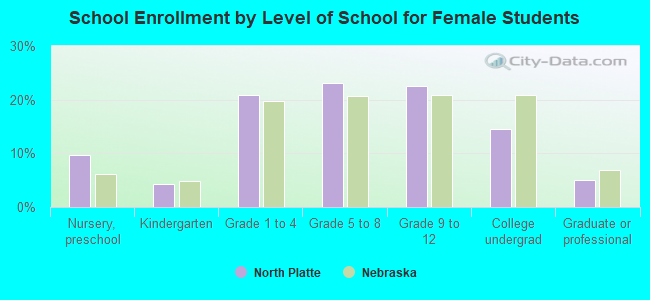
Private vs. public school enrollment:
| Here: | 9.4% |
| Nebraska: | 14.1% |
| Here: | 7.4% |
| Nebraska: | 12.5% |
| Here: | 8.8% |
| Nebraska: | 18.0% |