North River, WA (Washington) Houses and Residents
| North River: | $378,081 |
| Washington: | $569,500 |
Total population: 603 (Urban population: 0, Rural population: 552 (4 farm, 548 nonfarm))
Houses: 248 (225 occupied: 186 owner occupied, 39 renter occupied)
| % of renters here: | 17% |
| State: | 36% |
Housing density: 2 houses/condos per square mile
Median price asked for vacant for-sale houses and condos in 2022 in this county: $220,515.
Median contract rent in 2022: $858 (lower quartile is $577, upper quartile is $1,272)
Median gross rent in North River, WA in 2022: $977
Housing units in North River with a mortgage: 53 (2 second mortgage, 3 home equity loan, 0 both second mortgage and home equity loan)
Houses without a mortgage: 33
Compare current foreclosures near North River, WA:
| Photo | Address | Area | Beds / Baths | Price | Details |
|---|---|---|---|---|---|

|
#1
Chenault Ave
Hoquiam, WA 98550
|
- sq. feet
|
1 baths 3 beds |
show details | |

|
#2
Bear Gulch Rd
Aberdeen, WA 98520
|
- sq. feet
|
1 baths 3 beds |
show details | |

|
#3
Cherry St
Hoquiam, WA 98550
|
- sq. feet
|
1 baths 2 beds |
show details | |

|
#4
Monte Elma Rd
Elma, WA 98541
|
- sq. feet
|
3 baths 4 beds |
show details | |

|
#5
N B St
Aberdeen, WA 98520
|
2,000 sq. feet
|
2 baths 3 beds |
show details | |

|
#6
E Scott St
Aberdeen, WA 98520
|
1,356 sq. feet
|
2 baths 3 beds |
show details | |

|
#7
W 5th St
Aberdeen, WA 98520
|
2,010 sq. feet
|
2 baths 3 beds |
show details | |

|
#8
Pioneer Blvd
Aberdeen, WA 98520
|
1,732 sq. feet
|
1 baths 3 beds |
show details | |

|
#9
N 12th St
Elma, WA 98541
|
- sq. feet
|
2 baths 3 beds |
show details | |

|
#10
Chenault Ave
Hoquiam, WA 98550
|
- sq. feet
|
1 baths 3 beds |
show details |
| Photo | Address | Area | Beds / Baths | Price | Details |
|---|---|---|---|---|---|

|
#11
N Michigan St
Aberdeen, WA 98520
|
1,416 sq. feet
|
- baths - beds |
show details | |

|
#12
W 2nd St
Aberdeen, WA 98520
|
- sq. feet
|
1 baths 2 beds |
show details | |

|
#13
Emerson Ave
Hoquiam, WA 98550
|
- sq. feet
|
1 baths 2 beds |
show details | |

|
#14
Maple St
Hoquiam, WA 98550
|
1,646 sq. feet
|
- baths - beds |
show details | |

|
#15
Oakhurst Dr
Elma, WA 98541
|
- sq. feet
|
2 baths 3 beds |
show details | |

|
#16
Monroe St
Hoquiam, WA 98550
|
- sq. feet
|
2 baths 3 beds |
show details | |

|
#17
5th St
Hoquiam, WA 98550
|
- sq. feet
|
2 baths 3 beds |
show details | |

|
#18
Aberdeen Ave
Hoquiam, WA 98550
|
- sq. feet
|
1 baths 2 beds |
show details | |

|
#19
30th St
Hoquiam, WA 98550
|
- sq. feet
|
1 baths 2 beds |
show details | |

|
#20
Pacific Ave
Hoquiam, WA 98550
|
- sq. feet
|
1 baths 2 beds |
show details |
| Photo | Address | Area | Beds / Baths | Price | Details |
|---|---|---|---|---|---|

|
#21
W Main St
Elma, WA 98541
|
- sq. feet
|
1 baths 2 beds |
show details | |

|
#22
N I St
Aberdeen, WA 98520
|
- sq. feet
|
2 baths 3 beds |
show details | |

|
#23
Basich Blvd
Aberdeen, WA 98520
|
- sq. feet
|
- baths - beds |
show details | |

|
#24
Perry Ave
Hoquiam, WA 98550
|
- sq. feet
|
- baths - beds |
show details | |

|
#25
E 4th St # 3
Aberdeen, WA 98520
|
- sq. feet
|
- baths - beds |
show details | |

|
#26
Constantine Way
Aberdeen, WA 98520
|
- sq. feet
|
- baths - beds |
show details | |

|
#27
W 2nd St
Aberdeen, WA 98520
|
- sq. feet
|
- baths - beds |
show details | |

|
#28
N C St
Aberdeen, WA 98520
|
- sq. feet
|
- baths - beds |
show details | |

|
#29
E 1st St Apt 201
Aberdeen, WA 98520
|
- sq. feet
|
- baths - beds |
show details | |

|
#30
W Wishkah St
Aberdeen, WA 98520
|
- sq. feet
|
- baths - beds |
show details |
| Photo | Address | Area | Beds / Baths | Price | Details |
|---|---|---|---|---|---|

|
#31
E Wishkah St # 115
Aberdeen, WA 98520
|
- sq. feet
|
- baths - beds |
show details | |

|
#32
Camp Creek Rd
Montesano, WA 98563
|
- sq. feet
|
- baths - beds |
show details | |

|
#33
E Pioneer Ave
Montesano, WA 98563
|
- sq. feet
|
- baths - beds |
show details | |

|
#34
Barnhart St
Raymond, WA 98577
|
- sq. feet
|
- baths - beds |
show details | |

|
#35
Rustemeyer Rd, Trlr 4
Aberdeen, WA 98520
|
- sq. feet
|
- baths - beds |
show details | |

|
#36
Howard St, Trlr 44
Raymond, WA 98577
|
- sq. feet
|
- baths - beds |
show details | |

|
#37
Arnold Ave
Hoquiam, WA 98550
|
- sq. feet
|
- baths - beds |
show details | |

|
#38
Monte Elma Rd
Elma, WA 98541
|
- sq. feet
|
- baths - beds |
show details | |

|
#39
W Martin St
Elma, WA 98541
|
- sq. feet
|
- baths - beds |
show details | |

|
#40
River Rd
Aberdeen, WA 98520
|
- sq. feet
|
- baths - beds |
show details |
| Photo | Address | Area | Beds / Baths | Price | Details |
|---|---|---|---|---|---|

|
#41
Westerly Dr
Aberdeen, WA 98520
|
- sq. feet
|
- baths - beds |
show details | |

|
#42
Wooding St
Aberdeen, WA 98520
|
- sq. feet
|
- baths - beds |
show details | |

|
#43
Pacific Ave
Aberdeen, WA 98520
|
- sq. feet
|
- baths - beds |
show details | |

|
#44
Central Park Dr
Aberdeen, WA 98520
|
- sq. feet
|
- baths - beds |
show details | |

|
#45
Burleigh Ave
Aberdeen, WA 98520
|
- sq. feet
|
- baths - beds |
show details | |

|
#46
W Market St
Aberdeen, WA 98520
|
- sq. feet
|
- baths - beds |
show details | |

|
#47
Wynooche Valley Rd
Montesano, WA 98563
|
- sq. feet
|
- baths - beds |
show details | |

|
#48
S Mill St
Aberdeen, WA 98520
|
- sq. feet
|
- baths - beds |
show details | |

|
#49
E Elma Ave
Montesano, WA 98563
|
- sq. feet
|
- baths - beds |
show details | |

|
Check over 1 million property listings on Foreclosure.com!
|
browse all offers | |||

Household type by relationship:
Households: 70,066- In family households: 57,224 (12,673 male householders, 5,820 female householders)
13,382 spouses, 18,151 children (16,168 natural, 673 adopted, 1,310 stepchildren), 1,752 grandchildren, 646 brothers or sisters, 508 parents, foster children, 974 other relatives, 2,882 non-relatives
- In nonfamily households: 12,842 (5,095 male householders (3,774 living alone)), 4,991 female householders (4,102 living alone)), 2,756 nonrelatives
- In group quarters: 2,731 (2,477 institutionalized population)
10,454 married couples with children.
4,757 single-parent households (1,315 men, 3,442 women).
95.9% of residents of North River speak English at home.
0.4% of residents speak Spanish at home (100% speak English well).
3.0% of residents speak other Indo-European language at home (25% speak English very well, 75% speak English not well).
0.7% of residents speak Asian or Pacific Island language at home (50% speak English very well, 50% speak English well).
Foreign born population: 18 (2.8%)
(105.6% of them are naturalized citizens)
| Here: | 6.2 |
| State: | 6.5 |
| Here: | 5.1 |
| State: | 3.9 |

- Bedrooms in owner-occupied houses and condos in North River, Washington
- 0no bedroom
- 171 bedroom
- 302 bedrooms
- 1083 bedrooms
- 274 bedrooms
- 45+ bedrooms

- Bedrooms in renter-occupied apartments in North River, Washington
- 0no bedroom
- 01 bedroom
- 252 bedrooms
- 123 bedrooms
- 24 bedrooms
- 05+ bedrooms

- Cars and other vehicles available in North River in owner-occupied houses/condos
- 2no vehicle
- 541 vehicle
- 772 vehicles
- 323 vehicles
- 164 vehicles
- 55+ vehicles

- Cars and other vehicles available in North River in renter-occupied apartments
- 3no vehicle
- 171 vehicle
- 142 vehicles
- 53 vehicles
- 04 vehicles
- 05+ vehicles

- Rooms in owner-occupied houses in North River, Washington
- 01 room
- 102 rooms
- 93 rooms
- 74 rooms
- 445 rooms
- 446 rooms
- 467 rooms
- 208 rooms
- 69+ rooms

- Rooms in renter-occupied apartments in North River, Washington
- 01 room
- 02 rooms
- 53 rooms
- 104 rooms
- 35 rooms
- 176 rooms
- 47 rooms
- 08 rooms
- 09+ rooms


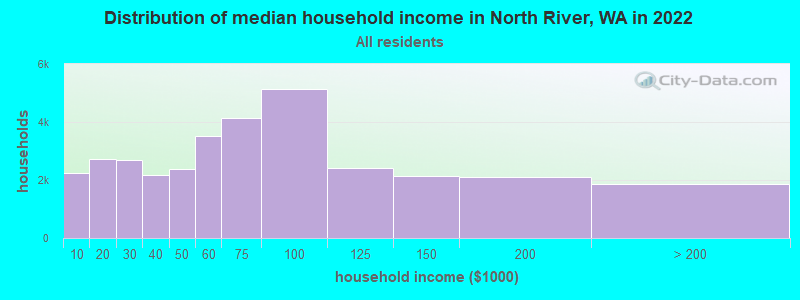
North River, WA household income distribution

- 2,235Less than $10,000
- 2,727$10,000 to $19,999
- 2,682$20,000 to $29,999
- 2,186$30,000 to $39,999
- 2,387$40,000 to $49,999
- 3,505$50,000 to $59,999
- 4,145$60,000 to $74,999
- 5,140$75,000 to $99,999
- 2,427$100,000 to $124,999
- 2,138$125,000 to $149,999
- 2,113$150,000 to $199,999
- 1,873$200,000 or more
Percentage of workers working in this county: 79.4%
Number of people working at home: 45 (15.8% of all workers)
Travel time to work (commute)
- Less than 5 minutes: 5
- 5 to 9 minutes: 16
- 10 to 14 minutes: 8
- 15 to 19 minutes: 20
- 20 to 24 minutes: 56
- 25 to 29 minutes: 23
- 30 to 34 minutes: 33
- 35 to 39 minutes: 5
- 40 to 44 minutes: 19
- 45 to 59 minutes: 24
- 60 to 89 minutes: 13
- 90 or more minutes: 9
Means of transportation to work:
- Drove a car alone: 188 (79.3%)
- Carpooled: 29 (12.2%)
- Bus or trolley bus: 2 (0.8%)
- Walked: 2 (0.8%)
- Other means: 10 (4.2%)
- Worked at home: 6 (2.5%)


- Year of entry for the foreign-born population in North River, Washington
- 01995 to March 2000
- 01990 to 1994
- 01985 to 1989
- 01980 to 1984
- 01975 to 1979
- 21970 to 1974
- 01965 to 1969
- 10Before 1965
Most common places of birth for foreign-born residents (%):
| North River: | 66.7% (8) |
| Washington: | 24.1% (148,115) |
| North River: | 16.7% (2) |
| Washington: | 6.2% (38,172) |
| North River: | 16.7% (2) |
| Washington: | 7.6% (46,733) |
Place of birth for U.S.-born residents:
- This state: 389
- Other state: 144
- Northeast: 7
- Midwest: 39
- South: 9
- West: 89
68% of North River residents lived in the same house 5 years ago.
Out of people who lived in different houses, 54% lived in this county.
Out of people who lived in different counties, 53% lived in Washington.
Education attainment for males 25 years and older:
- No schooling: 0
- Nursery to 4th grade: 0
- 5th and 6th grade: 0
- 7th and 8th grade: 11
- 9th grade: 6
- 10th grade: 4
- 11th grade: 1
- 12th grade, no diploma: 12
- High school graduate (or equivalency): 90
- Less than 1 year of college: 14
- Some college more than 1 year, no degree: 6
- Associate degree: 16
- Bachelor's degree: 21
- Master's degree: 2
- Professional school degree: 0
- Doctorate degree: 2

Education attainment for females 25 years and older:
- No schooling: 0
- Nursery to 4th grade: 0
- 5th and 6th grade: 2
- 7th and 8th grade: 8
- 9th grade: 4
- 10th grade: 0
- 11th grade: 6
- 12th grade, no diploma: 4
- High school graduate (or equivalency): 61
- Less than 1 year of college: 14
- Some college more than 1 year, no degree: 36
- Associate degree: 20
- Bachelor's degree: 15
- Master's degree: 26
- Professional school degree: 0
- Doctorate degree: 0


Housing units in structures:
- One, detached: 189
- One, attached: 3
- Mobile homes: 52
- Boats, RVs, vans, etc.: 4
Median worth of mobile homes: $282,504

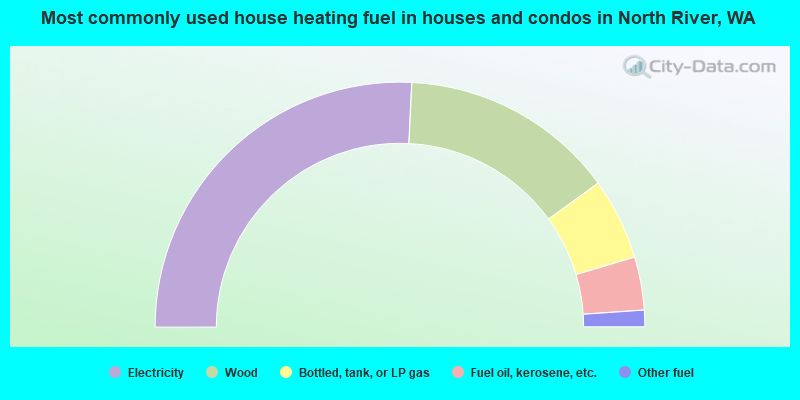
- 51.6%Electricity
- 28.5%Wood
- 10.8%Bottled, tank, or LP gas
- 7.0%Fuel oil, kerosene, etc.
- 2.2%Other fuel
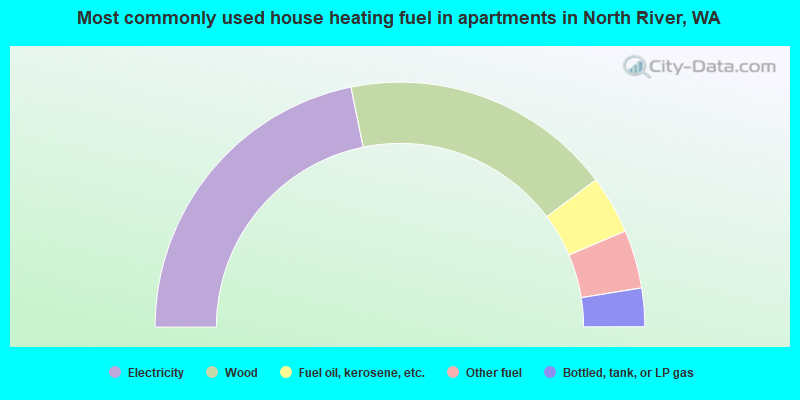
- 43.6%Electricity
- 35.9%Wood
- 7.7%Fuel oil, kerosene, etc.
- 7.7%Other fuel
- 5.1%Bottled, tank, or LP gas
Private vs. public school enrollment:
| Here: | 0.0% |
| Washington: | 9.2% |
| Here: | 0.0% |
| Washington: | 7.0% |
| Here: | 0.0% |
| Washington: | 15.7% |


