North Rock Springs, WY (Wyoming) Houses and Residents
| North Rock Springs: | $340,818 |
| Wyoming: | $292,300 |
Mean price in 2022:
Detached houses: $409,658
Here: $409,658 State: $440,428 Mobile homes: $157,142
Here: $157,142 State: $108,030
Total population: 2,207 (Urban population: 1,575 (all inside urban clusters), Rural population: 299 (all nonfarm))
Houses: 1,133 (1,105 occupied: 1,004 owner occupied, 127 renter occupied)
| % of renters here: | 11% |
| State: | 27% |
Housing density: 45 houses/condos per square mile
Median price asked for vacant for-sale houses and condos in 2022 in this county: $249,598.
Median contract rent in 2022: $787 (lower quartile is $718, upper quartile is $886)
Median rent asked for vacant for-rent units in 2022: $496
Median gross rent in North Rock Springs, WY in 2022: $873
Housing units in North Rock Springs with a mortgage: 489 (12 second mortgage, 0 home equity loan, 0 both second mortgage and home equity loan)
Houses without a mortgage: 0
Median household income for houses/condos with a mortgage: $155,242
Median household income for apartments without a mortgage: $75,234
Median monthly housing costs: $859
Compare current foreclosures near North Rock Springs, WY:
| Photo | Address | Area | Beds / Baths | Price | Details |
|---|---|---|---|---|---|

|
#1
Main St
Reliance, WY 82943
|
1,698 sq. feet
|
2 baths 2 beds |
$270,000
|
show details |

|
#2
E Teton Blvd
Green River, WY 82935
|
1,170 sq. feet
|
2 baths 2 beds |
show details | |

|
#3
Mesa Dr
Rock Springs, WY 82901
|
1,944 sq. feet
|
2 baths 3 beds |
show details | |

|
#4
Sherman St
Rock Springs, WY 82901
|
1,782 sq. feet
|
2 baths 2 beds |
show details | |

|
#5
Emerald St
Rock Springs, WY 82901
|
2,786 sq. feet
|
3 baths 2 beds |
show details | |

|
#6
Iowa Ave
Green River, WY 82935
|
1,680 sq. feet
|
2 baths 3 beds |
show details | |

|
#7
E Teton Blvd
Green River, WY 82935
|
2,360 sq. feet
|
3 baths 5 beds |
show details | |

|
#8
Koven Dr
Rock Springs, WY 82901
|
1,520 sq. feet
|
3 baths 3 beds |
show details | |

|
#9
Midway St
Rock Springs, WY 82901
|
2,016 sq. feet
|
2 baths 3 beds |
show details | |

|
#10
W 2nd North St
Green River, WY 82935
|
- sq. feet
|
- baths - beds |
show details |
| Photo | Address | Area | Beds / Baths | Price | Details |
|---|---|---|---|---|---|

|
#11
Mountain Fuel Sta Unit 1
Green River, WY 82935
|
- sq. feet
|
- baths - beds |
show details | |

|
#12
Bramwell St
Green River, WY 82935
|
- sq. feet
|
- baths - beds |
show details | |

|
#13
Hoover Dr
Green River, WY 82935
|
- sq. feet
|
- baths - beds |
show details | |

|
#14
Purple Sage Rd Lot 150
Rock Springs, WY 82901
|
- sq. feet
|
- baths - beds |
show details | |

|
#15
Shoshone Ave Unit 10
Green River, WY 82935
|
- sq. feet
|
- baths - beds |
show details | |

|
#16
Indian Hills Dr
Green River, WY 82935
|
- sq. feet
|
- baths - beds |
show details | |

|
#17
Purple Sage Rd Lot 128
Rock Springs, WY 82901
|
- sq. feet
|
- baths - beds |
show details | |

|
#18
W 2nd St Lot 1
Rock Springs, WY 82901
|
- sq. feet
|
- baths - beds |
show details | |

|
#19
Purple Sage Rd Lot 27
Rock Springs, WY 82901
|
- sq. feet
|
- baths - beds |
show details | |

|
#20
Purple Sage Rd Lot 30
Rock Springs, WY 82901
|
- sq. feet
|
- baths - beds |
show details |
| Photo | Address | Area | Beds / Baths | Price | Details |
|---|---|---|---|---|---|

|
#21
Century Blvd Apt 205
Rock Springs, WY 82901
|
- sq. feet
|
- baths - beds |
show details | |

|
#22
C St
Rock Springs, WY 82901
|
- sq. feet
|
- baths - beds |
show details | |

|
#23
Swanson Dr Lot 83
Rock Springs, WY 82901
|
- sq. feet
|
- baths - beds |
show details | |

|
#24
Dewar Dr Apt 303
Rock Springs, WY 82901
|
- sq. feet
|
- baths - beds |
show details | |

|
#25
Madison Dr Apt 4d
Rock Springs, WY 82901
|
- sq. feet
|
- baths - beds |
show details | |

|
#26
Reagan Ave
Rock Springs, WY 82901
|
- sq. feet
|
- baths - beds |
show details | |

|
#27
Springs Dr Lot 59
Rock Springs, WY 82901
|
- sq. feet
|
- baths - beds |
show details | |

|
#28
Reliance Rd, Unit A
Reliance, WY 82943
|
- sq. feet
|
- baths - beds |
show details | |

|
#29
Elk St Lot 230
Rock Springs, WY 82901
|
- sq. feet
|
- baths - beds |
show details | |

|
#30
Century Blvd Apt 302
Rock Springs, WY 82901
|
- sq. feet
|
- baths - beds |
show details |
| Photo | Address | Area | Beds / Baths | Price | Details |
|---|---|---|---|---|---|

|
#31
Maryland Dr
Green River, WY 82935
|
- sq. feet
|
- baths - beds |
show details | |

|
#32
Knotty Pine St
Green River, WY 82935
|
- sq. feet
|
- baths - beds |
show details | |

|
Check over 1 million property listings on Foreclosure.com!
|
browse all offers | |||


Median year apartment built: 1995
Household type by relationship:
Households: 2,544- Male householders: 577 (214 living alone), Female householders: 519 (74 living alone)
638 spouses (638 opposite-sex spouses), 149 unmarried partners, (149 opposite-sex unmarried partners), 614 children (614 natural, 0 adopted, 0 stepchildren), 25 grandchildren, 0 brothers or sisters, 0 parents, 0 foster children, 16 other relatives, 0 non-relatives
- In group quarters: 3
Size of family households: 326 2-persons, 225 3-persons, 183 4-persons, 3 5-persons, 9 6-persons.
Size of nonfamily households: 299 1-person, 97 2-persons.
384 married couples with children.
42 single-parent households (0 men, 42 women).
88.2% of residents of North Rock Springs speak English at home.
11.0% of residents speak Spanish at home (39% speak English very well, 61% speak English well).
Foreign born population: 74 (2.9%)
(28.4% of them are naturalized citizens)
| Here: | 6.2 |
| State: | 6.7 |
| Here: | 5.4 |
| State: | 4.4 |

- Bedrooms in owner-occupied houses and condos in North Rock Springs, Wyoming
- 0no bedroom
- 361 bedroom
- 1142 bedrooms
- 6413 bedrooms
- 1274 bedrooms
- 865+ bedrooms

- Bedrooms in renter-occupied apartments in North Rock Springs, Wyoming
- 0no bedroom
- 01 bedroom
- 312 bedrooms
- 973 bedrooms
- 04 bedrooms
- 05+ bedrooms

- Cars and other vehicles available in North Rock Springs in owner-occupied houses/condos
- 0no vehicle
- 1571 vehicle
- 2762 vehicles
- 1453 vehicles
- 2714 vehicles
- 1555+ vehicles

- Cars and other vehicles available in North Rock Springs in renter-occupied apartments
- 0no vehicle
- 691 vehicle
- 592 vehicles
- 03 vehicles
- 04 vehicles
- 05+ vehicles

- Rooms in owner-occupied houses in North Rock Springs, Wyoming
- 01 room
- 02 rooms
- 03 rooms
- 1114 rooms
- 1665 rooms
- 3236 rooms
- 1267 rooms
- 928 rooms
- 1869+ rooms

- Rooms in renter-occupied apartments in North Rock Springs, Wyoming
- 01 room
- 02 rooms
- 03 rooms
- 434 rooms
- 285 rooms
- 316 rooms
- 07 rooms
- 268 rooms
- 09+ rooms


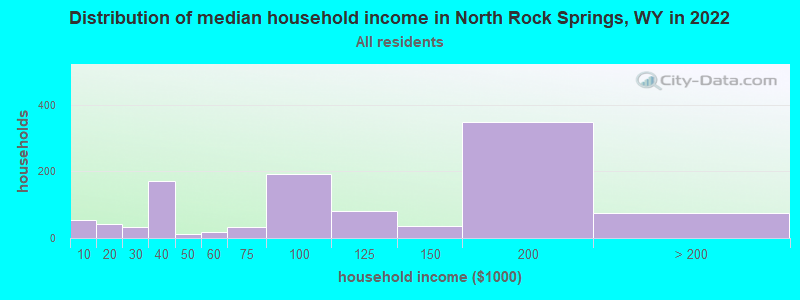
North Rock Springs, WY household income distribution

- 55Less than $10,000
- 43$10,000 to $19,999
- 34$20,000 to $29,999
- 170$30,000 to $39,999
- 12$40,000 to $49,999
- 17$50,000 to $59,999
- 32$60,000 to $74,999
- 192$75,000 to $99,999
- 80$100,000 to $124,999
- 37$125,000 to $149,999
- 348$150,000 to $199,999
- 76$200,000 or more
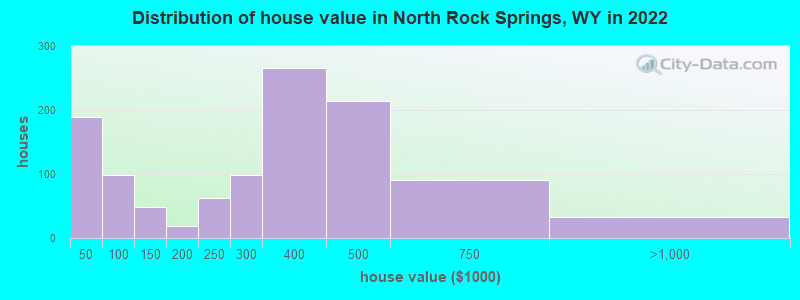
Home value of owner - occupied houses in 2022 in North Rock Springs, WY
-
- 121Less than $10,000
- 67$40,000 to $49,999
- 31$50,000 to $59,999
- 47$100,000 to $124,999
- 18$150,000 to $174,999
- 61$200,000 to $249,999
- 99$250,000 to $299,999
- 265$300,000 to $399,999
- 213$400,000 to $499,999
- 91$500,000 to $749,999
- 32$750,000 to $999,999
Rent paid by renters in 2022 in North Rock Springs, WY
-
- 29$600 to $649
- 36$700 to $749
- 38$800 to $899
- 26$1,000 to $1,249

Percentage of workers working in this county: 99.3%
Number of people working at home: 207 (14.1% of all workers)
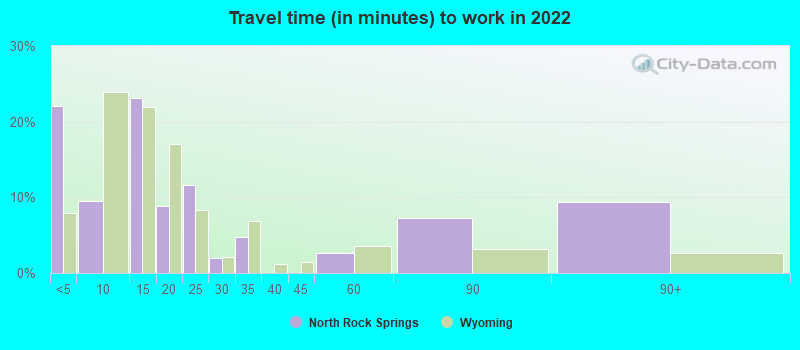
Travel time to work (commute)
- Less than 5 minutes: 78
- 5 to 9 minutes: 18
- 10 to 14 minutes: 266
- 15 to 19 minutes: 312
- 20 to 24 minutes: 129
- 25 to 29 minutes: 0
- 30 to 34 minutes: 66
- 35 to 39 minutes: 67
- 40 to 44 minutes: 17
- 45 to 59 minutes: 214
- 60 to 89 minutes: 97
- 90 or more minutes: 0
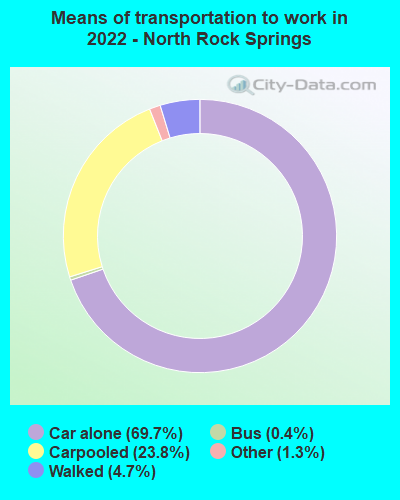
Means of transportation to work:
- Drove a car alone: 492 (68.6%)
- Carpooled: 135 (18.8%)
- Bus or trolley bus: 2 (0.3%)
- Taxi: 7 (1.0%)
- Walked: 37 (5.2%)
- Worked at home: 13 (1.8%)
- Unemployment by race in 2022
- Unemployment rate for White non-Hispanic residents
- 7.3%Males
- 4.2%Females

- Year of entry for the foreign-born population in North Rock Springs, Wyoming
- 742010 or later
- 02000 to 2009
- 01990 to 1999
- 161980 to 1989
- 61970 to 1979
- 0Before 1970

First ancestries reported:
- English: 333 (23.6%)
- German: 152 (10.8%)
- Swedish: 92 (6.5%)
- European: 83 (5.9%)
- Irish: 44 (3.1%)
- Norwegian: 38 (2.7%)
- American: 37 (2.6%)
- Northern European: 32 (2.3%)
- Slavic: 31 (2.2%)
- Italian: 28 (2.0%)
- Scandinavian: 27 (1.9%)
- Danish: 24 (1.7%)
- Hungarian: 20 (1.4%)
- Scottish: 10 (0.7%)
- Dutch: 9 (0.6%)
Most common places of birth for foreign-born residents (%):
| North Rock Springs: | 73.5% (61) |
| Wyoming: | 42.9% (8,470) |
| North Rock Springs: | 24.1% (20) |
| Wyoming: | 0.6% (119) |
Place of birth for U.S.-born residents:
- This state: 728
- Other state: 1,672
- Northeast: 48
- Midwest: 435
- South: 250
- West: 937
86.9% of North Rock Springs residents lived in the same house 1 years ago.
Out of people who lived in different houses, 24.5% lived in this county.
Out of people who lived in different counties, 20.2% lived in Wyoming.
| North Rock Springs: | 86.9% |
| State average: | 84.7% |
Education attainment for males 25 years and older:
- No schooling: 9
- Nursery to 4th grade: 0
- 5th and 6th grade: 0
- 7th and 8th grade: 0
- 9th grade: 1
- 10th grade: 0
- 11th grade: 11
- 12th grade, no diploma: 9
- High school graduate (or equivalency): 457
- Less than 1 year of college: 22
- Some college more than 1 year, no degree: 209
- Associate degree: 80
- Bachelor's degree: 58
- Master's degree: 108
- Professional school degree: 0
- Doctorate degree: 0

Education attainment for females 25 years and older:
- No schooling: 23
- Nursery to 4th grade: 8
- 5th and 6th grade: 0
- 7th and 8th grade: 0
- 9th grade: 34
- 10th grade: 0
- 11th grade: 0
- 12th grade, no diploma: 0
- High school graduate (or equivalency): 350
- Less than 1 year of college: 66
- Some college more than 1 year, no degree: 101
- Associate degree: 171
- Bachelor's degree: 57
- Master's degree: 50
- Professional school degree: 28
- Doctorate degree: 0


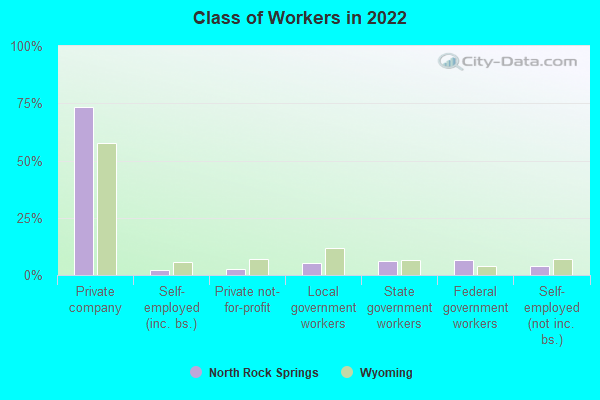
Housing units in structures:
- One, detached: 643
- Mobile homes: 489
House/condo owner moved in on average 7 years ago
Renter moved in on average 3 years ago

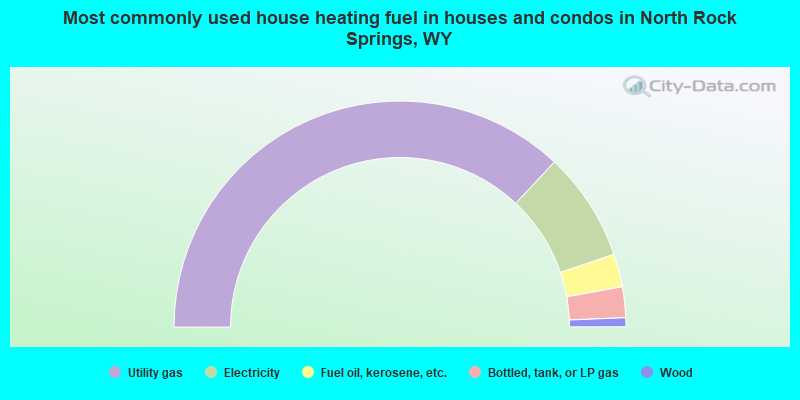
- 73.9%Utility gas
- 15.6%Electricity
- 4.7%Fuel oil, kerosene, etc.
- 4.4%Bottled, tank, or LP gas
- 1.3%Wood
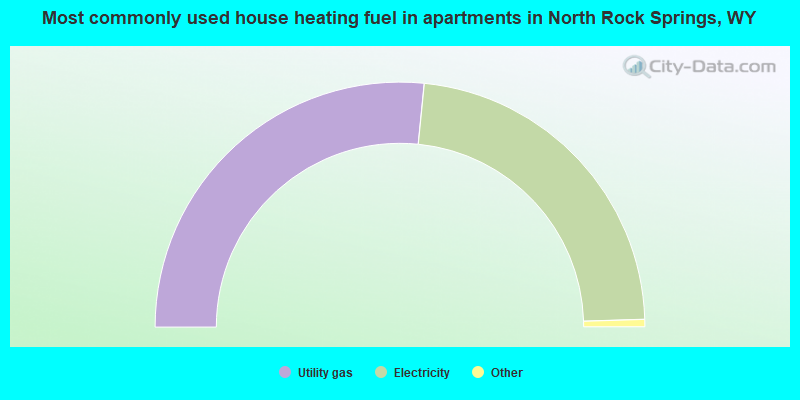
- 53.7%Utility gas
- 46.3%Electricity
Private vs. public school enrollment:
| Here: | 19.3% |
| Wyoming: | 7.3% |
| Here: | 0.0% |
| Wyoming: | 6.0% |
| Here: | 22.6% |
| Wyoming: | 9.2% |


