North Star, DE (Delaware) Houses and Residents
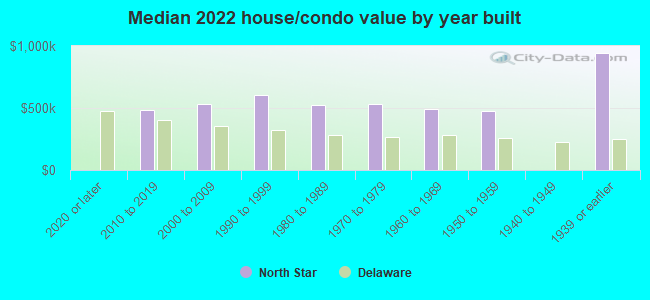
| North Star: | $538,879 |
| Delaware: | $337,200 |
Mean price in 2022:
Detached houses: $584,276
Here: $584,276 State: $419,599 Townhouses or other attached units: $470,415
Here: $470,415 State: $291,415
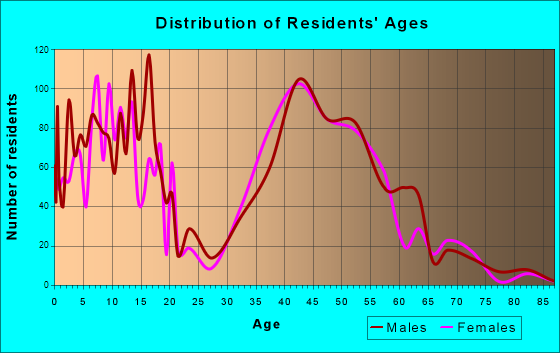
Total population: 7,980 (Urban population: 7,978, Rural population: 299 (all nonfarm))
Houses: 3,225 (3,130 occupied: 2,730 owner occupied, 411 renter occupied)
| % of renters here: | 13% |
| State: | 26% |
Housing density: 471 houses/condos per square mile
Median price asked for vacant for-sale houses and condos in 2022 in this county: $238,015.
Median gross rent in North Star, DE in 2022: $-661,140,416
Housing units in North Star with a mortgage: 1,691 (280 second mortgage, 0 home equity loan, 263 both second mortgage and home equity loan)
Houses without a mortgage: 147
Median household income for houses/condos with a mortgage: $172,988
Median household income for apartments without a mortgage: $119,477
Median monthly housing costs: $1,900
Compare current foreclosures near North Star, DE:
| Photo | Address | Area | Beds / Baths | Price | Details |
|---|---|---|---|---|---|

|
#1
N Norman Ave
Penns Grove, NJ 08069
|
882 sq. feet
|
1 baths 2 beds |
$74,900
|
show details |

|
#2
N Pine St
Wilmington, DE 19802
|
1,125 sq. feet
|
1 baths 3 beds |
$199,900
|
show details |

|
#3
E Chestnut St
Coatesville, PA 19320
|
1,088 sq. feet
|
1 baths 3 beds |
$65,870
|
show details |

|
#4
Center Hall Rd
Cochranville, PA 19330
|
1,472 sq. feet
|
1 baths 3 beds |
$120,017
|
show details |

|
#5
Richard Wilson Dr
Coatesville, PA 19320
|
1,232 sq. feet
|
2 baths 3 beds |
$77,932
|
show details |

|
#6
Madison St
Coatesville, PA 19320
|
1,880 sq. feet
|
1 baths 3 beds |
$137,707
|
show details |

|
#7
S 5th Ave
Coatesville, PA 19320
|
1,702 sq. feet
|
1 baths 3 beds |
$157,057
|
show details |

|
#8
Hazelwood Ave
Downingtown, PA 19335
|
960 sq. feet
|
1 baths 3 beds |
$205,722
|
show details |

|
#9
Larchwood Rd
West Chester, PA 19382
|
2,276 sq. feet
|
2 baths 3 beds |
$3,640
|
show details |

|
#10
Magpie Ln
Coatesville, PA 19320
|
1,968 sq. feet
|
2 baths 3 beds |
$141,863
|
show details |
| Photo | Address | Area | Beds / Baths | Price | Details |
|---|---|---|---|---|---|

|
#11
Stirling St
Coatesville, PA 19320
|
1,462 sq. feet
|
1 baths 3 beds |
$120,087
|
show details |

|
#12
E Chestnut St
Coatesville, PA 19320
|
2,244 sq. feet
|
2 baths 3 beds |
$181,235
|
show details |

|
#13
Mimosa Cir
Kennett Square, PA 19348
|
2,024 sq. feet
|
2 baths 3 beds |
$500,493
|
show details |

|
#14
Ewing Rd
Cochranville, PA 19330
|
3,110 sq. feet
|
1 baths 6 beds |
$471,404
|
show details |

|
#15
W Main St
Coatesville, PA 19320
|
1,300 sq. feet
|
1 baths 3 beds |
$192,463
|
show details |

|
#16
Flint Hill Rd
Landenberg, PA 19350
|
960 sq. feet
|
1 baths 2 beds |
$75,282
|
show details |

|
#17
Valley Rd
Coatesville, PA 19320
|
2,170 sq. feet
|
2 baths 3 beds |
$179,599
|
show details |

|
#18
Barnsley Rd
Oxford, PA 19363
|
1,288 sq. feet
|
1 baths 3 beds |
$176,718
|
show details |

|
#19
Birkdale Cir
Avondale, PA 19311
|
3,334 sq. feet
|
2 baths 4 beds |
$368,645
|
show details |

|
#20
Overhill Rd
Coatesville, PA 19320
|
1,104 sq. feet
|
1 baths 3 beds |
$125,456
|
show details |
| Photo | Address | Area | Beds / Baths | Price | Details |
|---|---|---|---|---|---|

|
#21
Little John Cir
Avondale, PA 19311
|
2,668 sq. feet
|
2 baths 4 beds |
$389,391
|
show details |

|
#22
E Miner St
West Chester, PA 19382
|
2,018 sq. feet
|
2 baths 5 beds |
$201,786
|
show details |

|
#23
Doe Run Rd
Coatesville, PA 19320
|
1,112 sq. feet
|
1 baths 2 beds |
$8,223
|
show details |

|
#24
Conner Rd
Oxford, PA 19363
|
1,568 sq. feet
|
2 baths 3 beds |
$217,831
|
show details |

|
#25
Hazel Ave
Kennett Square, PA 19348
|
2,344 sq. feet
|
2 baths 3 beds |
$198,715
|
show details |

|
#26
Lafayette Ave
Coatesville, PA 19320
|
1,120 sq. feet
|
1 baths 3 beds |
$119,212
|
show details |

|
#27
S Guernsey Rd
West Grove, PA 19390
|
2,400 sq. feet
|
3 baths 6 beds |
$283,973
|
show details |

|
#28
Township Rd
Lincoln University, PA 19352
|
1,596 sq. feet
|
1 baths 2 beds |
$273,125
|
show details |

|
#29
Stonegate Dr
Downingtown, PA 19335
|
2,870 sq. feet
|
2 baths 4 beds |
$5,336
|
show details |

|
#30
Wagners Ln
Coatesville, PA 19320
|
2,910 sq. feet
|
2 baths 4 beds |
$568,157
|
show details |
| Photo | Address | Area | Beds / Baths | Price | Details |
|---|---|---|---|---|---|

|
#31
Coventry Ln
West Chester, PA 19382
|
1,580 sq. feet
|
2 baths 3 beds |
$205,686
|
show details |

|
#32
Andrew Cir
Coatesville, PA 19320
|
1,536 sq. feet
|
1 baths 2 beds |
$125,834
|
show details |

|
#33
Schoolview Ln
Oxford, PA 19363
|
3,504 sq. feet
|
2 baths 4 beds |
$346,389
|
show details |

|
#34
Poorhouse Rd
Downingtown, PA 19335
|
2,402 sq. feet
|
2 baths 3 beds |
$496,564
|
show details |

|
#35
Briarcliff Cir
West Grove, PA 19390
|
3,423 sq. feet
|
2 baths 4 beds |
$337,610
|
show details |

|
#36
Olive St
Coatesville, PA 19320
|
2,081 sq. feet
|
2 baths 4 beds |
$177,288
|
show details |

|
#37
Walnut Valley Rd
Chadds Ford, PA 19317
|
2,248 sq. feet
|
2 baths 3 beds |
$518,830
|
show details |

|
#38
Grove Rd
West Chester, PA 19380
|
875 sq. feet
|
1 baths 3 beds |
$19,782
|
show details |

|
#39
Gap Newport Pike
Avondale, PA 19311
|
1,094 sq. feet
|
1 baths 3 beds |
$10,236
|
show details |

|
#40
Country Run Dr
Coatesville, PA 19320
|
1,579 sq. feet
|
2 baths 3 beds |
$183,494
|
show details |
| Photo | Address | Area | Beds / Baths | Price | Details |
|---|---|---|---|---|---|

|
#41
Autumn Trl
Coatesville, PA 19320
|
2,820 sq. feet
|
2 baths 4 beds |
$308,490
|
show details |

|
#42
Glen Ave
West Chester, PA 19382
|
1,240 sq. feet
|
1 baths 3 beds |
$218,966
|
show details |

|
#43
Leeward St
Coatesville, PA 19320
|
1,746 sq. feet
|
2 baths 3 beds |
$274,728
|
show details |

|
#44
Huntington Cir
Coatesville, PA 19320
|
3,124 sq. feet
|
3 baths 4 beds |
$71,206
|
show details |

|
#45
Media Rd
Oxford, PA 19363
|
1,155 sq. feet
|
1 baths 2 beds |
$211,938
|
show details |

|
#46
Astor Ct
Downingtown, PA 19335
|
1,439 sq. feet
|
2 baths 3 beds |
$3,245
|
show details |

|
#47
Barclay Dr
Pennsville, NJ 08070
|
1,698 sq. feet
|
1 baths 4 beds |
show details | |

|
#48
Brayden Dr
Marcus Hook, PA 19061
|
- sq. feet
|
2 baths 3 beds |
show details | |

|
#49
Poplar St
Coatesville, PA 19320
|
1,952 sq. feet
|
2 baths 4 beds |
show details | |

|
Check over 1 million property listings on Foreclosure.com!
|
browse all offers | |||


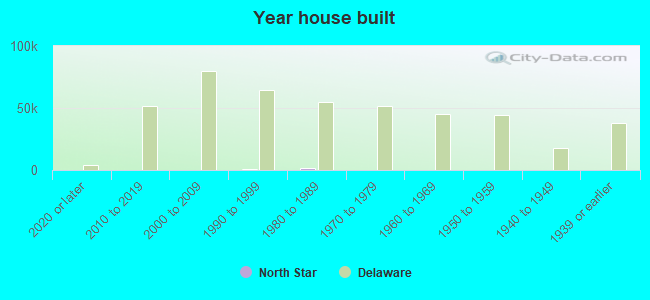
Median year apartment built: 1998
Household type by relationship:
Households: 8,442- Male householders: 1,813 (95 living alone), Female householders: 1,305 (293 living alone)
2,271 spouses (2,254 opposite-sex spouses), 86 unmarried partners, (86 opposite-sex unmarried partners), 2,668 children (2,571 natural, 75 adopted, 22 stepchildren), 45 grandchildren, 24 brothers or sisters, 101 parents, 0 foster children, 17 other relatives, 107 non-relatives
Size of family households: 1,300 2-persons, 559 3-persons, 543 4-persons, 181 5-persons, 19 6-persons, 51 7-or-more-persons.
Size of nonfamily households: 398 1-person, 68 2-persons.
1,426 married couples with children.
122 single-parent households (60 men, 62 women).
87.1% of residents of North Star speak English at home.
6.2% of residents speak other Indo-European language at home (84% speak English very well, 15% speak English well, 1% speak English not well).
7.0% of residents speak Asian or Pacific Island language at home (78% speak English very well, 14% speak English well, 5% speak English not well, 3% don't speak English at all).
0.3% of residents speak other language at home (100% speak English very well).
Foreign born population: 1,059 (12.5%)
(74.0% of them are naturalized citizens)
| Here: | 9.9 |
| State: | 6.9 |
| Here: | 6.6 |
| State: | 4.4 |
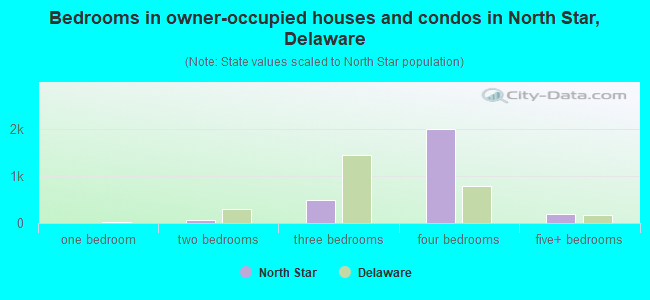
- Bedrooms in owner-occupied houses and condos in North Star, Delaware
- 0no bedroom
- 01 bedroom
- 552 bedrooms
- 4853 bedrooms
- 1,9994 bedrooms
- 1925+ bedrooms
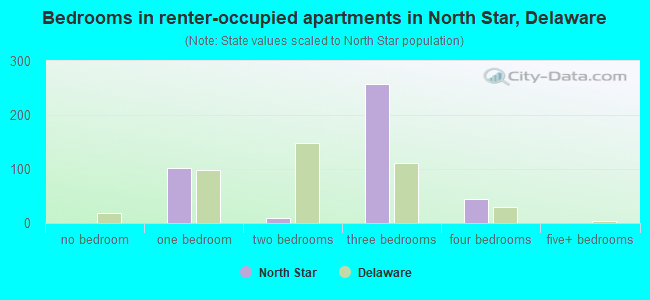
- Bedrooms in renter-occupied apartments in North Star, Delaware
- 0no bedroom
- 1011 bedroom
- 102 bedrooms
- 2573 bedrooms
- 444 bedrooms
- 05+ bedrooms
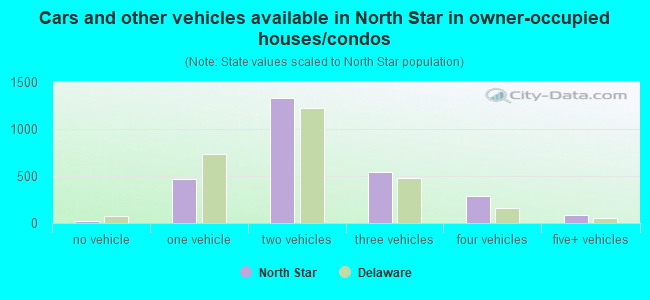
- Cars and other vehicles available in North Star in owner-occupied houses/condos
- 19no vehicle
- 4651 vehicle
- 1,3312 vehicles
- 5413 vehicles
- 2884 vehicles
- 865+ vehicles
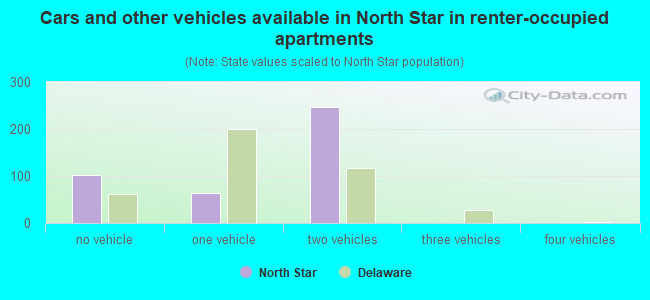
- Cars and other vehicles available in North Star in renter-occupied apartments
- 102no vehicle
- 631 vehicle
- 2472 vehicles
- 03 vehicles
- 04 vehicles
- 05+ vehicles
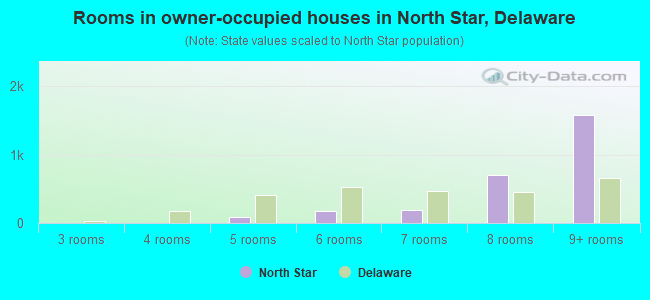
- Rooms in owner-occupied houses in North Star, Delaware
- 01 room
- 02 rooms
- 03 rooms
- 74 rooms
- 835 rooms
- 1796 rooms
- 1837 rooms
- 6988 rooms
- 1,5809+ rooms
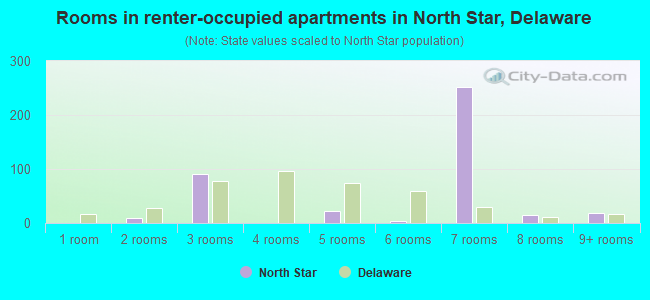
- Rooms in renter-occupied apartments in North Star, Delaware
- 01 room
- 102 rooms
- 903 rooms
- 04 rooms
- 235 rooms
- 46 rooms
- 2517 rooms
- 148 rooms
- 189+ rooms
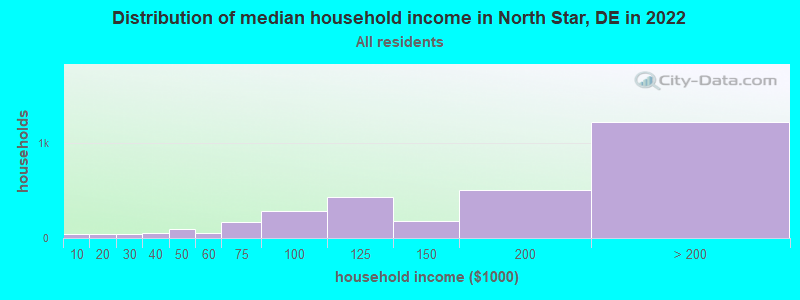
North Star, DE household income distribution

- 44Less than $10,000
- 45$10,000 to $19,999
- 39$20,000 to $29,999
- 48$30,000 to $39,999
- 99$40,000 to $49,999
- 56$50,000 to $59,999
- 167$60,000 to $74,999
- 290$75,000 to $99,999
- 438$100,000 to $124,999
- 181$125,000 to $149,999
- 510$150,000 to $199,999
- 1,225$200,000 or more
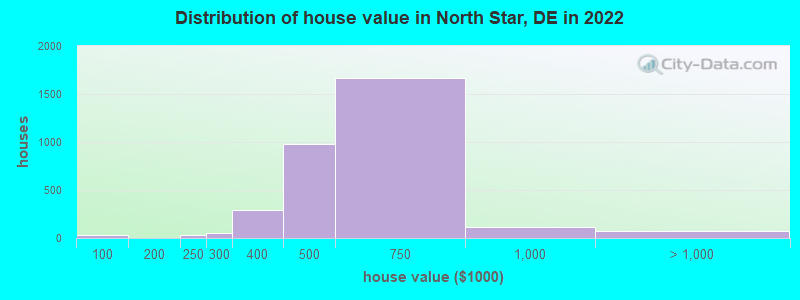
Home value of owner - occupied houses in 2022 in North Star, DE
-
- 28$50,000 to $59,999
- 26$200,000 to $249,999
- 51$250,000 to $299,999
- 288$300,000 to $399,999
- 975$400,000 to $499,999
- 1,669$500,000 to $749,999
- 112$750,000 to $999,999
- 57$1,000,000 to $1,499,999
- 16$1,500,000 to $1,999,999
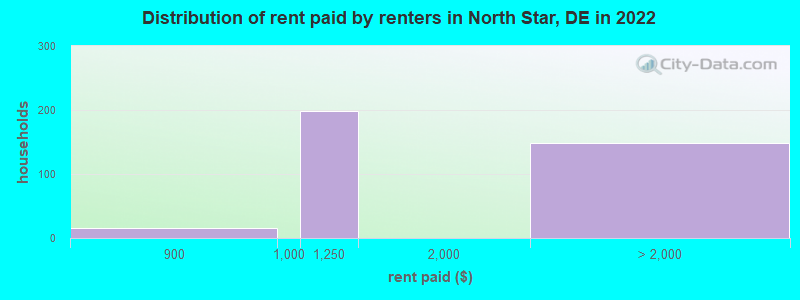
Rent paid by renters in 2022 in North Star, DE
-
- 15$800 to $899
- 197$1,000 to $1,249
- 20$2,000 to $2,499
- 23$2,500 to $2,999
- 78$3,500 or more
- 25No cash rent
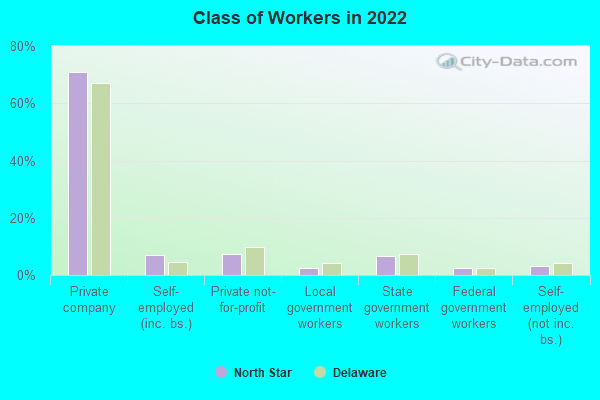
Percentage of workers working in this county: 90.5%
Number of people working at home: 841 (20.0% of all workers)
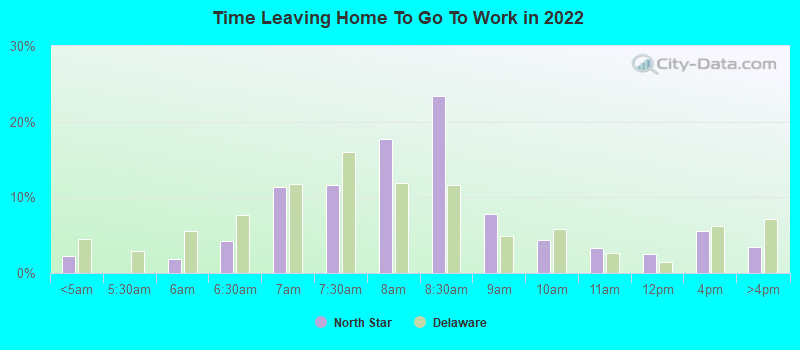
Travel time to work (commute)
- Less than 5 minutes: 183
- 5 to 9 minutes: 56
- 10 to 14 minutes: 238
- 15 to 19 minutes: 729
- 20 to 24 minutes: 558
- 25 to 29 minutes: 750
- 30 to 34 minutes: 516
- 35 to 39 minutes: 159
- 40 to 44 minutes: 158
- 45 to 59 minutes: 70
- 60 to 89 minutes: 61
- 90 or more minutes: 18
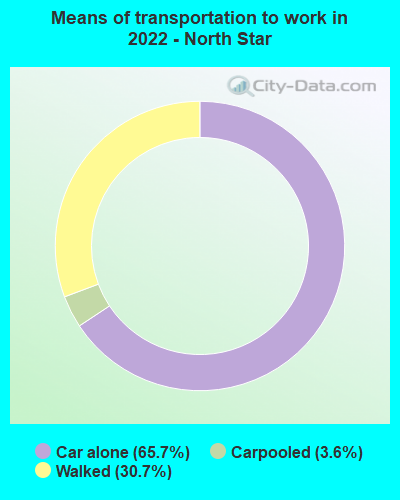
Means of transportation to work:
- Drove a car alone: 418 (32.0%)
- Carpooled: 21 (1.6%)
- Walked: 204 (15.6%)
- Worked at home: 841 (64.4%)
- Unemployment by race in 2022
- Unemployment rate for White non-Hispanic residents
- 2.2%Males
- 5.5%Females
- Unemployment rate for Asian residents
- 3.1%Males
- Unemployment rate for two or more race residents
- 8.8%Males
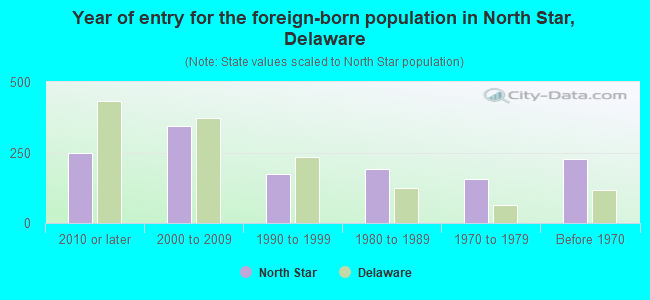
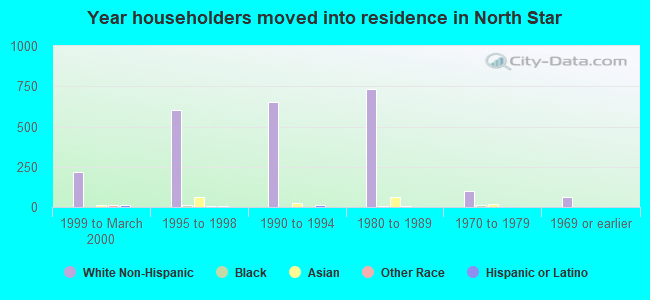
- Year of entry for the foreign-born population in North Star, Delaware
- 2492010 or later
- 3452000 to 2009
- 1731990 to 1999
- 1931980 to 1989
- 1571970 to 1979
- 227Before 1970
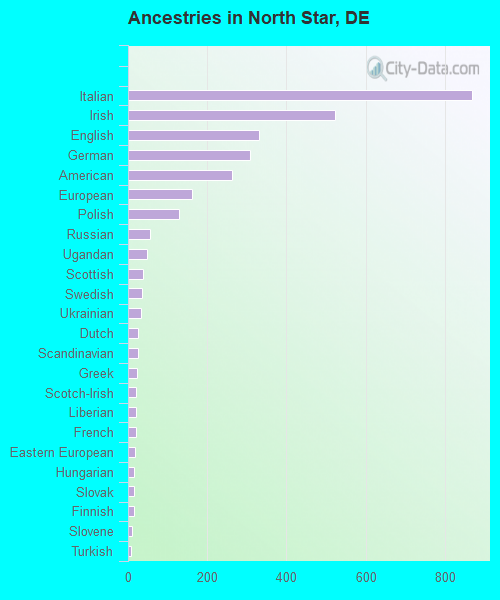
First ancestries reported:
- Italian: 868 (20.8%)
- Irish: 523 (12.5%)
- English: 331 (7.9%)
- German: 307 (7.4%)
- American: 262 (6.3%)
- European: 162 (3.9%)
- Polish: 130 (3.1%)
- Russian: 55 (1.3%)
- Ugandan: 49 (1.2%)
- Scottish: 38 (0.9%)
- Swedish: 35 (0.8%)
- Ukrainian: 32 (0.8%)
- Dutch: 24 (0.6%)
- Scandinavian: 24 (0.6%)
- Greek: 22 (0.5%)
- Scotch-Irish: 21 (0.5%)
- Liberian: 20 (0.5%)
- French: 19 (0.5%)
- Eastern European: 18 (0.4%)
- Hungarian: 16 (0.4%)
- Slovak: 15 (0.4%)
- Finnish: 14 (0.3%)
- Slovene: 9 (0.2%)
- Turkish: 8 (0.2%)
- Lebanese: 7 (0.2%)
- Iranian: 7 (0.2%)
- Lithuanian: 6 (0.1%)
- Romanian: 5 (0.1%)
- Nigerian: 1 (0.02%)
Most common places of birth for foreign-born residents (%):
| North Star: | 31.7% (334) |
| Delaware: | 11.6% (11,288) |
| North Star: | 19.1% (201) |
| Delaware: | 5.7% (5,583) |
| North Star: | 5.8% (61) |
| Delaware: | 1.4% (1,388) |
| North Star: | 4.8% (51) |
| Delaware: | 1.4% (1,345) |
| North Star: | 3.0% (32) |
| Delaware: | 0.9% (834) |
| North Star: | 2.9% (31) |
| Delaware: | 0.9% (911) |
| North Star: | 2.9% (31) |
| Delaware: | 0.1% (53) |
| North Star: | 2.9% (30) |
| Delaware: | 0.9% (846) |
| North Star: | 2.4% (25) |
| Delaware: | 0.8% (776) |
| North Star: | 2.3% (24) |
| Delaware: | 1.6% (1,552) |
| North Star: | 2.1% (22) |
| Delaware: | 0.2% (174) |
| North Star: | 1.8% (19) |
| Delaware: | 1.4% (1,373) |
| North Star: | 1.7% (18) |
| Delaware: | 1.3% (1,297) |
| North Star: | 1.6% (17) |
| Delaware: | 0.5% (533) |
| North Star: | 1.5% (16) |
| Delaware: | 0.1% (84) |
Place of birth for U.S.-born residents:
- This state: 3,375
- Other state: 3,954
- Northeast: 2,523
- Midwest: 358
- South: 917
- West: 138
92.8% of North Star residents lived in the same house 1 years ago.
Out of people who lived in different houses, 31.7% lived in this county.
Out of people who lived in different counties, 0.0% lived in Delaware.
| North Star: | 92.8% |
| State average: | 89.2% |
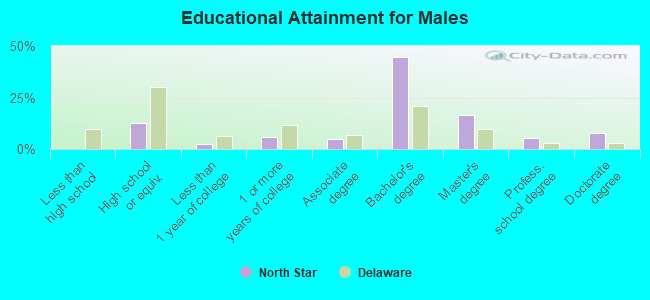
Education attainment for males 25 years and older:
- No schooling: 0
- Nursery to 4th grade: 0
- 5th and 6th grade: 0
- 7th and 8th grade: 0
- 9th grade: 0
- 10th grade: 0
- 11th grade: 7
- 12th grade, no diploma: 0
- High school graduate (or equivalency): 359
- Less than 1 year of college: 75
- Some college more than 1 year, no degree: 164
- Associate degree: 145
- Bachelor's degree: 1,289
- Master's degree: 472
- Professional school degree: 147
- Doctorate degree: 218
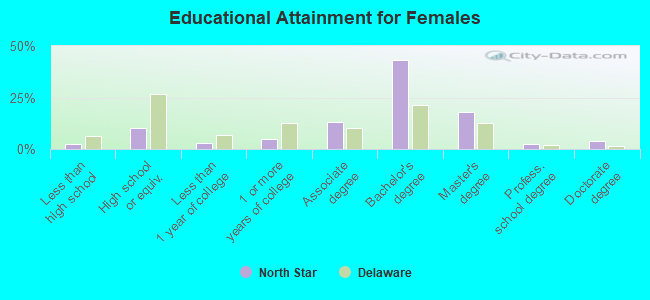
Education attainment for females 25 years and older:
- No schooling: 32
- Nursery to 4th grade: 2
- 5th and 6th grade: 0
- 7th and 8th grade: 0
- 9th grade: 14
- 10th grade: 0
- 11th grade: 22
- 12th grade, no diploma: 3
- High school graduate (or equivalency): 328
- Less than 1 year of college: 98
- Some college more than 1 year, no degree: 156
- Associate degree: 425
- Bachelor's degree: 1,413
- Master's degree: 591
- Professional school degree: 75
- Doctorate degree: 129
Housing units in structures:
- One, detached: 2,935
- One, attached: 179
- 50 or more: 110
Housing units lacking complete kitchen facilities in 2022: 0.3%
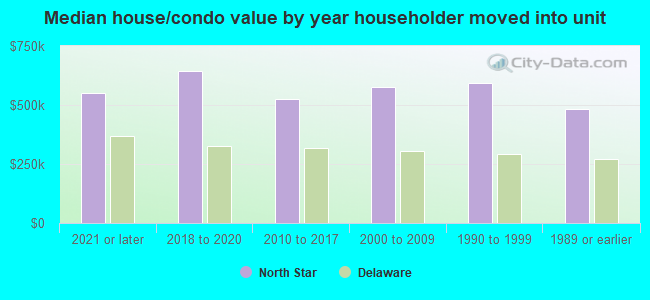
House/condo owner moved in on average 23 years ago
Renter moved in on average 1 years ago
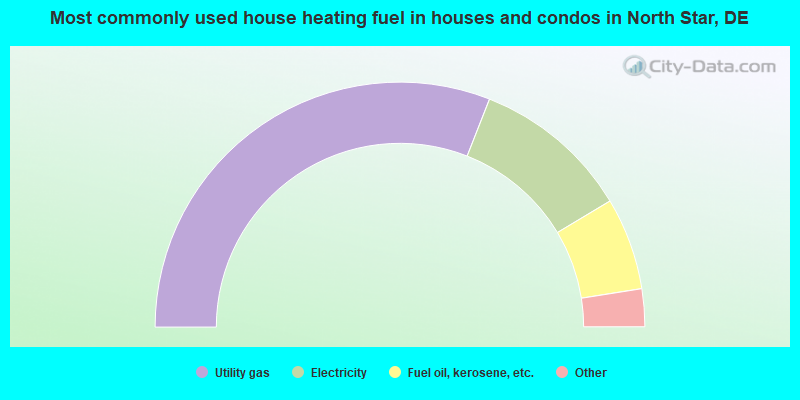
- 62.0%Utility gas
- 20.9%Electricity
- 12.2%Fuel oil, kerosene, etc.
- 3.6%Bottled, tank, or LP gas
- 0.6%Wood
- 0.4%No fuel used
- 0.3%Solar energy
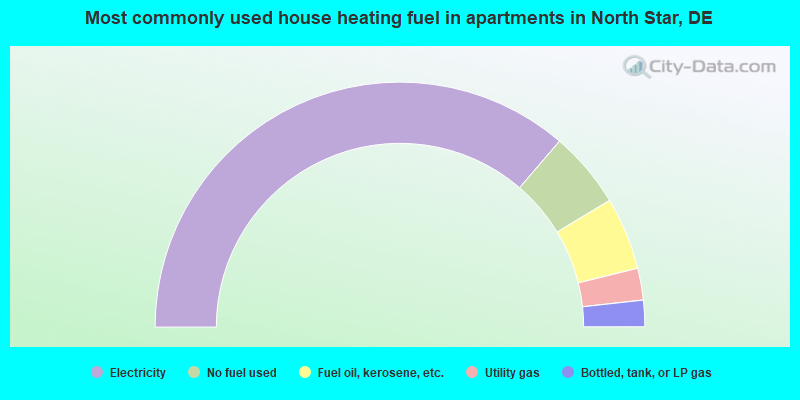
- 72.6%Electricity
- 10.1%No fuel used
- 9.6%Fuel oil, kerosene, etc.
- 4.2%Utility gas
- 3.5%Bottled, tank, or LP gas
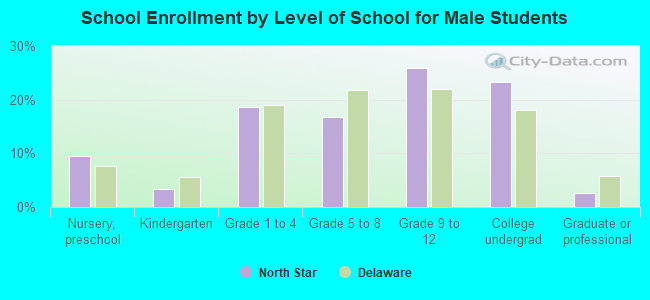
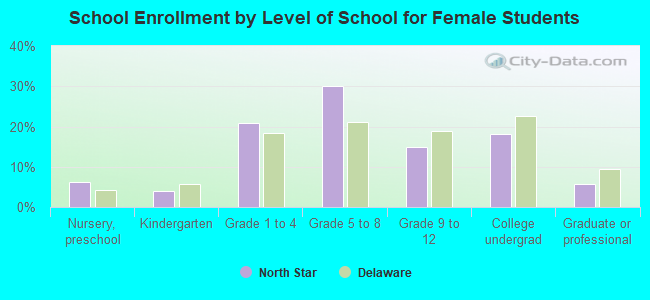
Private vs. public school enrollment:
| Here: | 21.4% |
| Delaware: | 11.5% |
| Here: | 20.0% |
| Delaware: | 12.1% |
| Here: | 26.0% |
| Delaware: | 19.2% |