Northern Cambria, PA (Pennsylvania) Houses and Residents
| Northern Cambria: | $87,889 |
| Pennsylvania: | $245,500 |
Total population: 3,694 (All urban)
Houses: 1,520 (1,386 occupied: 963 owner occupied, 416 renter occupied)
| % of renters here: | 30% |
| State: | 31% |
Housing density: 507 houses/condos per square mile
Median price asked for vacant for-sale houses and condos in 2022 in this county: $90,499.
Median contract rent in 2022: $427 (lower quartile is $266, upper quartile is $489)
Median rent asked for vacant for-rent units in 2022: $465
Median gross rent in Northern Cambria, PA in 2022: $509
Housing units in Northern Cambria with a mortgage: 270 (12 second mortgage, 0 home equity loan, 11 both second mortgage and home equity loan)
Houses without a mortgage: 0
Median household income for houses/condos with a mortgage: $83,156
Median household income for apartments without a mortgage: $56,479
Median monthly housing costs: $560
Compare current foreclosures near Northern Cambria, PA:
| Photo | Address | Area | Beds / Baths | Price | Details |
|---|---|---|---|---|---|

|
#1
Barr Ave
Northern Cambria, PA 15714
|
- sq. feet
|
2 baths 3 beds |
show details | |

|
#2
39th St
Northern Cambria, PA 15714
|
- sq. feet
|
- baths - beds |
show details | |

|
#3
Park Ave
Northern Cambria, PA 15714
|
- sq. feet
|
- baths - beds |
show details | |

|
#4
Campbell Ave
Northern Cambria, PA 15714
|
- sq. feet
|
- baths - beds |
show details | |

|
#5
Chestnut Ave
Northern Cambria, PA 15714
|
- sq. feet
|
- baths - beds |
show details | |

|
#6
Elm Rd
Northern Cambria, PA 15714
|
- sq. feet
|
- baths - beds |
show details | |

|
#7
David St
Northern Cambria, PA 15714
|
- sq. feet
|
- baths - beds |
show details | |

|
#8
Barr Ave
Northern Cambria, PA 15714
|
- sq. feet
|
- baths - beds |
show details | |

|
#9
Ann St
Northern Cambria, PA 15714
|
- sq. feet
|
- baths - beds |
show details | |

|
#10
Madera Ave
Northern Cambria, PA 15714
|
- sq. feet
|
- baths - beds |
show details |
| Photo | Address | Area | Beds / Baths | Price | Details |
|---|---|---|---|---|---|

|
#11
Crosby Ave
Northern Cambria, PA 15714
|
- sq. feet
|
- baths - beds |
show details | |

|
#12
W Milton St
Ebensburg, PA 15931
|
4,394 sq. feet
|
- baths 5 beds |
$169,000
|
show details |

|
#13
5th St
Colver, PA 15927
|
903 sq. feet
|
1 baths 2 beds |
show details | |

|
#14
White Ln
Saint Benedict, PA 15773
|
954 sq. feet
|
1 baths 2 beds |
show details | |

|
#15
Pershing St
Gallitzin, PA 16641
|
1,306 sq. feet
|
1 baths 3 beds |
show details | |

|
#16
Reese Ave
Colver, PA 15927
|
2,304 sq. feet
|
1 baths 4 beds |
show details | |

|
#17
Caroline St
Nanty Glo, PA 15943
|
- sq. feet
|
- baths - beds |
$34,900
|
show details |

|
#18
Hancock St
Clymer, PA 15728
|
- sq. feet
|
1 baths 2 beds |
show details | |

|
#19
Fiske Rd
Fallentimber, PA 16639
|
- sq. feet
|
1 baths 3 beds |
show details | |

|
#20
Barkley Church Rd
Homer City, PA 15748
|
- sq. feet
|
- baths - beds |
show details |
| Photo | Address | Area | Beds / Baths | Price | Details |
|---|---|---|---|---|---|

|
#21
Allen Bridge Rd
Indiana, PA 15701
|
- sq. feet
|
- baths - beds |
show details | |

|
#22
Bracken St
Johnstown, PA 15909
|
- sq. feet
|
- baths - beds |
show details | |

|
#23
Springhouse Ln
Mineral Point, PA 15942
|
- sq. feet
|
- baths - beds |
show details | |

|
#24
2nd St
Nanty Glo, PA 15943
|
- sq. feet
|
- baths - beds |
show details | |

|
#25
Race St
Nanty Glo, PA 15943
|
- sq. feet
|
- baths - beds |
show details | |

|
#26
Purchase Line Rd
Dixonville, PA 15734
|
- sq. feet
|
- baths - beds |
show details | |

|
#27
Forest Dr
Ebensburg, PA 15931
|
- sq. feet
|
- baths - beds |
show details | |

|
#28
Route 553 Hwy
Penn Run, PA 15765
|
- sq. feet
|
- baths - beds |
show details | |

|
#29
Penn Run Aly
Penn Run, PA 15765
|
- sq. feet
|
- baths - beds |
show details | |

|
#30
E High St
Ebensburg, PA 15931
|
- sq. feet
|
- baths - beds |
show details |
| Photo | Address | Area | Beds / Baths | Price | Details |
|---|---|---|---|---|---|

|
#31
Franklin St
Clymer, PA 15728
|
- sq. feet
|
- baths - beds |
show details | |

|
#32
Pennsylvania Ave
Cresson, PA 16630
|
- sq. feet
|
- baths - beds |
show details | |

|
#33
William Penn Ave
Johnstown, PA 15909
|
- sq. feet
|
- baths - beds |
show details | |

|
#34
Grant St
Gallitzin, PA 16641
|
- sq. feet
|
- baths - beds |
show details | |

|
#35
Spruce Grove Rd
Clymer, PA 15728
|
- sq. feet
|
- baths - beds |
show details | |

|
#36
Wood Ave
Revloc, PA 15948
|
- sq. feet
|
- baths - beds |
show details | |

|
#37
Engle Rd
Clymer, PA 15728
|
- sq. feet
|
- baths - beds |
show details | |

|
#38
Cambria Ave, Apt 3
Revloc, PA 15948
|
- sq. feet
|
- baths - beds |
show details | |

|
#39
Rager Rd
Cherry Tree, PA 15724
|
- sq. feet
|
- baths - beds |
show details | |

|
#40
Bakersville Rd
Colver, PA 15927
|
- sq. feet
|
- baths - beds |
show details |
| Photo | Address | Area | Beds / Baths | Price | Details |
|---|---|---|---|---|---|

|
#41
Route 286 Hwy E
Glen Campbell, PA 15742
|
- sq. feet
|
- baths - beds |
show details | |

|
#42
Sterling Rd
Carrolltown, PA 15722
|
- sq. feet
|
- baths - beds |
show details | |

|
#43
Ben Franklin Hwy, # 31
Belsano, PA 15922
|
- sq. feet
|
- baths - beds |
show details | |

|
#44
Roland Dr
Westover, PA 16692
|
- sq. feet
|
- baths - beds |
show details | |

|
#45
Route 403 Hwy S
Homer City, PA 15748
|
- sq. feet
|
- baths - beds |
show details | |

|
#46
Main St
Hastings, PA 16646
|
- sq. feet
|
- baths - beds |
show details | |

|
#47
Spring Hill Ln
Loretto, PA 15940
|
- sq. feet
|
- baths - beds |
show details | |

|
#48
Irvona Rd
Irvona, PA 16656
|
- sq. feet
|
- baths - beds |
show details | |

|
#49
Pike Rd
Johnstown, PA 15909
|
- sq. feet
|
- baths - beds |
show details | |

|
Check over 1 million property listings on Foreclosure.com!
|
browse all offers | |||


 | Future of Johnstown/Cambria County (42 replies) |
| Why is area municipal fragmentation so hard to solve? (107 replies) |
| information on ebensburg?......schools, housing, is it safe? (5 replies) |
| need help, we are moving to Johnstown, pa. (28 replies) |
| Looking to Relocate from Southern Cali to PA - Need some Info (39 replies) |
| New or Nearly New (5 replies) |

Median year apartment built: 1961
Household type by relationship:
Households: 3,499- Male householders: 735 (297 living alone), Female householders: 633 (122 living alone)
536 spouses (536 opposite-sex spouses), 106 unmarried partners, (98 opposite-sex unmarried partners), 1,377 children (1,332 natural, 23 adopted, 21 stepchildren), 22 grandchildren, 8 brothers or sisters, 6 parents, 0 foster children, 0 other relatives, 48 non-relatives
- In group quarters: 22
Size of family households: 427 2-persons, 187 3-persons, 121 4-persons, 152 5-persons, 31 6-persons.
Size of nonfamily households: 406 1-person, 53 2-persons.
185 married couples with children.
931 single-parent households (463 men, 468 women).
96.4% of residents of Northern Cambria speak English at home.
0.4% of residents speak Spanish at home (71% speak English very well, 29% speak English well).
2.6% of residents speak other Indo-European language at home (100% speak English well).
| Here: | 6.5 |
| State: | 6.8 |
| Here: | 5.6 |
| State: | 4.3 |

- Bedrooms in owner-occupied houses and condos in Northern Cambria, Pennsylvania
- 16no bedroom
- 01 bedroom
- 2632 bedrooms
- 4733 bedrooms
- 2114 bedrooms
- 05+ bedrooms

- Bedrooms in renter-occupied apartments in Northern Cambria, Pennsylvania
- 0no bedroom
- 1101 bedroom
- 892 bedrooms
- 863 bedrooms
- 1314 bedrooms
- 05+ bedrooms

- Cars and other vehicles available in Northern Cambria in owner-occupied houses/condos
- 93no vehicle
- 3571 vehicle
- 2872 vehicles
- 1103 vehicles
- 814 vehicles
- 355+ vehicles

- Cars and other vehicles available in Northern Cambria in renter-occupied apartments
- 85no vehicle
- 1751 vehicle
- 1052 vehicles
- 523 vehicles
- 04 vehicles
- 05+ vehicles

- Rooms in owner-occupied houses in Northern Cambria, Pennsylvania
- 161 room
- 02 rooms
- 03 rooms
- 874 rooms
- 2175 rooms
- 2036 rooms
- 1797 rooms
- 838 rooms
- 1799+ rooms

- Rooms in renter-occupied apartments in Northern Cambria, Pennsylvania
- 01 room
- 02 rooms
- 823 rooms
- 274 rooms
- 705 rooms
- 1486 rooms
- 177 rooms
- 348 rooms
- 409+ rooms


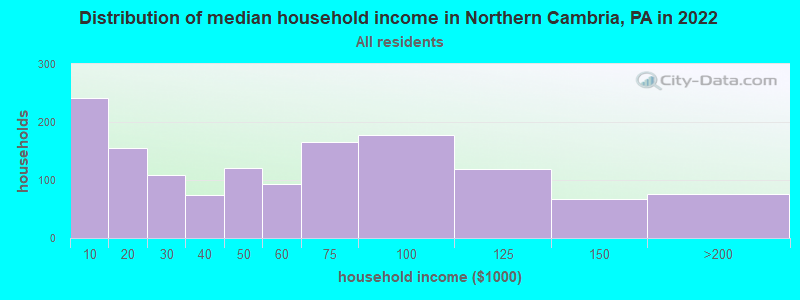
Northern Cambria, PA household income distribution

- 241Less than $10,000
- 155$10,000 to $19,999
- 109$20,000 to $29,999
- 75$30,000 to $39,999
- 120$40,000 to $49,999
- 93$50,000 to $59,999
- 166$60,000 to $74,999
- 177$75,000 to $99,999
- 119$100,000 to $124,999
- 68$125,000 to $149,999
- 76$150,000 to $199,999
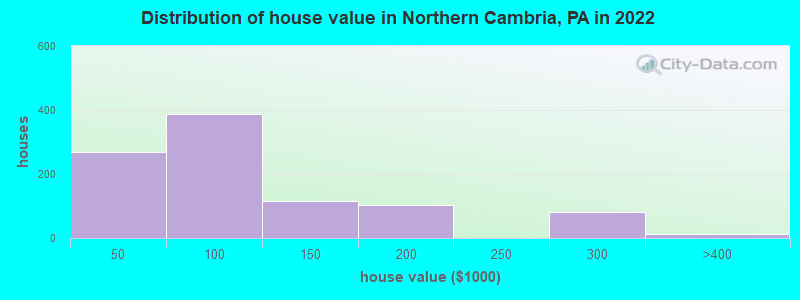
Home value of owner - occupied houses in 2022 in Northern Cambria, PA
-
- 24Less than $10,000
- 15$10,000 to $14,999
- 78$15,000 to $19,999
- 29$20,000 to $24,999
- 47$25,000 to $29,999
- 23$30,000 to $34,999
- 11$35,000 to $39,999
- 38$40,000 to $49,999
- 91$50,000 to $59,999
- 114$70,000 to $79,999
- 61$80,000 to $89,999
- 80$90,000 to $99,999
- 77$100,000 to $124,999
- 38$125,000 to $149,999
- 102$175,000 to $199,999
- 80$250,000 to $299,999
- 12$300,000 to $399,999
Rent paid by renters in 2022 in Northern Cambria, PA
-
- 15Less than $100
- 20$100 to $149
- 9$200 to $249
- 35$300 to $349
- 23$350 to $399
- 43$400 to $449
- 42$450 to $499
- 72$500 to $549
- 9$750 to $799
- 43$1,000 to $1,249
- 46No cash rent


Percentage of workers working in this county: 78.4%
Number of people working at home: 43 (3.1% of all workers)
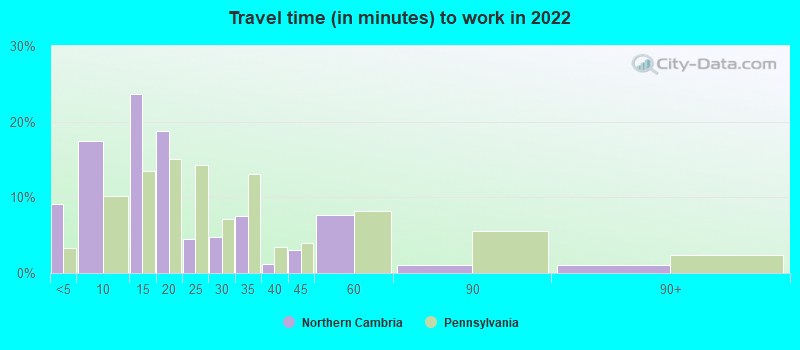
Travel time to work (commute)
- Less than 5 minutes: 159
- 5 to 9 minutes: 243
- 10 to 14 minutes: 194
- 15 to 19 minutes: 169
- 20 to 24 minutes: 35
- 25 to 29 minutes: 33
- 30 to 34 minutes: 84
- 35 to 39 minutes: 28
- 40 to 44 minutes: 215
- 45 to 59 minutes: 111
- 60 to 89 minutes: 9
- 90 or more minutes: 8
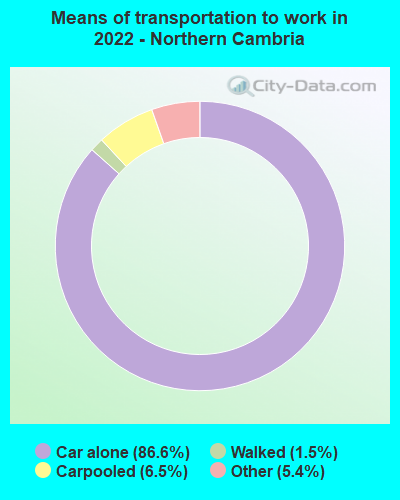
Means of transportation to work:
- Drove a car alone: 1,257 (82.0%)
- Carpooled: 93 (6.1%)
- Taxi: 92 (6.0%)
- Walked: 21 (1.4%)
- Worked at home: 41 (2.7%)

- Unemployment by race in 2022
- Unemployment rate for White non-Hispanic residents
- 11.8%Females

- Year of entry for the foreign-born population in Northern Cambria, Pennsylvania
- 01995 to March 2000
- 01990 to 1994
- 01985 to 1989
- 01980 to 1984
- 21975 to 1979
- 01970 to 1974
- 31965 to 1969
- 8Before 1965

First ancestries reported:
- German: 213 (16.2%)
- Italian: 198 (15.1%)
- Irish: 180 (13.7%)
- Slovak: 152 (11.6%)
- Polish: 130 (9.9%)
- European: 112 (8.5%)
- American: 72 (5.5%)
- English: 56 (4.3%)
- Pennsylvania German: 46 (3.5%)
- French: 31 (2.4%)
- Dutch: 14 (1.1%)
- Austrian: 12 (0.9%)
- Lebanese: 8 (0.6%)
- Swedish: 8 (0.6%)
- Ukrainian: 8 (0.6%)
- Hungarian: 7 (0.5%)
Most common places of birth for foreign-born residents (%):
| Northern Cambria: | 46.2% (6) |
| Pennsylvania: | 4.6% (23,171) |
| Northern Cambria: | 23.1% (3) |
| Pennsylvania: | 5.1% (25,685) |
| Northern Cambria: | 15.4% (2) |
| Pennsylvania: | 0.7% (3,451) |
| Northern Cambria: | 15.4% (2) |
| Pennsylvania: | 3.0% (15,200) |
Place of birth for U.S.-born residents:
- This state: 3,217
- Other state: 260
- Northeast: 20
- Midwest: 104
- South: 133
- West: 6
86.6% of Northern Cambria residents lived in the same house 1 years ago.
Out of people who lived in different houses, 42.0% lived in this county.
Out of people who lived in different counties, 74.7% lived in Pennsylvania.
| Northern Cambria: | 86.6% |
| State average: | 89.3% |
Education attainment for males 25 years and older:
- No schooling: 29
- Nursery to 4th grade: 0
- 5th and 6th grade: 0
- 7th and 8th grade: 0
- 9th grade: 12
- 10th grade: 6
- 11th grade: 9
- 12th grade, no diploma: 2
- High school graduate (or equivalency): 761
- Less than 1 year of college: 43
- Some college more than 1 year, no degree: 79
- Associate degree: 92
- Bachelor's degree: 222
- Master's degree: 10
- Professional school degree: 0
- Doctorate degree: 0

Education attainment for females 25 years and older:
- No schooling: 48
- Nursery to 4th grade: 0
- 5th and 6th grade: 0
- 7th and 8th grade: 4
- 9th grade: 19
- 10th grade: 15
- 11th grade: 9
- 12th grade, no diploma: 0
- High school graduate (or equivalency): 412
- Less than 1 year of college: 77
- Some college more than 1 year, no degree: 101
- Associate degree: 87
- Bachelor's degree: 119
- Master's degree: 72
- Professional school degree: 0
- Doctorate degree: 0


Housing units in structures:
- One, detached: 1,140
- One, attached: 34
- Two: 86
- 3 or 4: 62
- 5 to 9: 119
- Mobile homes: 75
Housing units lacking complete kitchen facilities in 2022: 6.3%
House/condo owner moved in on average 32 years ago
Renter moved in on average 4 years ago

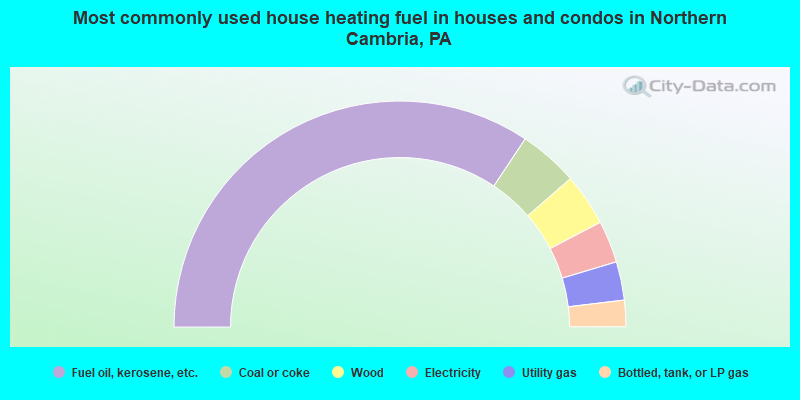
- 68.7%Fuel oil, kerosene, etc.
- 8.5%Coal or coke
- 7.5%Wood
- 6.0%Electricity
- 5.5%Utility gas
- 3.8%Bottled, tank, or LP gas
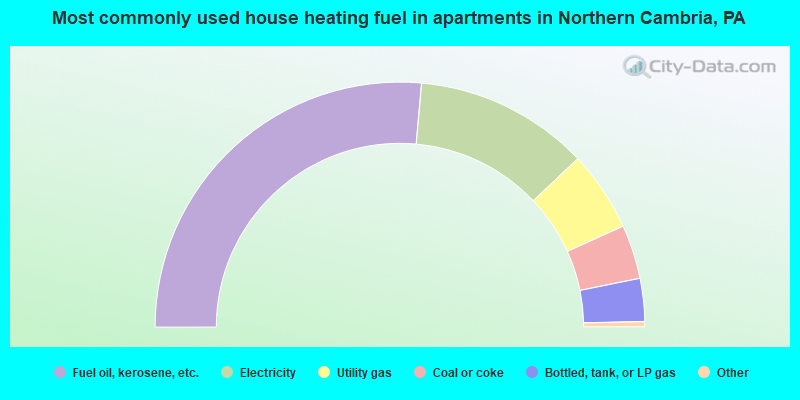
- 53.2%Fuel oil, kerosene, etc.
- 23.2%Electricity
- 10.7%Utility gas
- 7.2%Coal or coke
- 5.7%Bottled, tank, or LP gas
Private vs. public school enrollment:
| Here: | 7.8% |
| Pennsylvania: | 15.7% |
| Here: | 6.2% |
| Pennsylvania: | 13.4% |
| Here: | 66.5% |
| Pennsylvania: | 39.8% |


