Northglenn, CO (Colorado) Houses and Residents
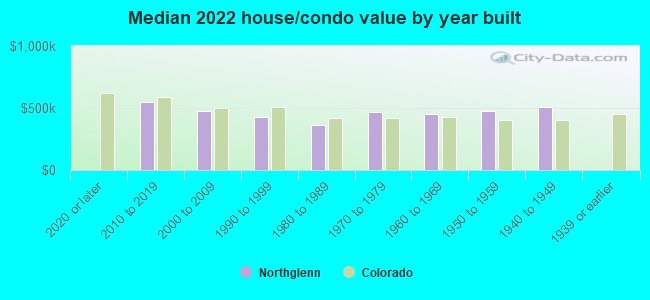
| Northglenn: | $454,435 |
| Colorado: | $531,100 |
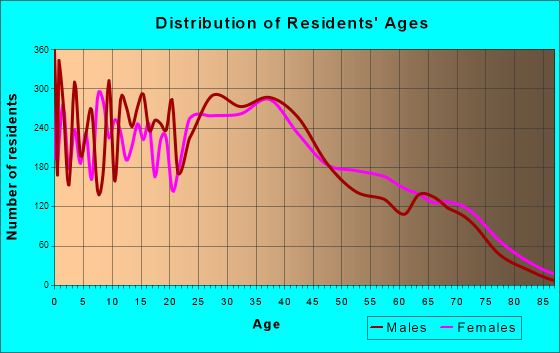
Total population: 38,596 (Urban population: 31,617, Rural population: 18 (all nonfarm))
Houses: 15,331 (14,905 occupied: 8,826 owner occupied, 6,153 renter occupied)
| % of renters here: | 41% |
| State: | 34% |
Housing density: 2,067 houses/condos per square mile
Median price asked for vacant for-sale houses and condos in 2022: $863,701.
Median contract rent in 2022: $1,542 (lower quartile is $1,278, upper quartile is $1,900)
Median rent asked for vacant for-rent units in 2022: $895
Median gross rent in Northglenn, CO in 2022: $1,685
Housing units in Northglenn with a mortgage: 6,417 (549 second mortgage, 0 home equity loan, 541 both second mortgage and home equity loan)
Houses without a mortgage: 79
Median household income for houses/condos with a mortgage: $104,769
Median household income for apartments without a mortgage: $84,433
Median monthly housing costs: $1,652
Compare current foreclosures near Northglenn, CO:
| Photo | Address | Area | Beds / Baths | Price | Details |
|---|---|---|---|---|---|

|
#1
Curtis St
Denver, CO 80205
|
822 sq. feet
|
3 baths 4 beds |
$499,900
|
show details |

|
#2
Pawnee Dr
Boulder, CO 80303
|
1,416 sq. feet
|
2 baths 3 beds |
$824,900
|
show details |

|
#3
E Exposition Ave Apartme
Aurora, CO 80012
|
444 sq. feet
|
1 baths 1 beds |
show details | |

|
#4
S Memphis Way Apt K
Aurora, CO 80017
|
706 sq. feet
|
1 baths 1 beds |
show details | |

|
#5
E 121st Ct
Denver, CO 80241
|
1,288 sq. feet
|
2 baths 3 beds |
show details | |

|
#6
Robins Dr
Denver, CO 80249
|
1,985 sq. feet
|
2 baths 3 beds |
show details | |

|
#7
Quintero St
Commerce City, CO 80022
|
2,633 sq. feet
|
2 baths 3 beds |
show details | |

|
#8
York St Apt 2
Denver, CO 80229
|
1,088 sq. feet
|
1 baths 3 beds |
show details | |

|
#9
King Ct
Westminster, CO 80031
|
1,542 sq. feet
|
4 baths 3 beds |
show details | |

|
#10
Upham St
Arvada, CO 80003
|
1,107 sq. feet
|
1 baths 3 beds |
show details |
| Photo | Address | Area | Beds / Baths | Price | Details |
|---|---|---|---|---|---|

|
#11
Leroux Street
Fort Lupton, CO 80621
|
1,911 sq. feet
|
2 baths 4 beds |
show details | |

|
#12
Ash Ct
Denver, CO 80229
|
1,484 sq. feet
|
2 baths 4 beds |
show details | |

|
#13
Sedalia St
Commerce City, CO 80022
|
2,138 sq. feet
|
2 baths 3 beds |
show details | |

|
#14
Malta St
Denver, CO 80249
|
1,646 sq. feet
|
2 baths 3 beds |
show details | |

|
#15
Zenobia Pl
Westminster, CO 80030
|
1,472 sq. feet
|
1 baths 4 beds |
show details | |

|
#16
Jericho St
Denver, CO 80249
|
1,691 sq. feet
|
3 baths 3 beds |
show details | |

|
#17
S Miller Way
Denver, CO 80226
|
1,269 sq. feet
|
2 baths 4 beds |
show details | |

|
#18
16th St Apt 504
Denver, CO 80202
|
708 sq. feet
|
1 baths 1 beds |
show details | |

|
#19
E 106th Ave
Commerce City, CO 80022
|
2,786 sq. feet
|
3 baths 7 beds |
show details | |

|
#20
W 29th Ave
Denver, CO 80215
|
1,388 sq. feet
|
3 baths 5 beds |
show details |
| Photo | Address | Area | Beds / Baths | Price | Details |
|---|---|---|---|---|---|

|
#21
Everett St
Arvada, CO 80005
|
1,484 sq. feet
|
2 baths 3 beds |
show details | |

|
#22
S Saint Paul St
Denver, CO 80210
|
1,334 sq. feet
|
5 baths 5 beds |
show details | |

|
#23
E 50th Drive
Aurora, CO 80019
|
1,881 sq. feet
|
2 baths 2 beds |
show details | |

|
#24
E 39th Ave
Denver, CO 80249
|
1,625 sq. feet
|
3 baths 3 beds |
show details | |

|
#25
E 18th Pl
Aurora, CO 80011
|
986 sq. feet
|
1 baths 4 beds |
show details | |

|
#26
Jamaica St
Henderson, CO 80640
|
1,533 sq. feet
|
3 baths 3 beds |
show details | |

|
#27
Halifax Ct
Denver, CO 80249
|
2,329 sq. feet
|
3 baths 3 beds |
show details | |

|
#28
W Adriatic Pl
Englewood, CO 80110
|
1,104 sq. feet
|
1 baths 3 beds |
show details | |

|
#29
E 111th Ct
Denver, CO 80233
|
1,307 sq. feet
|
2 baths 4 beds |
show details | |

|
#30
Drake St
Denver, CO 80221
|
950 sq. feet
|
1 baths 2 beds |
show details |
| Photo | Address | Area | Beds / Baths | Price | Details |
|---|---|---|---|---|---|

|
#31
Brentwood Way Unit 203
Broomfield, CO 80021
|
553 sq. feet
|
1 baths 1 beds |
show details | |

|
#32
Quaker St
Golden, CO 80401
|
660 sq. feet
|
1 baths 1 beds |
show details | |

|
#33
W 14th Ave Apt 1
Denver, CO 80214
|
869 sq. feet
|
1 baths 2 beds |
show details | |

|
#34
E 75th Pl
Commerce City, CO 80022
|
1,624 sq. feet
|
1 baths 3 beds |
show details | |

|
#35
Mather St
Brighton, CO 80601
|
910 sq. feet
|
1 baths 2 beds |
show details | |

|
#36
Nome St
Aurora, CO 80010
|
736 sq. feet
|
1 baths 2 beds |
show details | |

|
#37
W Alaska Pl
Denver, CO 80219
|
1,646 sq. feet
|
2 baths 2 beds |
show details | |

|
#38
W 75th Way
Arvada, CO 80005
|
1,452 sq. feet
|
1 baths 3 beds |
show details | |

|
#39
Garland St
Denver, CO 80215
|
1,595 sq. feet
|
2 baths 3 beds |
show details | |

|
#40
E 115th Pl
Denver, CO 80233
|
2,032 sq. feet
|
2 baths 4 beds |
show details |
| Photo | Address | Area | Beds / Baths | Price | Details |
|---|---|---|---|---|---|

|
#41
E 115th Pl
Denver, CO 80233
|
2,032 sq. feet
|
2 baths 4 beds |
show details | |

|
#42
S 3rd Ave
Brighton, CO 80601
|
1,306 sq. feet
|
2 baths 3 beds |
show details | |

|
#43
W 65th Pl
Denver, CO 80221
|
1,491 sq. feet
|
2 baths 3 beds |
show details | |

|
#44
S Gray Dr
Denver, CO 80227
|
2,224 sq. feet
|
2 baths 3 beds |
show details | |

|
#45
Florence St
Aurora, CO 80010
|
725 sq. feet
|
1 baths 2 beds |
show details | |

|
#46
Xavier St
Broomfield, CO 80020
|
1,499 sq. feet
|
3 baths 3 beds |
show details | |

|
#47
Emerson St
Denver, CO 80229
|
890 sq. feet
|
1 baths 2 beds |
show details | |

|
#48
Valdai St
Brighton, CO 80603
|
1,316 sq. feet
|
2 baths 4 beds |
show details | |

|
#49
W 11th Ave Apt 1102
Denver, CO 80204
|
873 sq. feet
|
2 baths 2 beds |
show details | |

|
Check over 1 million property listings on Foreclosure.com!
|
browse all offers | |||

Latest news about housing in Northglenn, CO collected exclusively by city-data.com from local newspapers, TV, and radio stations

 | Original Homes in Thornton and Northglenn (4 replies) |
| Denver Real Estate Discussion / Opinion Thread (NO Data Charts) (1076 replies) |
| Apartments Without Carpet (Boulder/Broomfield/Surrounding) (6 replies) |
| Buy a House in Greeley or Condo in Westminster (16 replies) |
| Denver in the 1960s and 1970s (Memory Lane) (1765 replies) |
| Wait list for apartment rental (7 replies) |
Median year apartment built: 1983
Household type by relationship:
Households: 38,489- Male householders: 6,702 (1,756 living alone), Female householders: 7,739 (1,821 living alone)
6,371 spouses (6,214 opposite-sex spouses), 1,559 unmarried partners, (1,421 opposite-sex unmarried partners), 11,569 children (10,679 natural, 157 adopted, 733 stepchildren), 1,187 grandchildren, 518 brothers or sisters, 501 parents, 0 foster children, 749 other relatives, 1,414 non-relatives
- In group quarters: 174
Size of family households: 3,458 2-persons, 2,645 3-persons, 2,149 4-persons, 958 5-persons, 437 6-persons, 73 7-or-more-persons.
Size of nonfamily households: 3,711 1-person, 1,201 2-persons, 194 3-persons, 62 4-persons, 74 5-persons.
4,577 married couples with children.
2,651 single-parent households (851 men, 1,800 women).
81.9% of residents of Northglenn speak English at home.
13.2% of residents speak Spanish at home (64% speak English very well, 18% speak English well, 12% speak English not well, 6% don't speak English at all).
2.6% of residents speak other Indo-European language at home (33% speak English very well, 28% speak English well, 37% speak English not well, 2% don't speak English at all).
1.9% of residents speak Asian or Pacific Island language at home (30% speak English very well, 46% speak English well, 23% speak English not well, 1% don't speak English at all).
0.5% of residents speak other language at home (88% speak English very well, 12% speak English not well).
Foreign born population: 4,005 (10.4%)
(45.5% of them are naturalized citizens)
| Here: | 7.4 |
| State: | 6.8 |
| Here: | 4.0 |
| State: | 4.0 |
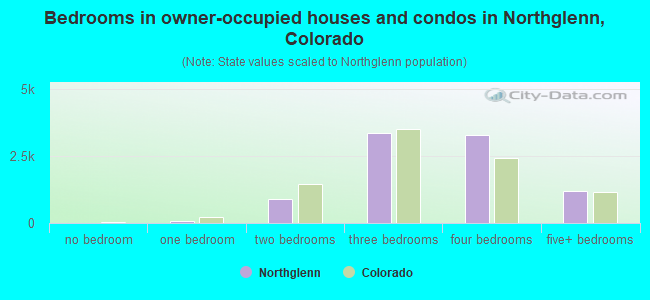
- Bedrooms in owner-occupied houses and condos in Northglenn, Colorado
- 0no bedroom
- 651 bedroom
- 9092 bedrooms
- 3,3693 bedrooms
- 3,3024 bedrooms
- 1,1815+ bedrooms
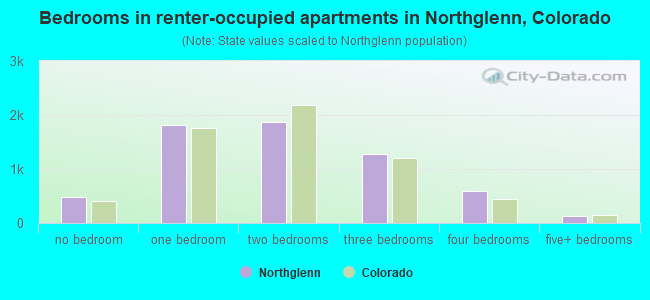
- Bedrooms in renter-occupied apartments in Northglenn, Colorado
- 487no bedroom
- 1,8131 bedroom
- 1,8632 bedrooms
- 1,2723 bedrooms
- 5944 bedrooms
- 1245+ bedrooms
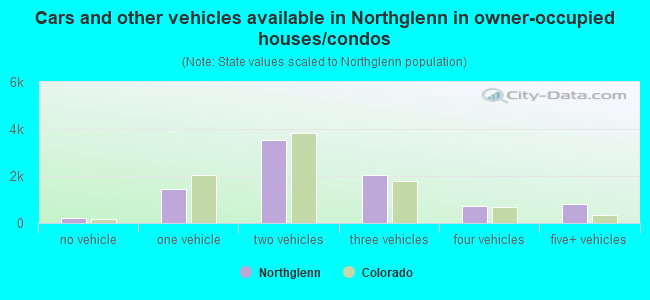
- Cars and other vehicles available in Northglenn in owner-occupied houses/condos
- 216no vehicle
- 1,4531 vehicle
- 3,5392 vehicles
- 2,0563 vehicles
- 7354 vehicles
- 8285+ vehicles
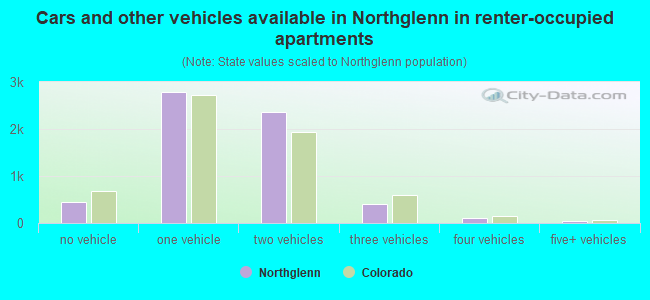
- Cars and other vehicles available in Northglenn in renter-occupied apartments
- 457no vehicle
- 2,7831 vehicle
- 2,3552 vehicles
- 4043 vehicles
- 1144 vehicles
- 425+ vehicles
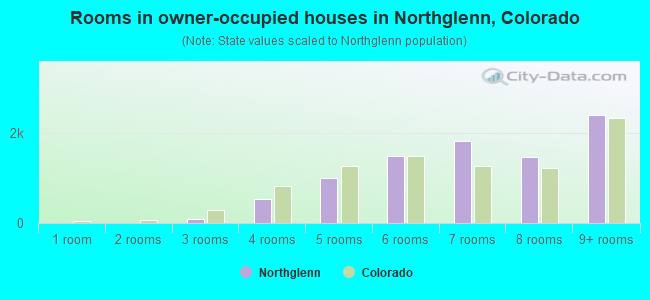
- Rooms in owner-occupied houses in Northglenn, Colorado
- 01 room
- 02 rooms
- 853 rooms
- 5284 rooms
- 1,0105 rooms
- 1,4996 rooms
- 1,8277 rooms
- 1,4688 rooms
- 2,4099+ rooms
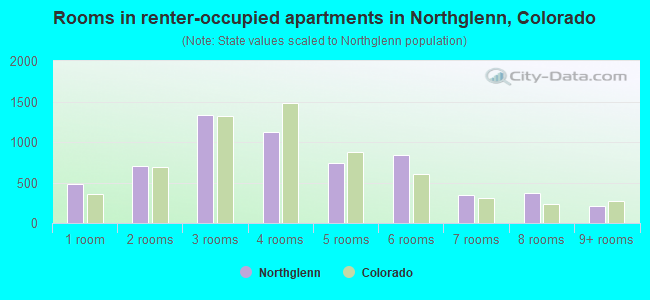
- Rooms in renter-occupied apartments in Northglenn, Colorado
- 4871 room
- 7012 rooms
- 1,3353 rooms
- 1,1274 rooms
- 7425 rooms
- 8406 rooms
- 3457 rooms
- 3738 rooms
- 2049+ rooms
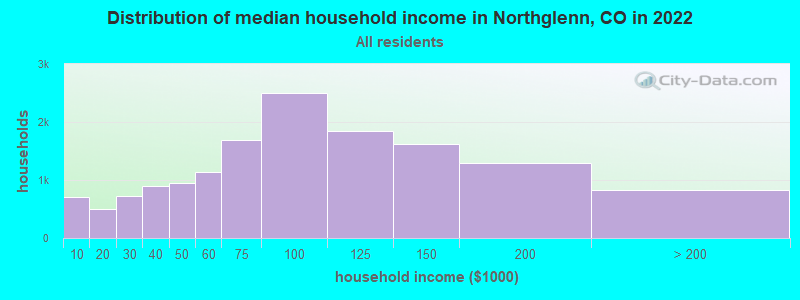
Northglenn, CO household income distribution

- 712Less than $10,000
- 496$10,000 to $19,999
- 725$20,000 to $29,999
- 893$30,000 to $39,999
- 956$40,000 to $49,999
- 1,140$50,000 to $59,999
- 1,697$60,000 to $74,999
- 2,494$75,000 to $99,999
- 1,847$100,000 to $124,999
- 1,629$125,000 to $149,999
- 1,293$150,000 to $199,999
- 824$200,000 or more
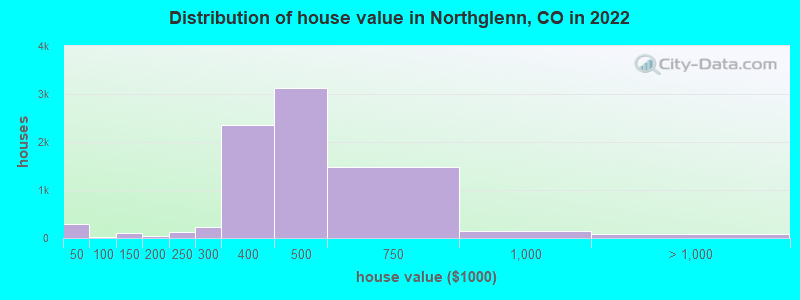
Home value of owner - occupied houses in 2022 in Northglenn, CO
-
- 209Less than $10,000
- 61$30,000 to $34,999
- 24$40,000 to $49,999
- 5$60,000 to $69,999
- 78$100,000 to $124,999
- 17$125,000 to $149,999
- 18$150,000 to $174,999
- 21$175,000 to $199,999
- 126$200,000 to $249,999
- 221$250,000 to $299,999
- 2,348$300,000 to $399,999
- 3,120$400,000 to $499,999
- 1,484$500,000 to $749,999
- 154$750,000 to $999,999
- 29$1,000,000 to $1,499,999
- 23$1,500,000 to $1,999,999
- 33$2,000,000 or more
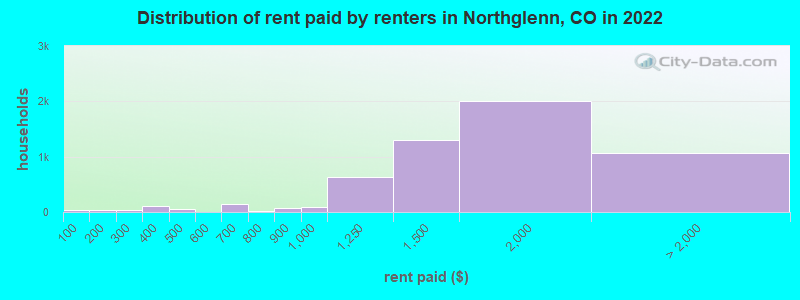
Rent paid by renters in 2022 in Northglenn, CO
-
- 28Less than $100
- 34$150 to $199
- 27$200 to $249
- 100$350 to $399
- 16$400 to $449
- 34$450 to $499
- 9$500 to $549
- 138$600 to $649
- 9$700 to $749
- 73$800 to $899
- 93$900 to $999
- 633$1,000 to $1,249
- 1,298$1,250 to $1,499
- 2,000$1,500 to $1,999
- 867$2,000 to $2,499
- 69$2,500 to $2,999
- 19$3,000 to $3,499
- 112No cash rent
Percentage of workers working in this county: 52.7%
Number of people working at home: 2,604 (12.4% of all workers)
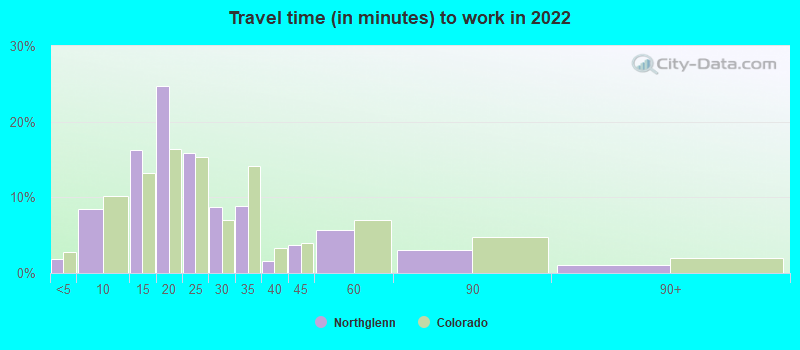
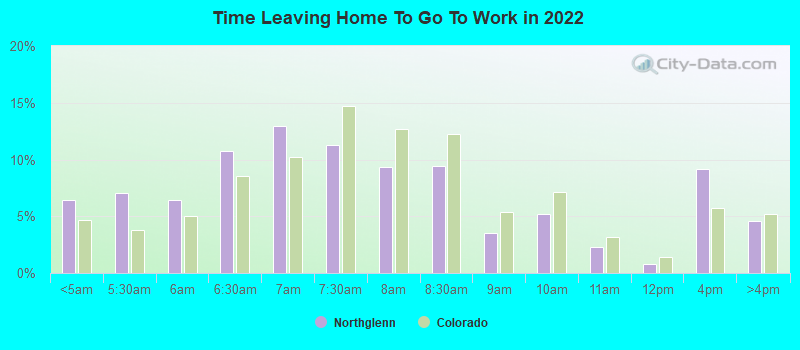
Travel time to work (commute)
- Less than 5 minutes: 233
- 5 to 9 minutes: 1,033
- 10 to 14 minutes: 1,444
- 15 to 19 minutes: 2,893
- 20 to 24 minutes: 2,391
- 25 to 29 minutes: 1,837
- 30 to 34 minutes: 4,304
- 35 to 39 minutes: 627
- 40 to 44 minutes: 793
- 45 to 59 minutes: 1,628
- 60 to 89 minutes: 744
- 90 or more minutes: 224
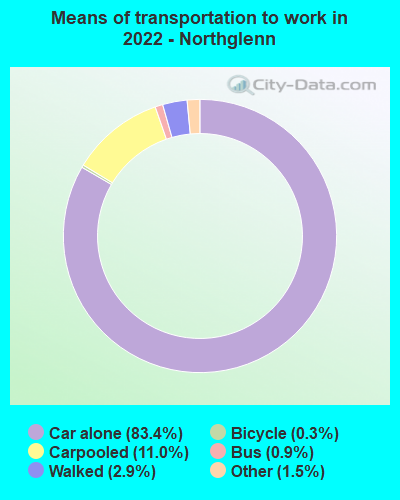
Means of transportation to work:
- Drove a car alone: 7,172 (64.8%)
- Carpooled: 1,001 (9.0%)
- Bus: 49 (0.4%)
- Taxi: 126 (1.1%)
- Bicycle: 23 (0.2%)
- Walked: 214 (1.9%)
- Worked at home: 2,604 (23.5%)
- Unemployment by race in 2022
- Unemployment rate for White non-Hispanic residents
- 2.4%Males
- 2.2%Females
- Unemployment rate for Black residents
- 1.6%Females
- Unemployment rate for American Indian and Alaska Native residents
- 5.0%Females
- Unemployment rate for Asian residents
- 7.6%Females
- Unemployment rate for other race residents
- 17.7%Males
- 8.9%Females
- Unemployment rate for two or more race residents
- 0.6%Males
- 2.4%Females
- Unemployment rate for Hispanic or Latino residents
- 5.8%Males
- 4.3%Females
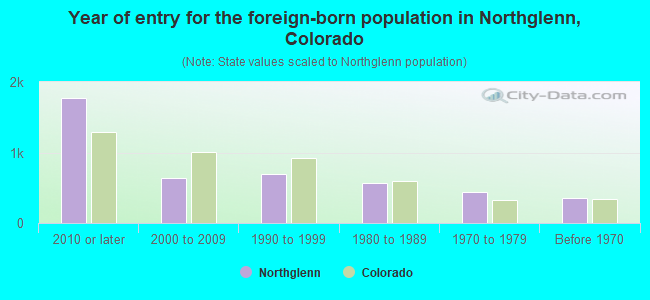
- Year of entry for the foreign-born population in Northglenn, Colorado
- 1,7762010 or later
- 6392000 to 2009
- 7011990 to 1999
- 5711980 to 1989
- 4411970 to 1979
- 350Before 1970

First ancestries reported:
- German: 1,553 (10.5%)
- American: 1,051 (7.1%)
- English: 826 (5.6%)
- Irish: 693 (4.7%)
- Italian: 292 (2.0%)
- European: 280 (1.9%)
- Russian: 222 (1.5%)
- Scottish: 183 (1.2%)
- Norwegian: 174 (1.2%)
- British: 162 (1.1%)
- Ukrainian: 161 (1.1%)
- Scandinavian: 111 (0.8%)
- Polish: 104 (0.7%)
- Swedish: 102 (0.7%)
- Iranian: 90 (0.6%)
- Bulgarian: 82 (0.6%)
- U.S. Virgin Islander: 75 (0.5%)
- French: 75 (0.5%)
- Czechoslovakian: 68 (0.5%)
- Scotch-Irish: 61 (0.4%)
- Egyptian: 52 (0.4%)
- Afghan: 51 (0.3%)
- Welsh: 48 (0.3%)
- Danish: 33 (0.2%)
- Dutch: 30 (0.2%)
- Eastern European: 27 (0.2%)
- Lebanese: 27 (0.2%)
- Moroccan: 22 (0.1%)
- Swiss: 21 (0.1%)
- French Canadian: 19 (0.1%)
- Jordanian: 15 (0.1%)
- Finnish: 14 (0.09%)
- British West Indian: 13 (0.09%)
- Pennsylvania German: 9 (0.06%)
- South African: 9 (0.06%)
- Barbadian: 9 (0.06%)
- Greek: 8 (0.05%)
- Hungarian: 7 (0.05%)
Most common places of birth for foreign-born residents (%):
| Northglenn: | 37.5% (1,509) |
| Colorado: | 38.3% (209,491) |
| Northglenn: | 10.0% (402) |
| Colorado: | 1.1% (5,971) |
| Northglenn: | 6.9% (279) |
| Colorado: | 3.0% (16,616) |
| Northglenn: | 4.0% (160) |
| Colorado: | 1.4% (7,860) |
| Northglenn: | 3.8% (153) |
| Colorado: | 0.8% (4,267) |
| Northglenn: | 3.1% (123) |
| Colorado: | 0.2% (1,073) |
| Northglenn: | 2.9% (116) |
| Colorado: | 0.3% (1,730) |
| Northglenn: | 2.9% (116) |
| Colorado: | 0.7% (3,568) |
| Northglenn: | 2.4% (97) |
| Colorado: | 0.9% (4,810) |
| Northglenn: | 2.1% (83) |
| Colorado: | 0.5% (2,507) |
| Northglenn: | 1.8% (73) |
| Colorado: | 3.3% (17,998) |
| Northglenn: | 1.7% (67) |
| Colorado: | 2.2% (12,150) |
| Northglenn: | 1.6% (64) |
| Colorado: | 2.5% (13,706) |
Place of birth for U.S.-born residents:
- This state: 20,114
- Other state: 13,819
- Northeast: 1,369
- Midwest: 4,933
- South: 2,771
- West: 4,702
87.2% of Northglenn residents lived in the same house 1 years ago.
Out of people who lived in different houses, 32.3% lived in this county.
Out of people who lived in different counties, 78.5% lived in Colorado.
| Northglenn: | 87.2% |
| State average: | 83.6% |
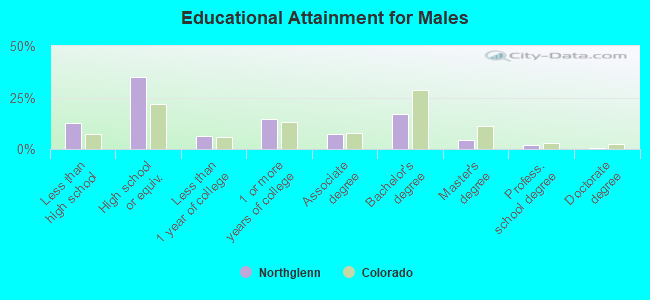
Education attainment for males 25 years and older:
- No schooling: 462
- Nursery to 4th grade: 0
- 5th and 6th grade: 11
- 7th and 8th grade: 138
- 9th grade: 122
- 10th grade: 183
- 11th grade: 300
- 12th grade, no diploma: 487
- High school graduate (or equivalency): 4,648
- Less than 1 year of college: 845
- Some college more than 1 year, no degree: 1,970
- Associate degree: 972
- Bachelor's degree: 2,232
- Master's degree: 587
- Professional school degree: 275
- Doctorate degree: 79
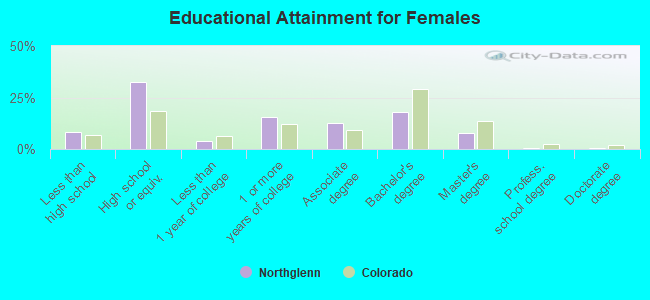
Education attainment for females 25 years and older:
- No schooling: 455
- Nursery to 4th grade: 0
- 5th and 6th grade: 91
- 7th and 8th grade: 46
- 9th grade: 53
- 10th grade: 92
- 11th grade: 183
- 12th grade, no diploma: 168
- High school graduate (or equivalency): 4,241
- Less than 1 year of college: 531
- Some college more than 1 year, no degree: 2,004
- Associate degree: 1,669
- Bachelor's degree: 2,331
- Master's degree: 1,008
- Professional school degree: 82
- Doctorate degree: 75
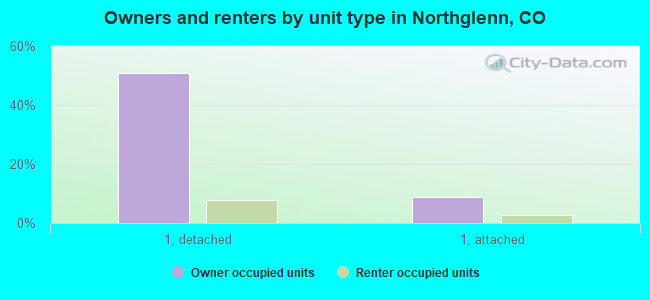
Housing units in structures:
- One, detached: 9,049
- One, attached: 1,511
- Two: 17
- 3 or 4: 511
- 5 to 9: 743
- 10 to 19: 1,511
- 20 to 49: 1,388
- 50 or more: 524
- Mobile homes: 73
Housing units lacking complete kitchen facilities in 2022: 1.9%
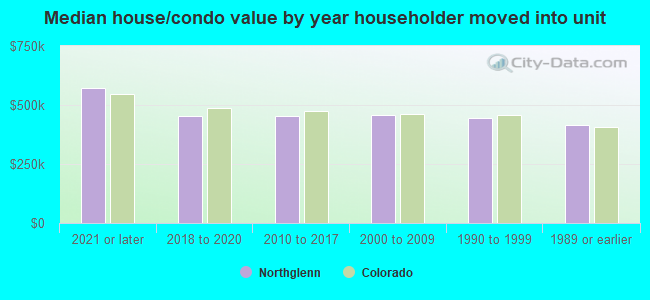
House/condo owner moved in on average 11 years ago
Renter moved in on average 3 years ago
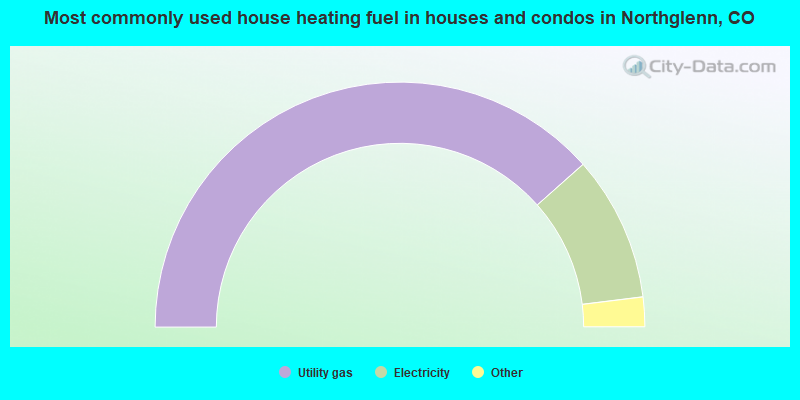
- 76.9%Utility gas
- 19.2%Electricity
- 2.8%No fuel used
- 0.6%Solar energy
- 0.3%Wood
- 0.1%Bottled, tank, or LP gas
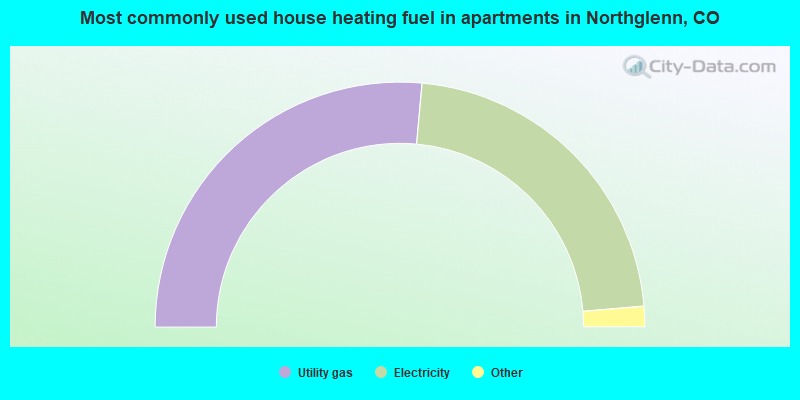
- 52.9%Utility gas
- 44.4%Electricity
- 0.8%Bottled, tank, or LP gas
- 0.8%No fuel used
- 0.6%Other fuel
- 0.5%Wood
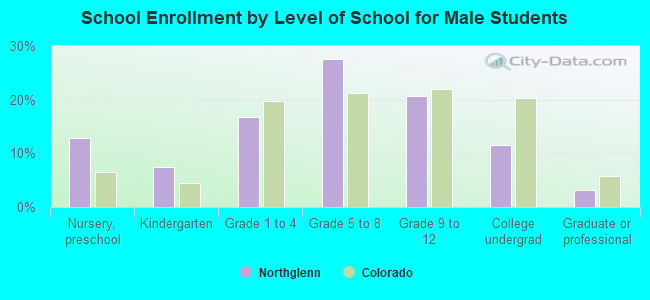
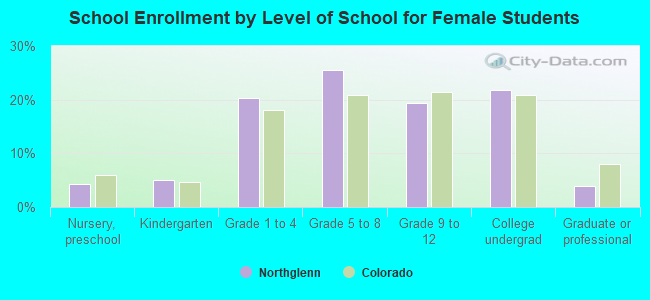
Private vs. public school enrollment:
| Here: | 8.4% |
| Colorado: | 11.4% |
| Here: | 7.7% |
| Colorado: | 8.5% |
| Here: | 15.1% |
| Colorado: | 14.0% |