Housing density: 3,301 houses/condos per square mile
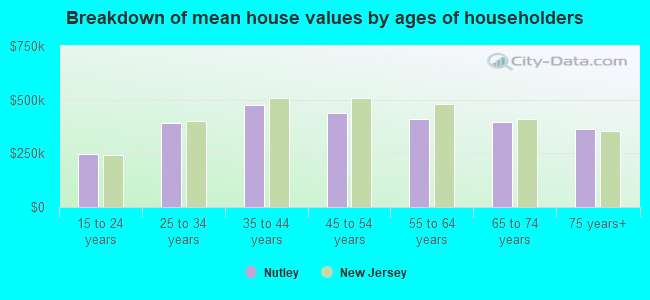
Median price asked for vacant for-sale houses and condos in 2022 in this county: $231,294.
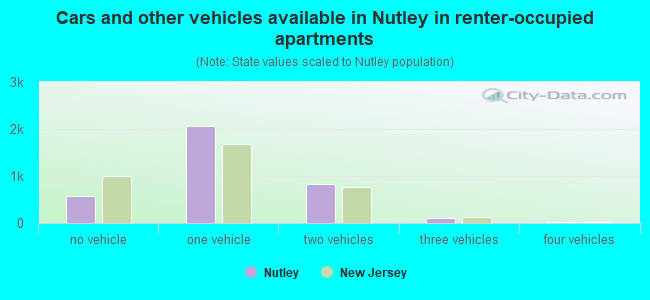
Median contract rent in 2022: $1,511 (lower quartile is $1,339, upper quartile is $1,966)
Median rent asked for vacant for-rent units in 2022: $1,573
Median gross rent in Nutley, NJ in 2022: $1,659
Housing units in Nutley with a mortgage: 4,099 (362 second mortgage, 716 home equity loan, 55 both second mortgage and home equity loan) Houses without a mortgage: 2,097
In family households: 645,040 (104,343 male householders, 84,996 female householders)
113,673 spouses, 245,726 children (232,723 natural, 5,793 adopted, 7,210 stepchildren), 20,627 grandchildren, 15,422 brothers or sisters, 11,923 parents, foster children, 19,910 other relatives, 22,762 non-relatives
In nonfamily households: 115,157 (42,135 male householders (33,262 living alone)), 52,238 female householders (45,266 living alone)), 20,784 nonrelatives
In group quarters: 23,772 (12,126 institutionalized population)
108,634 married couples with children.
65,899 single-parent households (10,059 men, 55,840 women).
79.2% of residents of Nutley speak English at home.
6.0% of residents speak Spanish at home (66% speak English very well, 20% speak English well, 9% speak English not well, 5% don't speak English at all).
10.1% of residents speak other Indo-European language at home (69% speak English very well, 19% speak English well, 10% speak English not well, 2% don't speak English at all).
4.2% of residents speak Asian or Pacific Island language at home (56% speak English very well, 29% speak English well, 14% speak English not well, 1% don't speak English at all).
0.6% of residents speak other language at home (61% speak English very well, 23% speak English well, 17% speak English not well).
Foreign born population: 5,941 (20.3%)
(74.5% of them are naturalized citizens)
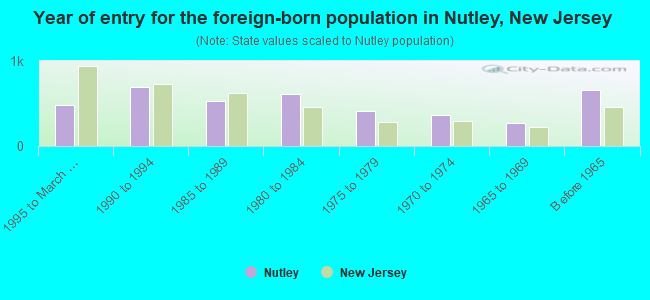
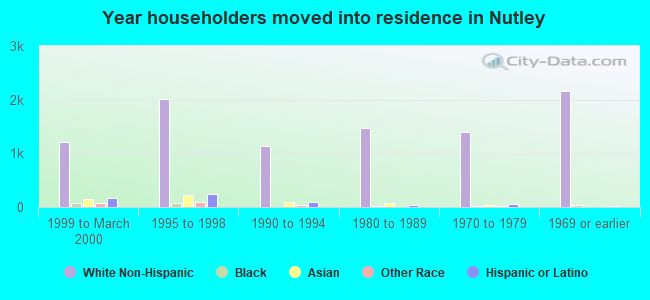
Year of entry for the foreign-born population in Nutley, New Jersey
4881995 to March 2000
6901990 to 1994
5261985 to 1989
6131980 to 1984
4101975 to 1979
3621970 to 1974
2691965 to 1969
654Before 1965
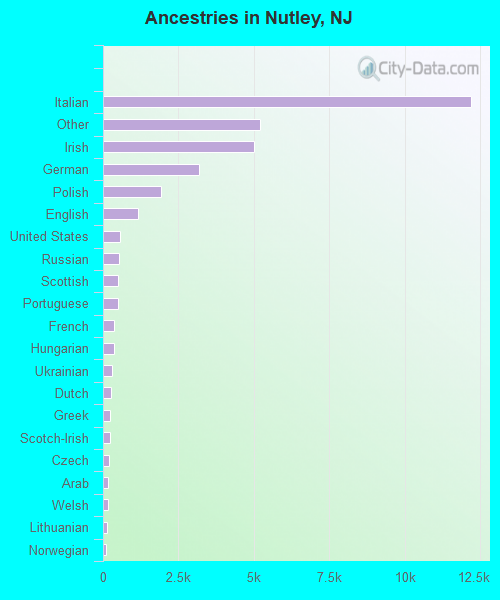
First ancestries reported:
Italian: 12,183 (36.0%)
Other: 5,219 (15.4%)
Irish: 4,999 (14.8%)
German: 3,166 (9.4%)
Polish: 1,912 (5.7%)
English: 1,152 (3.4%)
United States: 563 (1.7%)
Russian: 531 (1.6%)
Scottish: 498 (1.5%)
Portuguese: 493 (1.5%)
French: 364 (1.1%)
Hungarian: 358 (1.1%)
Ukrainian: 292 (0.9%)
Dutch: 261 (0.8%)
Greek: 247 (0.7%)
Scotch-Irish: 227 (0.7%)
Czech: 201 (0.6%)
Arab: 175 (0.5%)
Welsh: 151 (0.4%)
Lithuanian: 140 (0.4%)
Norwegian: 112 (0.3%)
West Indian: 109 (0.3%)
Swedish: 102 (0.3%)
French Canadian: 96 (0.3%)
Slovak: 95 (0.3%)
Swiss: 88 (0.3%)
Danish: 51 (0.2%)
Subsaharan African: 37 (0.1%)
Most common places of birth for foreign-born residents (%):
India
Nutley:
12.8% (514)
New Jersey:
8.1% (119,497)
Italy
Nutley:
11.8% (474)
New Jersey:
4.0% (58,395)
Philippines
Nutley:
9.3% (372)
New Jersey:
4.7% (69,773)
Korea
Nutley:
4.9% (197)
New Jersey:
3.5% (51,970)
Peru
Nutley:
4.7% (188)
New Jersey:
3.1% (45,151)
China, excluding Hong Kong and Taiwan
Nutley:
3.4% (135)
New Jersey:
2.7% (40,092)
Ecuador
Nutley:
3.3% (134)
New Jersey:
3.6% (53,482)
Colombia
Nutley:
3.3% (132)
New Jersey:
4.7% (69,754)
Egypt
Nutley:
2.5% (102)
New Jersey:
1.4% (20,079)
Dominican Republic
Nutley:
2.5% (99)
New Jersey:
6.2% (91,316)
Poland
Nutley:
2.4% (97)
New Jersey:
3.8% (55,466)
Ukraine
Nutley:
2.3% (91)
New Jersey:
1.0% (14,768)
Portugal
Nutley:
2.2% (89)
New Jersey:
2.5% (37,183)
United Kingdom
Nutley:
2.0% (82)
New Jersey:
2.1% (30,355)
Place of birth for U.S.-born residents:
This state: 18,948
Other state: 4,130
Northeast: 3,126
Midwest: 313
South: 533
West: 158
66% of Nutley residents lived in the same house 5 years ago. Out of people who lived in different houses, 57% lived in this county. Out of people who lived in different counties, 68% lived in New Jersey.
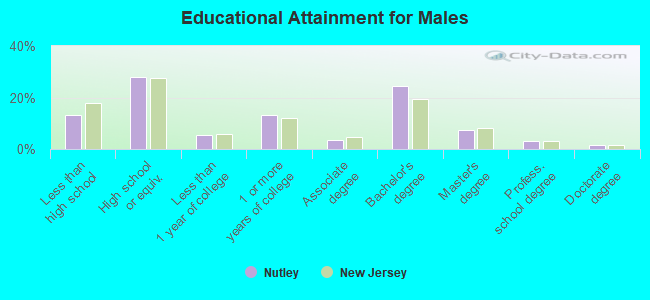
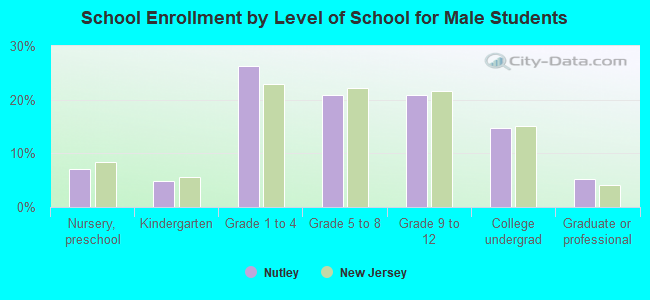
Education attainment for males 25 years and older:
No schooling: 25
Nursery to 4th grade: 21
5th and 6th grade: 76
7th and 8th grade: 171
9th grade: 160
10th grade: 210
11th grade: 168
12th grade, no diploma: 351
High school graduate (or equivalency): 2,504
Less than 1 year of college: 493
Some college more than 1 year, no degree: 1,192
Associate degree: 325
Bachelor's degree: 2,176
Master's degree: 642
Professional school degree: 267
Doctorate degree: 133
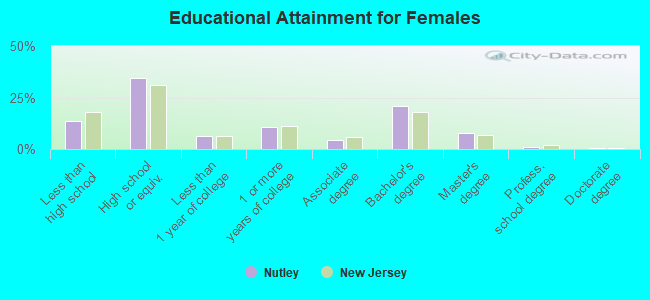
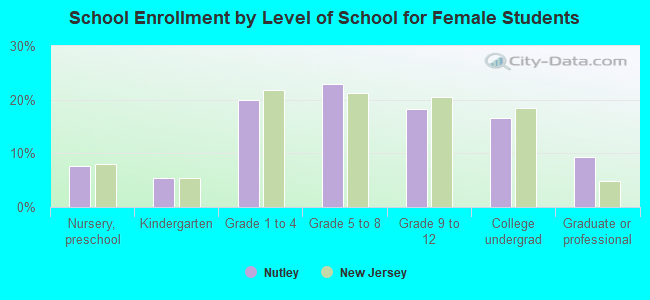
Education attainment for females 25 years and older:
No schooling: 57
Nursery to 4th grade: 30
5th and 6th grade: 121
7th and 8th grade: 366
9th grade: 161
10th grade: 237
11th grade: 189
12th grade, no diploma: 310
High school graduate (or equivalency): 3,690
Less than 1 year of college: 681
Some college more than 1 year, no degree: 1,175
Associate degree: 494
Bachelor's degree: 2,244
Master's degree: 853
Professional school degree: 110
Doctorate degree: 57
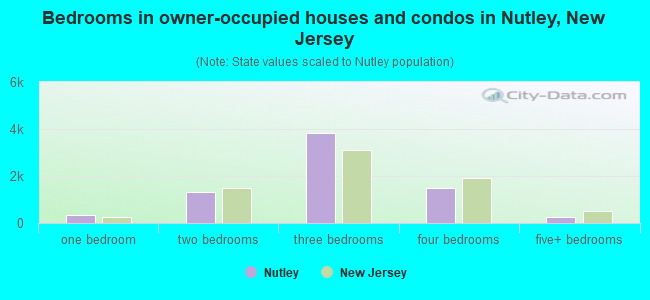
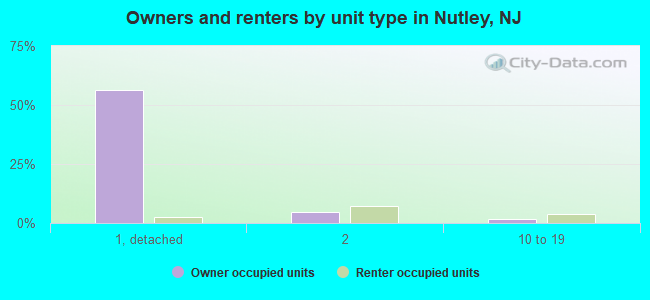
Housing units in structures:
One, detached: 6,437
One, attached: 244
Two: 1,410
3 or 4: 606
5 to 9: 609
10 to 19: 629
20 to 49: 550
50 or more: 633
Housing units lacking complete plumbing facilities: 0.3%
Housing units lacking complete kitchen facilities: 0.2%