Oak Forest, IL (Illinois) Houses and Residents
| Oak Forest: | $238,493 |
| Illinois: | $251,600 |
Total population: 28,174 (Urban population: 27,955, Rural population: 0)
Houses: 10,537 (10,208 occupied: 8,296 owner occupied, 2,085 renter occupied)
| % of renters here: | 20% |
| State: | 33% |
Housing density: 1,865 houses/condos per square mile
Median price asked for vacant for-sale houses and condos in 2022: $159,306.
Median contract rent in 2022: $1,132 (lower quartile is $898, upper quartile is $1,388)
Median rent asked for vacant for-rent units in 2022: $923
Median gross rent in Oak Forest, IL in 2022: $1,256
Housing units in Oak Forest with a mortgage: 5,560 (444 second mortgage, 0 home equity loan, 358 both second mortgage and home equity loan)
Houses without a mortgage: 113
Median household income for houses/condos with a mortgage: $101,772
Median household income for apartments without a mortgage: $81,958
Median monthly housing costs: $1,435
Compare current foreclosures in Oak Forest, IL:
| Photo | Address | Area | Beds / Baths | Price | Details |
|---|---|---|---|---|---|

|
#1
Boca Rio Dr
Oak Forest, IL 60452
|
1,248 sq. feet
|
2 baths 3 beds |
show details | |

|
#2
Kilpatrick Ave
Oak Forest, IL 60452
|
1,434 sq. feet
|
2 baths 4 beds |
show details | |

|
#3
Grange Ave
Oak Forest, IL 60452
|
1,258 sq. feet
|
1 baths 3 beds |
show details | |

|
#4
Menard Ave
Oak Forest, IL 60452
|
1,231 sq. feet
|
1 baths 3 beds |
show details | |

|
#5
Scott St
Oak Forest, IL 60452
|
1,346 sq. feet
|
2 baths 3 beds |
show details | |

|
#6
Newport Dr
Oak Forest, IL 60452
|
1,196 sq. feet
|
1 baths 3 beds |
show details | |

|
#7
Bonnie Trl
Oak Forest, IL 60452
|
2,146 sq. feet
|
3 baths 4 beds |
show details | |

|
#8
Greentree Rd
Oak Forest, IL 60452
|
991 sq. feet
|
2 baths 5 beds |
show details | |

|
#9
Jones Ct
Oak Forest, IL 60452
|
1,353 sq. feet
|
2 baths 3 beds |
show details | |

|
#10
El Morro Ln
Oak Forest, IL 60452
|
1,335 sq. feet
|
2 baths - beds |
show details |
| Photo | Address | Area | Beds / Baths | Price | Details |
|---|---|---|---|---|---|

|
#11
Linden Dr
Oak Forest, IL 60452
|
1,591 sq. feet
|
2 baths - beds |
show details | |

|
#12
Arrowhead Trce
Oak Forest, IL 60452
|
1,813 sq. feet
|
2 baths - beds |
show details | |

|
#13
157th St
Oak Forest, IL 60452
|
1,293 sq. feet
|
1 baths - beds |
show details | |

|
#14
Terry Ln
Oak Forest, IL 60452
|
1,285 sq. feet
|
2 baths - beds |
show details | |

|
#15
Bonnie Trl E
Oak Forest, IL 60452
|
2,122 sq. feet
|
2 baths - beds |
show details | |

|
#16
Natalie Dr
Oak Forest, IL 60452
|
1,322 sq. feet
|
1 baths - beds |
show details | |

|
#17
Ridgeland Ave
Oak Forest, IL 60452
|
1,249 sq. feet
|
1 baths - beds |
show details | |

|
#18
Carol Belle Trl
Oak Forest, IL 60452
|
1,755 sq. feet
|
2 baths - beds |
show details | |

|
#19
Diane Ct
Oak Forest, IL 60452
|
1,456 sq. feet
|
2 baths - beds |
show details | |

|
#20
Judy Ct
Oak Forest, IL 60452
|
3,208 sq. feet
|
2 baths - beds |
show details |
| Photo | Address | Area | Beds / Baths | Price | Details |
|---|---|---|---|---|---|

|
#21
Grange Ave
Oak Forest, IL 60452
|
1,153 sq. feet
|
1 baths - beds |
show details | |

|
#22
Lavergne Ave
Oak Forest, IL 60452
|
941 sq. feet
|
1 baths - beds |
show details | |

|
#23
Newport Dr
Oak Forest, IL 60452
|
1,196 sq. feet
|
1 baths - beds |
show details | |

|
#24
Judy Ct
Oak Forest, IL 60452
|
3,208 sq. feet
|
2 baths - beds |
show details | |

|
#25
Newberry Ave
Oak Forest, IL 60452
|
2,066 sq. feet
|
3 baths - beds |
show details | |

|
#26
Oak Ave
Oak Forest, IL 60452
|
1,200 sq. feet
|
1 baths - beds |
show details | |

|
#27
Barry Ln
Oak Forest, IL 60452
|
1,212 sq. feet
|
1 baths - beds |
show details | |

|
#28
Lockwood Ave
Oak Forest, IL 60452
|
998 sq. feet
|
2 baths - beds |
show details | |

|
#29
155th St
Oak Forest, IL 60452
|
1,114 sq. feet
|
1 baths - beds |
show details | |

|
#30
Tudor Rd
Oak Forest, IL 60452
|
936 sq. feet
|
1 baths - beds |
show details |
| Photo | Address | Area | Beds / Baths | Price | Details |
|---|---|---|---|---|---|

|
#31
Christopher Dr
Oak Forest, IL 60452
|
1,434 sq. feet
|
2 baths - beds |
show details | |

|
#32
Forest Ct
Oak Forest, IL 60452
|
1,104 sq. feet
|
1 baths - beds |
show details | |

|
#33
Temple St
Oak Forest, IL 60452
|
1,200 sq. feet
|
1 baths - beds |
show details | |

|
#34
148th St
Oak Forest, IL 60452
|
956 sq. feet
|
1 baths - beds |
show details | |

|
#35
Chestnut Ln
Oak Forest, IL 60452
|
1,186 sq. feet
|
1 baths - beds |
show details | |

|
#36
Lisa Ln
Oak Forest, IL 60452
|
1,060 sq. feet
|
1 baths - beds |
show details | |

|
#37
Hickory Ln
Oak Forest, IL 60452
|
1,757 sq. feet
|
2 baths - beds |
show details | |

|
#38
Orange Ln
Oak Forest, IL 60452
|
1,008 sq. feet
|
1 baths - beds |
show details | |

|
#39
Hawthorne Rd
Oak Forest, IL 60452
|
1,402 sq. feet
|
1 baths - beds |
show details | |

|
#40
Temple St
Oak Forest, IL 60452
|
1,200 sq. feet
|
1 baths - beds |
show details |
| Photo | Address | Area | Beds / Baths | Price | Details |
|---|---|---|---|---|---|

|
#41
Essex Rd
Oak Forest, IL 60452
|
1,590 sq. feet
|
2 baths - beds |
show details | |

|
#42
Lockwood Ave
Oak Forest, IL 60452
|
1,016 sq. feet
|
1 baths - beds |
show details | |

|
#43
Jones Ct
Oak Forest, IL 60452
|
1,056 sq. feet
|
1 baths - beds |
show details | |

|
#44
Blair Ln
Oak Forest, IL 60452
|
1,008 sq. feet
|
1 baths - beds |
show details | |

|
#45
Lavergne Ave
Oak Forest, IL 60452
|
1,018 sq. feet
|
1 baths - beds |
show details | |

|
#46
Cicero Ave
Oak Forest, IL 60452
|
1,196 sq. feet
|
1 baths - beds |
show details | |

|
#47
Boca Rio Dr
Oak Forest, IL 60452
|
1,196 sq. feet
|
1 baths - beds |
show details | |

|
#48
Long Ave
Oak Forest, IL 60452
|
1,265 sq. feet
|
1 baths - beds |
show details | |

|
#49
Menard Ave
Oak Forest, IL 60452
|
1,231 sq. feet
|
1 baths - beds |
show details | |

|
Check over 1 million property listings on Foreclosure.com!
|
browse all offers | |||


Median year apartment built: 1981
Household type by relationship:
Households: 26,594- Male householders: 5,174 (1,032 living alone), Female householders: 4,764 (1,255 living alone)
5,817 spouses (5,770 opposite-sex spouses), 543 unmarried partners, (543 opposite-sex unmarried partners), 8,113 children (7,371 natural, 165 adopted, 576 stepchildren), 525 grandchildren, 249 brothers or sisters, 264 parents, 13 foster children, 611 other relatives, 468 non-relatives
- In group quarters: 47
Size of family households: 2,998 2-persons, 1,865 3-persons, 1,313 4-persons, 690 5-persons, 229 6-persons, 162 7-or-more-persons.
Size of nonfamily households: 2,457 1-person, 574 2-persons, 17 3-persons.
3,697 married couples with children.
1,304 single-parent households (521 men, 783 women).
81.8% of residents of Oak Forest speak English at home.
8.4% of residents speak Spanish at home (61% speak English very well, 25% speak English well, 12% speak English not well, 2% don't speak English at all).
4.6% of residents speak other Indo-European language at home (62% speak English very well, 19% speak English well, 13% speak English not well, 5% don't speak English at all).
1.6% of residents speak Asian or Pacific Island language at home (49% speak English very well, 43% speak English well, 8% speak English not well).
2.9% of residents speak other language at home (67% speak English very well, 33% speak English well).
Foreign born population: 2,830 (10.6%)
(46.9% of them are naturalized citizens)
| Here: | 6.5 |
| State: | 6.4 |
| Here: | 4.1 |
| State: | 4.1 |

- Bedrooms in owner-occupied houses and condos in Oak Forest, Illinois
- 41no bedroom
- 1911 bedroom
- 1,2802 bedrooms
- 4,5313 bedrooms
- 1,8374 bedrooms
- 4185+ bedrooms

- Bedrooms in renter-occupied apartments in Oak Forest, Illinois
- 147no bedroom
- 5381 bedroom
- 8552 bedrooms
- 4183 bedrooms
- 1144 bedrooms
- 135+ bedrooms

- Cars and other vehicles available in Oak Forest in owner-occupied houses/condos
- 187no vehicle
- 1,9911 vehicle
- 3,8462 vehicles
- 1,4343 vehicles
- 6304 vehicles
- 2095+ vehicles

- Cars and other vehicles available in Oak Forest in renter-occupied apartments
- 269no vehicle
- 1,1731 vehicle
- 5312 vehicles
- 1133 vehicles
- 04 vehicles
- 05+ vehicles

- Rooms in owner-occupied houses in Oak Forest, Illinois
- 411 room
- 02 rooms
- 963 rooms
- 7654 rooms
- 1,2185 rooms
- 2,0116 rooms
- 1,7307 rooms
- 1,1278 rooms
- 1,3099+ rooms

- Rooms in renter-occupied apartments in Oak Forest, Illinois
- 751 room
- 1002 rooms
- 5243 rooms
- 4874 rooms
- 3365 rooms
- 2566 rooms
- 1347 rooms
- 1038 rooms
- 709+ rooms


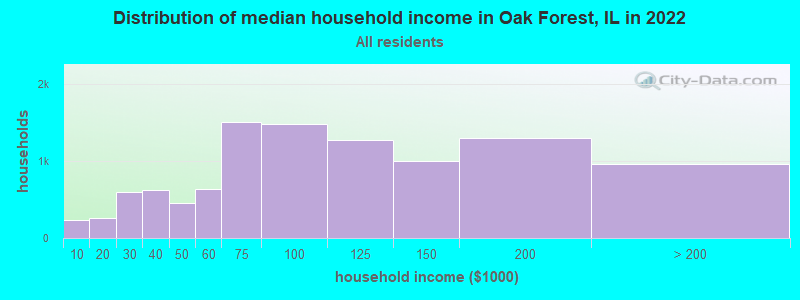
Oak Forest, IL household income distribution

- 238Less than $10,000
- 266$10,000 to $19,999
- 593$20,000 to $29,999
- 624$30,000 to $39,999
- 453$40,000 to $49,999
- 640$50,000 to $59,999
- 1,510$60,000 to $74,999
- 1,483$75,000 to $99,999
- 1,273$100,000 to $124,999
- 999$125,000 to $149,999
- 1,302$150,000 to $199,999
- 962$200,000 or more
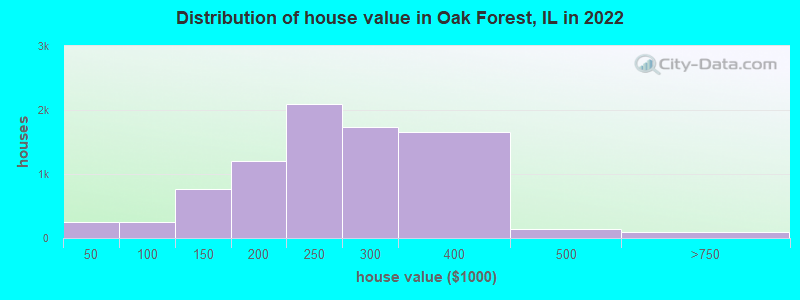
Home value of owner - occupied houses in 2022 in Oak Forest, IL
-
- 44Less than $10,000
- 61$10,000 to $14,999
- 28$20,000 to $24,999
- 54$25,000 to $29,999
- 48$30,000 to $34,999
- 5$40,000 to $49,999
- 8$50,000 to $59,999
- 19$60,000 to $69,999
- 44$70,000 to $79,999
- 131$80,000 to $89,999
- 43$90,000 to $99,999
- 356$100,000 to $124,999
- 401$125,000 to $149,999
- 660$150,000 to $174,999
- 548$175,000 to $199,999
- 2,093$200,000 to $249,999
- 1,738$250,000 to $299,999
- 1,657$300,000 to $399,999
- 142$400,000 to $499,999
- 75$500,000 to $749,999
- 11$750,000 to $999,999
Rent paid by renters in 2022 in Oak Forest, IL
-
- 20$150 to $199
- 21$200 to $249
- 12$450 to $499
- 12$600 to $649
- 105$650 to $699
- 48$700 to $749
- 300$800 to $899
- 115$900 to $999
- 636$1,000 to $1,249
- 338$1,250 to $1,499
- 218$1,500 to $1,999
- 100$2,000 to $2,499
- 189No cash rent

Percentage of workers working in this county: 83.6%
Number of people working at home: 1,929 (13.6% of all workers)
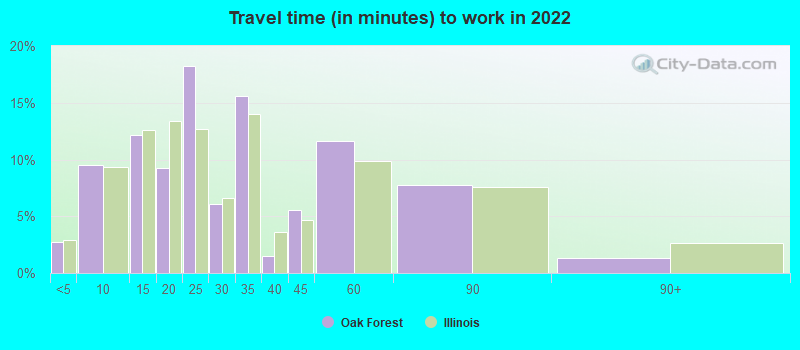
Travel time to work (commute)
- Less than 5 minutes: 203
- 5 to 9 minutes: 915
- 10 to 14 minutes: 795
- 15 to 19 minutes: 1,535
- 20 to 24 minutes: 2,036
- 25 to 29 minutes: 616
- 30 to 34 minutes: 1,755
- 35 to 39 minutes: 411
- 40 to 44 minutes: 580
- 45 to 59 minutes: 1,139
- 60 to 89 minutes: 1,661
- 90 or more minutes: 370
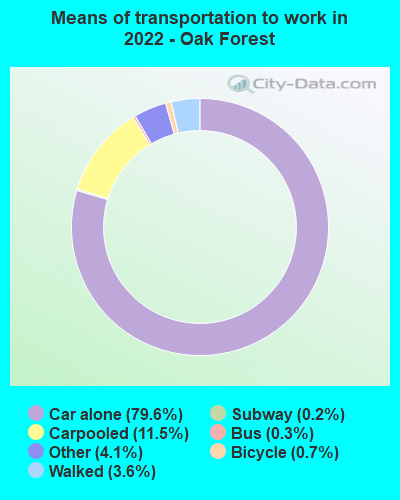
Means of transportation to work:
- Drove a car alone: 4,030 (60.7%)
- Carpooled: 623 (9.4%)
- Bus: 15 (0.2%)
- Long-distance train or commuter rail: 5 (0.1%)
- Taxi: 210 (3.2%)
- Bicycle: 36 (0.5%)
- Walked: 187 (2.8%)
- Worked at home: 1,929 (29.0%)
- Unemployment by race in 2022
- Unemployment rate for White non-Hispanic residents
- 2.7%Males
- 1.8%Females
- Unemployment rate for Black residents
- 1.4%Males
- 12.7%Females
- Unemployment rate for Asian residents
- 15.8%Males
- 5.1%Females
- Unemployment rate for other race residents
- 2.1%Males
- 15.9%Females
- Unemployment rate for two or more race residents
- 2.1%Males
- 6.1%Females
- Unemployment rate for Hispanic or Latino residents
- 2.5%Males
- 9.1%Females

- Year of entry for the foreign-born population in Oak Forest, Illinois
- 1,3822010 or later
- 2612000 to 2009
- 7091990 to 1999
- 4031980 to 1989
- 1861970 to 1979
- 411Before 1970
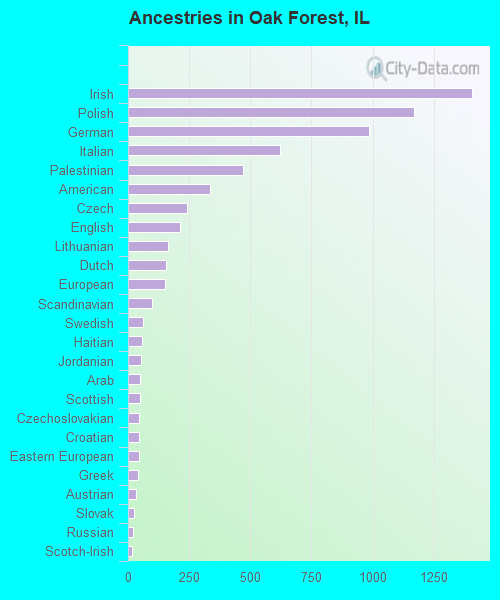
First ancestries reported:
- Irish: 1,406 (13.0%)
- Polish: 1,170 (10.8%)
- German: 985 (9.1%)
- Italian: 622 (5.7%)
- Palestinian: 470 (4.3%)
- American: 334 (3.1%)
- Czech: 240 (2.2%)
- English: 211 (1.9%)
- Lithuanian: 162 (1.5%)
- Dutch: 154 (1.4%)
- European: 151 (1.4%)
- Scandinavian: 99 (0.9%)
- Swedish: 61 (0.6%)
- Haitian: 56 (0.5%)
- Jordanian: 55 (0.5%)
- Arab: 49 (0.5%)
- Scottish: 48 (0.4%)
- Czechoslovakian: 47 (0.4%)
- Croatian: 46 (0.4%)
- Eastern European: 43 (0.4%)
- Greek: 39 (0.4%)
- Austrian: 34 (0.3%)
- Slovak: 25 (0.2%)
- Russian: 20 (0.2%)
- Scotch-Irish: 18 (0.2%)
- Danish: 17 (0.2%)
- African: 17 (0.2%)
- Finnish: 14 (0.1%)
- Norwegian: 14 (0.1%)
- Swiss: 10 (0.09%)
- Hungarian: 5 (0.05%)
- British: 2 (0.02%)
Most common places of birth for foreign-born residents (%):
| Oak Forest: | 29.8% (843) |
| Illinois: | 34.7% (626,958) |
| Oak Forest: | 27.4% (776) |
| Illinois: | 9.2% (166,409) |
| Oak Forest: | 10.6% (299) |
| Illinois: | 5.2% (93,003) |
| Oak Forest: | 5.8% (165) |
| Illinois: | 6.9% (124,474) |
| Oak Forest: | 4.8% (137) |
| Illinois: | 0.5% (8,827) |
| Oak Forest: | 3.4% (97) |
| Illinois: | 1.2% (21,186) |
| Oak Forest: | 1.7% (48) |
| Illinois: | 0.9% (15,679) |
| Oak Forest: | 1.6% (46) |
| Illinois: | 1.6% (29,519) |
Place of birth for U.S.-born residents:
- This state: 21,006
- Other state: 2,290
- Northeast: 348
- Midwest: 1,192
- South: 468
- West: 301
90.4% of Oak Forest residents lived in the same house 1 years ago.
Out of people who lived in different houses, 43.9% lived in this county.
Out of people who lived in different counties, 23.1% lived in Illinois.
| Oak Forest: | 90.4% |
| State average: | 88.3% |
Education attainment for males 25 years and older:
- No schooling: 125
- Nursery to 4th grade: 25
- 5th and 6th grade: 24
- 7th and 8th grade: 38
- 9th grade: 21
- 10th grade: 85
- 11th grade: 77
- 12th grade, no diploma: 264
- High school graduate (or equivalency): 2,738
- Less than 1 year of college: 840
- Some college more than 1 year, no degree: 1,220
- Associate degree: 690
- Bachelor's degree: 2,173
- Master's degree: 519
- Professional school degree: 128
- Doctorate degree: 43

Education attainment for females 25 years and older:
- No schooling: 155
- Nursery to 4th grade: 3
- 5th and 6th grade: 0
- 7th and 8th grade: 79
- 9th grade: 67
- 10th grade: 79
- 11th grade: 32
- 12th grade, no diploma: 219
- High school graduate (or equivalency): 2,291
- Less than 1 year of college: 917
- Some college more than 1 year, no degree: 1,563
- Associate degree: 1,122
- Bachelor's degree: 2,042
- Master's degree: 1,025
- Professional school degree: 53
- Doctorate degree: 74


Housing units in structures:
- One, detached: 7,609
- One, attached: 391
- Two: 37
- 3 or 4: 164
- 5 to 9: 823
- 10 to 19: 1,132
- 20 to 49: 272
- 50 or more: 106
Housing units lacking complete kitchen facilities in 2022: 0.7%
House/condo owner moved in on average 17 years ago
Renter moved in on average 3 years ago

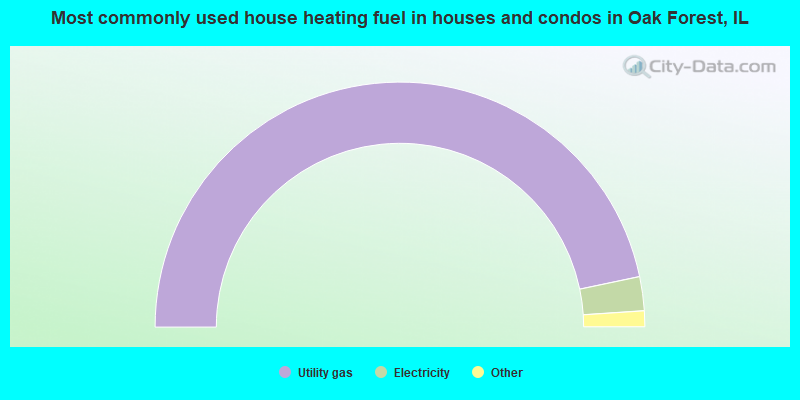
- 93.4%Utility gas
- 4.5%Electricity
- 1.4%Bottled, tank, or LP gas
- 0.2%Other fuel
- 0.2%No fuel used
- 0.2%Fuel oil, kerosene, etc.
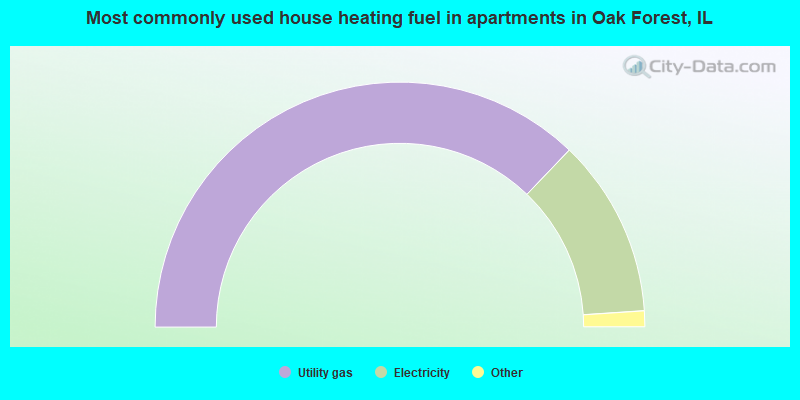
- 74.3%Utility gas
- 23.6%Electricity
- 1.1%No fuel used
- 1.0%Fuel oil, kerosene, etc.
Private vs. public school enrollment:
| Here: | 9.4% |
| Illinois: | 13.3% |
| Here: | 3.2% |
| Illinois: | 9.9% |
| Here: | 26.1% |
| Illinois: | 27.4% |


