Oak Grove, OR (Oregon) Houses and Residents
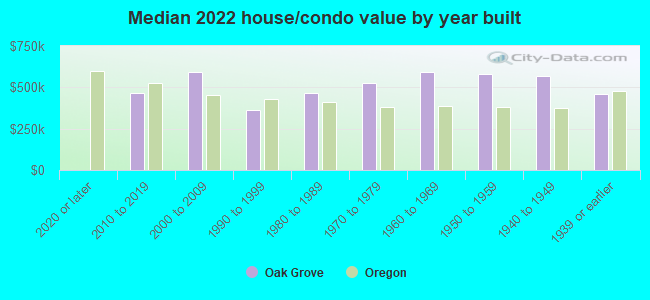
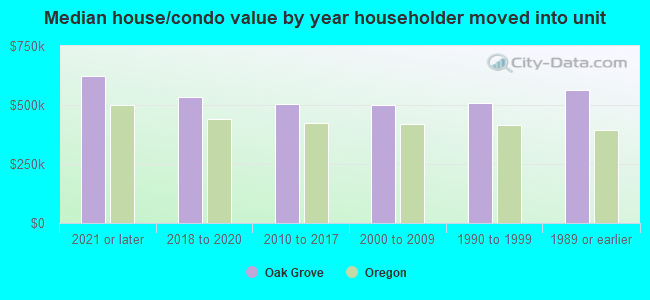
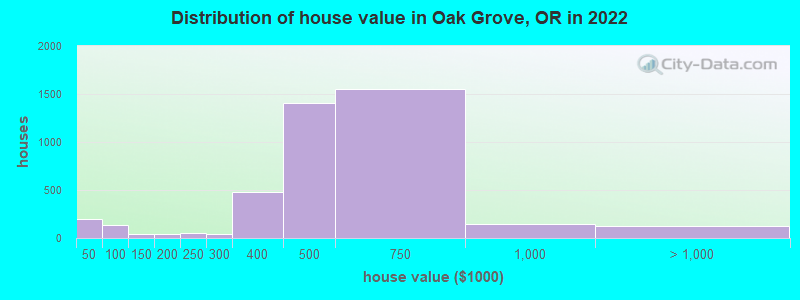
Estimated median house or condo value in 2022: $521,364 (it was $154,400 in 2000 )
Oak Grove:
$521,364Oregon:
$475,600
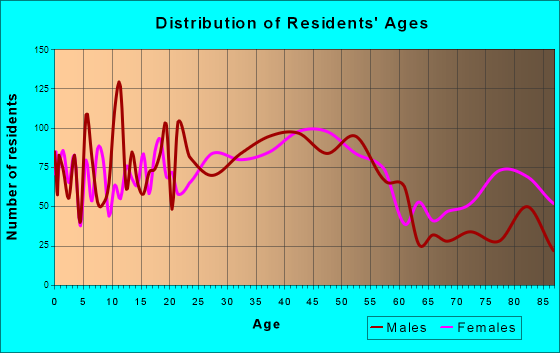
Lower value quartile - upper value quartile: $410,308 - $650,977Total population: 16,629 (Urban population: 12,571, Rural population: 0)
Houses: 7,850 (7,432 occupied: 4,816 owner occupied, 2,588 renter occupied )
% of renters here:
35%State:
37%
Housing density: 2,684 houses/condos per square mile
Median price asked for vacant for-sale houses and condos in 2022: $368,206.
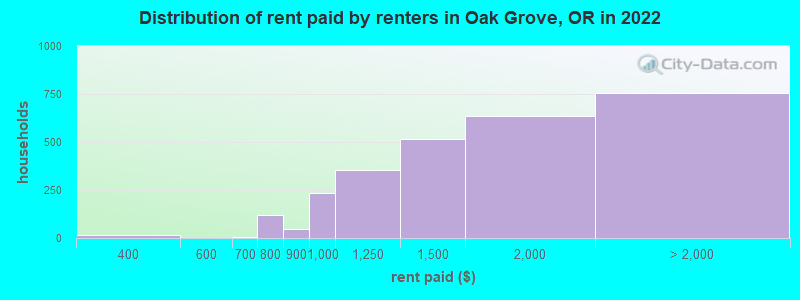
Median contract rent in 2022: $1,483 (lower quartile is $1,145, upper quartile is $1,960)
Median rent asked for vacant for-rent units in 2022: $5,512
Median gross rent in Oak Grove, OR in 2022: $1,648
Housing units in Oak Grove with a mortgage: 3,450 (505 second mortgage, 31 home equity loan, 359 both second mortgage and home equity loan )Houses without a mortgage: 109
Median household income for houses/condos with a mortgage: $101,804
Median household income for apartments without a mortgage: $54,692
Median monthly housing costs: $1,574
Data:
Median house or condo value ($)
Median house or condo value ($ change since 2000)
Median house or condo value ($) - White
Median house or condo value ($) - Black or African American
Median house or condo value ($) - Asian
Median house or condo value ($) - Hispanic or Latino
Median house or condo value ($) - American Indian and Alaska Native
Median house or condo value ($) - Multirace
Median house or condo value ($) - Other Race
Median price asked for mobile homes ($)
Household density (households per square mile)
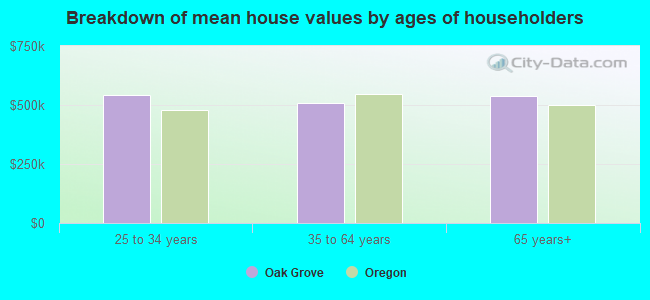
Mean house or condo value by units in structure - 1, detached ($)
Mean house or condo value by units in structure - 1, attached ($)
Mean house or condo value by units in structure - 2 ($)
Mean house or condo value by units in structure by units in structure - 3 or 4 ($)
Mean house or condo value by units in structure - 5 or more ($)
Mean house or condo value by units in structure - Boat, RV, van, etc. ($)
Mean house or condo value by units in structure - Mobile home ($)
Median contract rent ($)
Median contract rent - Lower quartile ($)
Median contract rent - Upper quartile ($)
Median gross rent ($)
Urban houses (%)
Rural houses (%)
Houses occupied (%)
Houses occupied (% change since 2000)
Houses owner occupied (%)
Houses owner occupied (% change since 2000)
Houses renter occupied (%)
Houses renter occupied (% change since 2000)
Vacant housing units - For rent (%)
Vacant housing units - For rent (% change since 2000)
Vacant housing units - For sale only (%)
Vacant housing units - For sale only (% change since 2000)
Vacant housing units - Rented or sold, not occupied (%)
Vacant housing units - Rented or sold, not occupied (% change since 2000)
Vacant housing units - For seasonal, recreational, or occasional use (%)
Vacant housing units - For seasonal, recreational, or occasional use (% change since 2000)
Vacant housing units - For migrant workers (%)
Vacant housing units - For migrant workers (% change since 2000)
Vacant housing units - Other vacant (%)
Vacant housing units - Other vacant (% change since 2000)
Median monthly housing costs ($)
Median household income for houses/condos with a mortgage ($)
Median household income for houses/condos without a mortgage ($)
Median household income ($)
Median household income ($) - White
Median household income ($) - Black or African American
Median household income ($) - Asian
Median household income ($) - Hispanic or Latino
Median household income ($) - American Indian and Alaska Native
Median household income ($) - Multirace
Median household income ($) - Other Race
Mortgage status - with mortgage (%)
Mortgage status - with second mortgage (%)
Mortgage status - with home equity loan (%)
Mortgage status - with both second mortgage and home equity loan (%)
Mortgage status - without a mortgage (%)
Median year house/condo built
Median year apartment built
Household type by relationship - Male householder living alone (%)
Household type by relationship - Male householder not living alone (%)
Household type by relationship - Female householder living alone (%)
Household type by relationship - Female householder not living alone (%)
Household type by relationship - Opposite-Sex spouse (%)
Household type by relationship - Same-Sex spouse (%)
Household type by relationship - Opposite-Sex unmarried partner (%)
Household type by relationship - Same-Sex unmarried partner (%)
Household type by relationship - In group quarters (%)
Size of family households - 2-person household (%)
Size of family households - 3-person household (%)
Size of family households - 4-person household (%)
Size of family households - 5-person household (%)
Size of family households - 6-person household (%)
Size of family households - 7-or-more-person household (%)
Size of nonfamily households - 1-person household (%)
Size of nonfamily households - 2-person household (%)
Size of nonfamily households - 3-person household (%)
Size of nonfamily households - 4-person household (%)
Size of nonfamily households - 5-person household (%)
Size of nonfamily households - 6-person household (%)
Size of nonfamily households - 7-or-moreperson household (%)
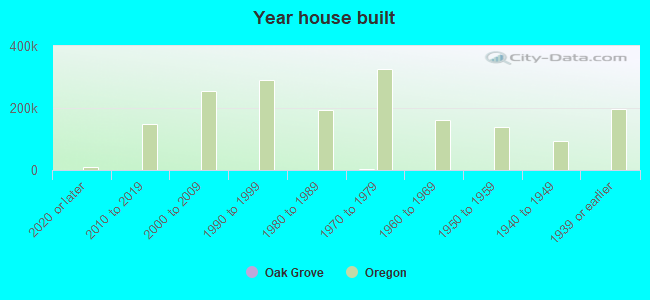
Year house built - Built 2010 or later (%)
Year house built - Built 2000 to 2009 (%)
Year house built - Built 1990 to 1999 (%)
Year house built - Built 1980 to 1989 (%)
Year house built - Built 1970 to 1979 (%)
Year house built - Built 1960 to 1969 (%)
Year house built - Built 1950 to 1959 (%)
Year house built - Built 1940 to 1949 (%)
Year house built - Built 1939 or earlier (%)
Median number of rooms in houses and condos
Median number of rooms in apartments
Median number of bedrooms in owner occupied houses
Mean number of bedrooms in owner occupied houses
Median number of bedrooms in renter occupied houses
Mean number of bedrooms in renter occupied houses
Median number of vehichles in owner occupied houses
Mean number of vehichles in owner occupied houses
Median number of vehichles in renter occupied houses
Mean number of vehichles in renter occupied houses
Rooms in owner-occupied houses - 1 room (%)
Rooms in owner-occupied houses - 2 rooms (%)
Rooms in owner-occupied houses - 3 rooms (%)
Rooms in owner-occupied houses - 4 rooms (%)
Rooms in owner-occupied houses - 5 rooms (%)
Rooms in owner-occupied houses - 6 rooms (%)
Rooms in owner-occupied houses - 7 rooms (%)
Rooms in owner-occupied houses - 8 rooms (%)
Rooms in owner-occupied houses - 9+ rooms (%)
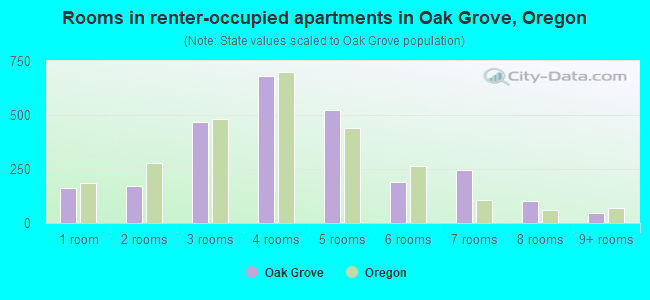
Rooms in renter-occupied houses - 1 room (%)
Rooms in renter-occupied houses - 2 rooms (%)
Rooms in renter-occupied houses - 3 rooms (%)
Rooms in renter-occupied houses - 4 rooms (%)
Rooms in renter-occupied houses - 5 rooms (%)
Rooms in renter-occupied houses - 6 rooms (%)
Rooms in renter-occupied houses - 7 rooms (%)
Rooms in renter-occupied houses - 8 rooms (%)
Rooms in renter-occupied houses - 9+ rooms (%)
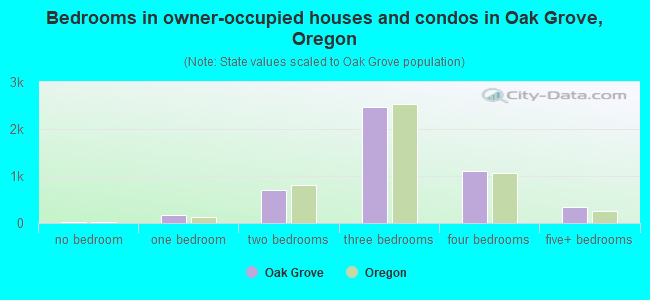
Bedrooms in owner-occupied houses - no bedrooms (%)
Bedrooms in owner-occupied houses - 1 bedroom (%)
Bedrooms in owner-occupied houses - 2 bedrooms (%)
Bedrooms in owner-occupied houses - 3 bedrooms (%)
Bedrooms in owner-occupied houses - 4 bedrooms (%)
Bedrooms in owner-occupied houses - 5+ bedrooms (%)
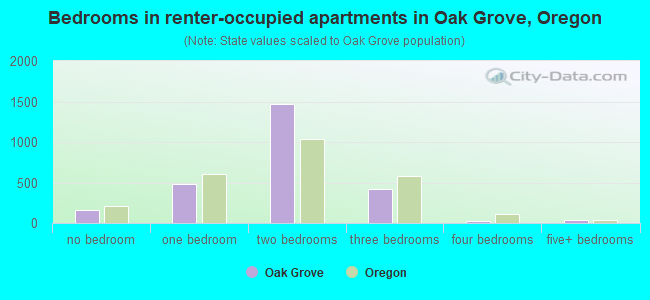
Bedrooms in renter-occupied houses - no bedrooms (%)
Bedrooms in renter-occupied houses - 1 bedroom (%)
Bedrooms in renter-occupied houses - 2 bedrooms (%)
Bedrooms in renter-occupied houses - 3 bedrooms (%)
Bedrooms in renter-occupied houses - 4 bedrooms (%)
Bedrooms in renter-occupied houses - 5+ bedrooms (%)
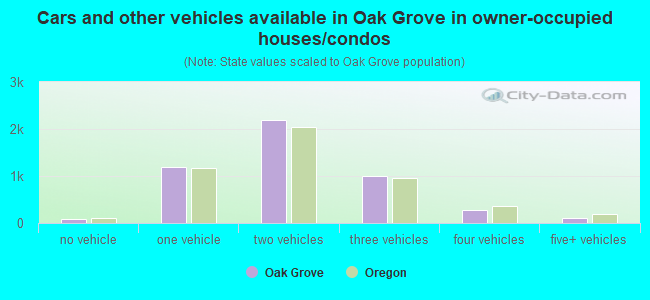
Vehicles available in owner-occupied houses - no vehicle available (%)
Vehicles available in owner-occupied houses - 1 vehicle available(%)
Vehicles available in owner-occupied houses - 2 Vehicles available (%)
Vehicles available in owner-occupied houses - 3 Vehicles available (%)
Vehicles available in owner-occupied houses - 4 Vehicles available (%)
Vehicles available in owner-occupied houses - 5+ Vehicles available (%)
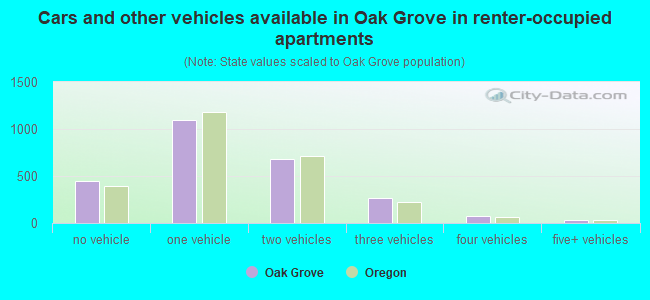
Vehicles available in renter-occupied houses - no vehicle available (%)
Vehicles available in renter-occupied houses - 1 vehicle available (%)
Vehicles available in renter-occupied houses - 2 Vehicles available (%)
Vehicles available in renter-occupied houses - 3 Vehicles available (%)
Vehicles available in renter-occupied houses - 4 Vehicles available (%)
Vehicles available in renter-occupied houses - 5+ Vehicles available (%)
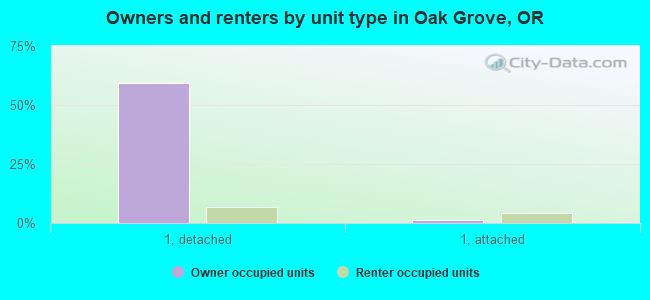
Housing units in structures - 1, detached (%)
Housing units in structures - 1, attached (%)
Housing units in structures - 2 (%)
Housing units in structures - 3 or 4 (%)
Housing units in structures - 5 to 9 (%)
Housing units in structures - 10 to 19 (%)
Housing units in structures - 20 to 49 (%)
Housing units in structures - 50 or more (%)
Housing units in structures - Mobile home (%)
Housing units in structures - Boat, RV, van, etc. (%)
Housing units in structures - Owners - 1, detached (%)
Housing units in structures - Owners - 1, attached (%)
Housing units in structures - Owners - 2 (%)
Housing units in structures - Owners - 3 or 4 (%)
Housing units in structures - Owners - 5 to 9 (%)
Housing units in structures - Owners - 10 to 19 (%)
Housing units in structures - Owners - 20 to 49 (%)
Housing units in structures - Owners - 50 or more (%)
Housing units in structures - Owners - Mobile home (%)
Housing units in structures - Owners - Boat, RV, van, etc. (%)
Housing units in structures - Renters - 1, detached (%)
Housing units in structures - Renters - 1, attached (%)
Housing units in structures - Renters - 2 (%)
Housing units in structures - Renters - 3 or 4 (%)
Housing units in structures - Renters - 5 to 9 (%)
Housing units in structures - Renters - 10 to 19 (%)
Housing units in structures - Renters - 20 to 49 (%)
Housing units in structures - Renters - 50 or more (%)
Housing units in structures - Renters - Mobile home (%)
Housing units in structures - Renters - Boat, RV, van, etc. (%)
House/condo owner moved in on average (years ago)
Renter moved in on average (years ago)
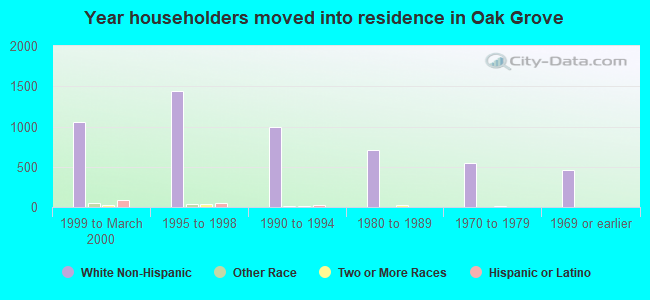
Year householder moved into unit - Moved in 1999 to March 2000 (%)
Year householder moved into unit - Moved in 1999 to March 2000 (%) - White
Year householder moved into unit - Moved in 1999 to March 2000 (%) - Black or African American
Year householder moved into unit - Moved in 1999 to March 2000 (%) - Asian
Year householder moved into unit - Moved in 1999 to March 2000 (%) - Hispanic or Latino
Year householder moved into unit - Moved in 1999 to March 2000 (%) - American Indian and Alaska Native
Year householder moved into unit - Moved in 1999 to March 2000 (%) - Multirace
Year householder moved into unit - Moved in 1999 to March 2000 (%) - Other Race
Year householder moved into unit - Moved in 1995 to 1998 (%)
Year householder moved into unit - Moved in 1995 to 1998 (%) - White
Year householder moved into unit - Moved in 1995 to 1998 (%) - Black or African American
Year householder moved into unit - Moved in 1995 to 1998 (%) - Asian
Year householder moved into unit - Moved in 1995 to 1998 (%) - Hispanic or Latino
Year householder moved into unit - Moved in 1995 to 1998 (%) - American Indian and Alaska Native
Year householder moved into unit - Moved in 1995 to 1998 (%) - Multirace
Year householder moved into unit - Moved in 1995 to 1998 (%) - Other Race
Year householder moved into unit - Moved in 1990 to 1994 (%)
Year householder moved into unit - Moved in 1990 to 1994 (%) - White
Year householder moved into unit - Moved in 1990 to 1994 (%) - Black or African American
Year householder moved into unit - Moved in 1990 to 1994 (%) - Asian
Year householder moved into unit - Moved in 1990 to 1994 (%) - Hispanic or Latino
Year householder moved into unit - Moved in 1990 to 1994 (%) - American Indian and Alaska Native
Year householder moved into unit - Moved in 1990 to 1994 (%) - Multirace
Year householder moved into unit - Moved in 1990 to 1994 (%) - Other Race
Year householder moved into unit - Moved in 1980 to 1989 (%)
Year householder moved into unit - Moved in 1980 to 1989 (%) - White
Year householder moved into unit - Moved in 1980 to 1989 (%) - Black or African American
Year householder moved into unit - Moved in 1980 to 1989 (%) - Asian
Year householder moved into unit - Moved in 1980 to 1989 (%) - Hispanic or Latino
Year householder moved into unit - Moved in 1980 to 1989 (%) - American Indian and Alaska Native
Year householder moved into unit - Moved in 1980 to 1989 (%) - Multirace
Year householder moved into unit - Moved in 1980 to 1989 (%) - Other Race
Year householder moved into unit - Moved in 1970 to 1979 (%)
Year householder moved into unit - Moved in 1970 to 1979 (%) - White
Year householder moved into unit - Moved in 1970 to 1979 (%) - Black or African American
Year householder moved into unit - Moved in 1970 to 1979 (%) - Asian
Year householder moved into unit - Moved in 1970 to 1979 (%) - Hispanic or Latino
Year householder moved into unit - Moved in 1970 to 1979 (%) - American Indian and Alaska Native
Year householder moved into unit - Moved in 1970 to 1979 (%) - Multirace
Year householder moved into unit - Moved in 1970 to 1979 (%) - Other Race
Year householder moved into unit - Moved in 1969 or earlier (%)
Year householder moved into unit - Moved in 1969 or earlier (%) - White
Year householder moved into unit - Moved in 1969 or earlier (%) - Black or African American
Year householder moved into unit - Moved in 1969 or earlier (%) - Asian
Year householder moved into unit - Moved in 1969 or earlier (%) - Hispanic or Latino
Year householder moved into unit - Moved in 1969 or earlier (%) - American Indian and Alaska Native
Year householder moved into unit - Moved in 1969 or earlier (%) - Multirace
Year householder moved into unit - Moved in 1969 or earlier (%) - Other Race
Housing units lacking complete plumbing facilities (%)
Housing units lacking complete kitchen facilities (%)
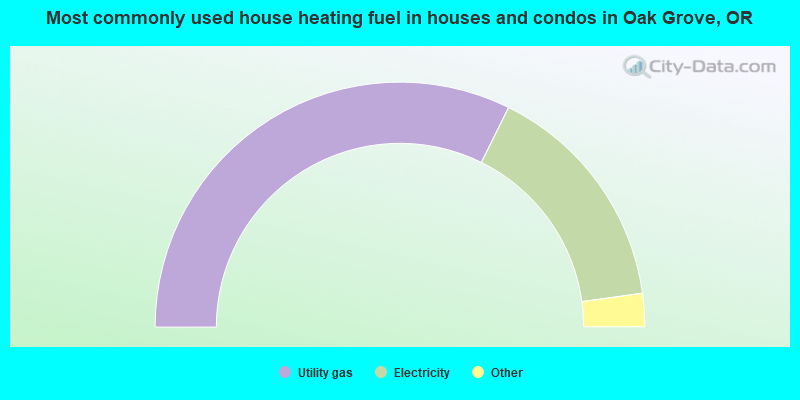
House heating fuel used in houses and condos - Utility gas (%)
House heating fuel used in houses and condos - Bottled, tank, or LP gas (%)
House heating fuel used in houses and condos - Electricity (%)
House heating fuel used in houses and condos - Fuel oil, kerosene, etc. (%)
House heating fuel used in houses and condos - Coal or coke (%)
House heating fuel used in houses and condos - Wood (%)
House heating fuel used in houses and condos - Solar energy (%)
House heating fuel used in houses and condos - Other fuel (%)
House heating fuel used in houses and condos - No fuel used (%)
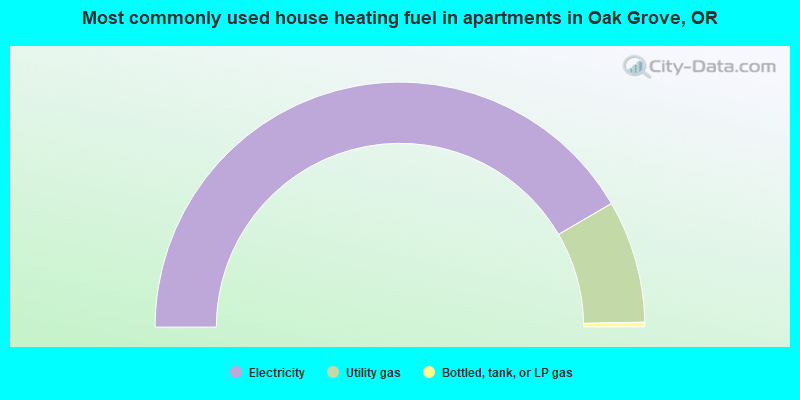
House heating fuel used in apartments - Utility gas (%)
House heating fuel used in apartments - Bottled, tank, or LP gas (%)
House heating fuel used in apartments - Electricity (%)
House heating fuel used in apartments - Fuel oil, kerosene, etc. (%)
House heating fuel used in apartments - Coal or coke (%)
House heating fuel used in apartments - Wood (%)
House heating fuel used in apartments - Solar energy (%)
House heating fuel used in apartments - Other fuel (%)
House heating fuel used in apartments - No fuel used (%)
Median year house/condo built: 1968Median year apartment built: 1977Household type by relationship:
Households: 17,628
Male householders: 3,568 (1,087 living alone ), Female householders: 3,747 (1,142 living alone )3,145 spouses (3,120 opposite-sex spouses ), 533 unmarried partners , (470 opposite-sex unmarried partners ), 3,918 children (3,691 natural , 110 adopted , 116 stepchildren ), 217 grandchildren , 349 brothers or sisters , 353 parents , 0 foster children , 470 other relatives , 929 non-relatives In group quarters: 392
Size of family households: 2,099 2-persons , 1,201 3-persons , 584 4-persons , 222 5-persons , 106 6-persons , 126 7-or-more-persons .
Size of nonfamily households: 2,222 1-person , 558 2-persons , 174 3-persons , 6 4-persons , 33 5-persons .
2,164 married couples with children. single-parent households (152 men , 317 women ).
87.0% of residents of Oak Grove speak English at home. of residents speak Spanish at home (48% speak English very well , 19% speak English well , 34% speak English not well ).of residents speak other Indo-European language at home (61% speak English very well , 21% speak English well , 18% speak English not well ).of residents speak Asian or Pacific Island language at home (81% speak English very well , 12% speak English well , 7% speak English not well ).of residents speak other language at home (42% speak English very well , 58% speak English well ).
Foreign born population: 1,437 (8.2%)of them are naturalized citizens )
Median number of rooms in houses and condos:
Median number of rooms in apartments
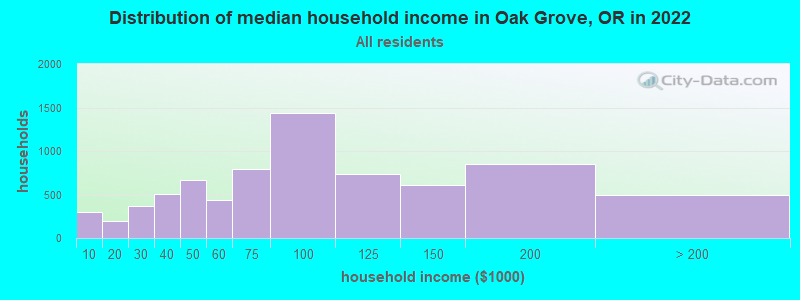
Oak Grove, OR household income distribution 294 Less than $10,000196 $10,000 to $19,999363 $20,000 to $29,999506 $30,000 to $39,999671 $40,000 to $49,999441 $50,000 to $59,999794 $60,000 to $74,9991,432 $75,000 to $99,999734 $100,000 to $124,999606 $125,000 to $149,999850 $150,000 to $199,999495 $200,000 or more
Home value of owner - occupied houses in 2022 in Oak Grove, OR 69 Less than $10,0006 $10,000 to $14,99943 $20,000 to $24,99918 $25,000 to $29,99924 $35,000 to $39,99940 $40,000 to $49,9999 $50,000 to $59,99922 $70,000 to $79,99964 $80,000 to $89,99912 $100,000 to $124,99925 $125,000 to $149,99934 $150,000 to $174,99912 $175,000 to $199,99947 $200,000 to $249,99939 $250,000 to $299,999478 $300,000 to $399,9991,407 $400,000 to $499,9991,554 $500,000 to $749,999149 $750,000 to $999,99921 $1,000,000 to $1,499,99985 $1,500,000 to $1,999,99919 $2,000,000 or moreRent paid by renters in 2022 in Oak Grove, OR 16 $350 to $3995 $650 to $69963 $700 to $74958 $750 to $79947 $800 to $899233 $900 to $999353 $1,000 to $1,249514 $1,250 to $1,499633 $1,500 to $1,999362 $2,000 to $2,49918 $2,500 to $2,9996 $3,000 to $3,499276 $3,500 or more91 No cash rent
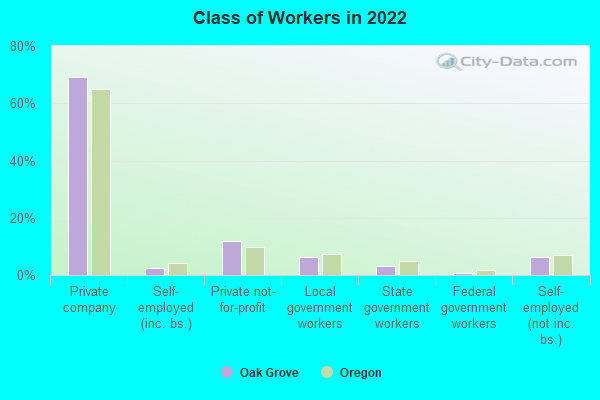
Percentage of workers working in this county: 63.2%Number of people working at home: 2,183 (25.4% of all workers )
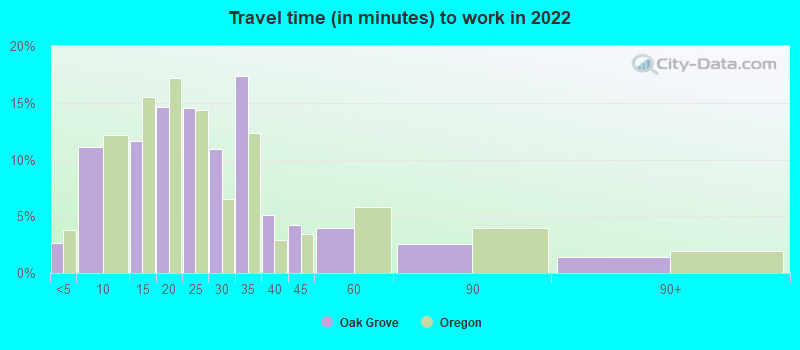
Travel time to work (commute)
Less than 5 minutes: 1215 to 9 minutes: 56510 to 14 minutes: 58915 to 19 minutes: 1,17420 to 24 minutes: 95525 to 29 minutes: 60530 to 34 minutes: 92535 to 39 minutes: 35740 to 44 minutes: 32045 to 59 minutes: 40160 to 89 minutes: 42290 or more minutes: 45
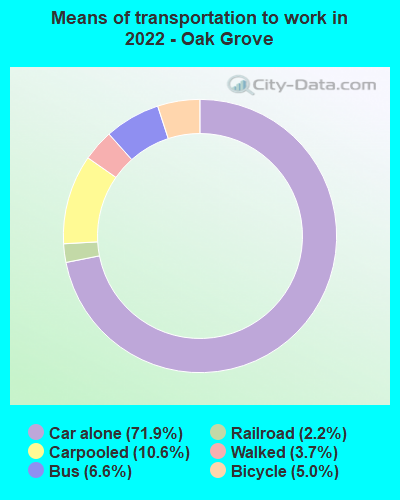
Means of transportation to work:
Drove a car alone: 2,250 (44.3%)Carpooled: 321 (6.3%)Bus : 230 (4.5%)Light rail, streetcar or trolley : 152 (3.0%)Bicycle: 210 (4.1%)Walked: 146 (2.9%)Worked at home: 2,183 (43.0%)
Unemployment by race in 2022
Unemployment rate for White non-Hispanic residents 4.2% Males1.4% FemalesUnemployment rate for American Indian and Alaska Native residents 16.7% Males84.2% FemalesUnemployment rate for other race residents 24.4% FemalesUnemployment rate for two or more race residents 19.3% MalesUnemployment rate for Hispanic or Latino residents 13.1% Males9.9% Females
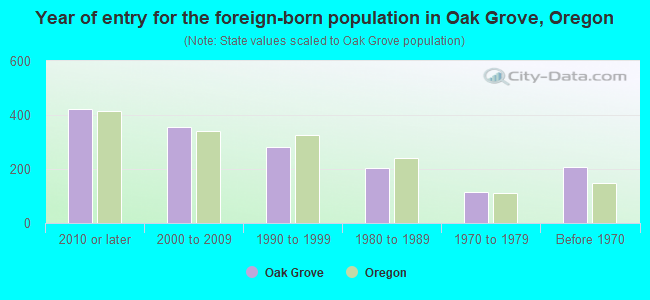
Year of entry for the foreign-born population in Oak Grove, Oregon
423 2010 or later 355 2000 to 2009 280 1990 to 1999 202 1980 to 1989 115 1970 to 1979 208 Before 1970
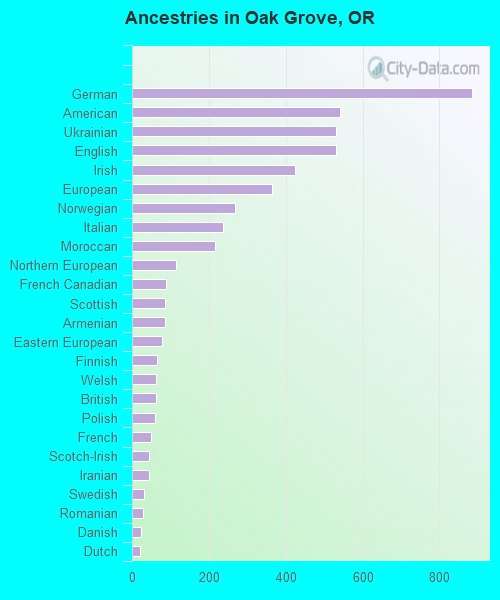
First ancestries reported:
German: 885 (11.3%)
American: 541 (6.9%)
Ukrainian: 530 (6.7%)
English: 530 (6.7%)
Irish: 424 (5.4%)
European: 365 (4.6%)
Norwegian: 269 (3.4%)
Italian: 236 (3.0%)
Moroccan: 217 (2.8%)
Northern European: 115 (1.5%)
French Canadian: 88 (1.1%)
Scottish: 86 (1.1%)
Armenian: 85 (1.1%)
Eastern European: 79 (1.0%)
Finnish: 64 (0.8%)
Welsh: 63 (0.8%)
British: 62 (0.8%)
Polish: 61 (0.8%)
French: 49 (0.6%)
Scotch-Irish: 44 (0.6%)
Iranian: 44 (0.6%)
Swedish: 32 (0.4%)
Romanian: 28 (0.4%)
Danish: 23 (0.3%)
Dutch: 21 (0.3%)
Croatian: 17 (0.2%)
Ethiopian: 13 (0.2%)
Scandinavian: 11 (0.1%)
Greek: 9 (0.1%)
Lithuanian: 7 (0.09%)
Luxembourger: 6 (0.08%)
Belgian: 5 (0.06%)
Egyptian: 4 (0.05%)
Russian: 3 (0.04%) Most common places of birth for foreign-born residents (%): Mexico Oak Grove:
25.5% (399)Oregon:
33.9% (140,109)
El Salvador Oak Grove:
15.9% (249)Oregon:
1.0% (4,175)
Honduras Oak Grove:
6.3% (99)Oregon:
0.3% (1,378)
Morocco Oak Grove:
6.3% (98)Oregon:
0.2% (713)
Ukraine Oak Grove:
5.4% (84)Oregon:
2.1% (8,469)
Canada Oak Grove:
5.0% (78)Oregon:
3.7% (15,229)
Philippines Oak Grove:
4.5% (71)Oregon:
3.5% (14,530)
Iran Oak Grove:
2.8% (44)Oregon:
1.0% (4,122)
United Kingdom, excluding England and Scotland Oak Grove:
2.8% (43)Oregon:
1.2% (5,082)
Peru Oak Grove:
2.7% (42)Oregon:
0.7% (2,927)
Hong Kong Oak Grove:
2.6% (41)Oregon:
0.6% (2,667)
Korea Oak Grove:
1.9% (30)Oregon:
2.8% (11,450)
India Oak Grove:
1.8% (28)Oregon:
4.7% (19,604)
Moldova Oak Grove:
1.7% (26)Oregon:
0.3% (1,379)
Place of birth for U.S.-born residents:
This state: 9,238Other state: 6,721Northeast: 642Midwest: 1,272South: 613West: 4,206 86.7% of Oak Grove residents lived in the same house 1 years ago.
Out of people who lived in different houses, 31.0% lived in this county.
Out of people who lived in different counties, 74.6% lived in Oregon.
Oak Grove:
86.7%State average:
85.5%
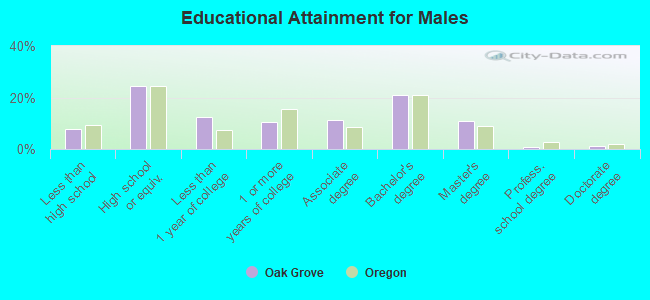
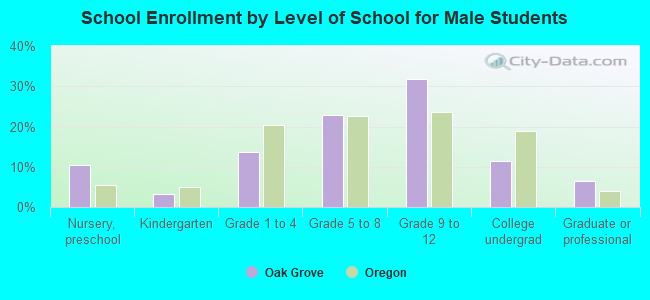
Education attainment for males 25 years and older:
No schooling: 135Nursery to 4th grade: 05th and 6th grade: 447th and 8th grade: 1029th grade: 6810th grade: 5711th grade: 1312th grade, no diploma: 101High school graduate (or equivalency): 1,646Less than 1 year of college: 841Some college more than 1 year, no degree: 693Associate degree: 742Bachelor's degree: 1,405Master's degree: 717Professional school degree: 65Doctorate degree: 68
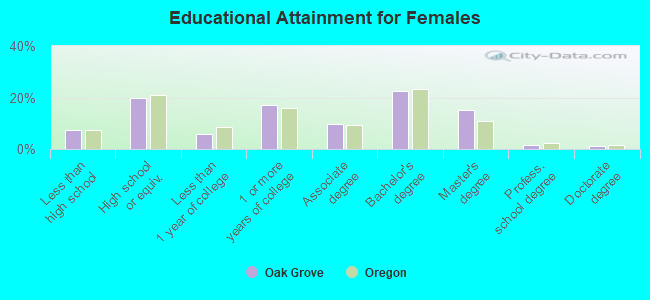
Education attainment for females 25 years and older:
No schooling: 0Nursery to 4th grade: 95th and 6th grade: 627th and 8th grade: 889th grade: 2310th grade: 20311th grade: 3912th grade, no diploma: 72High school graduate (or equivalency): 1,314Less than 1 year of college: 383Some college more than 1 year, no degree: 1,133Associate degree: 635Bachelor's degree: 1,502Master's degree: 1,004Professional school degree: 107Doctorate degree: 79
Housing units in structures:
One, detached: 5,065One, attached: 476Two: 1743 or 4: 1985 to 9: 32010 to 19: 21720 to 49: 39150 or more: 629Mobile homes: 322Boats, RVs, vans, etc.: 54Median worth of mobile homes: $67,350
Housing units lacking complete plumbing facilities in 2022: 0.8%Housing units lacking complete kitchen facilities in 2022: 2.3%House/condo owner moved in on average 14 years ago
Renter moved in on average 2 years ago
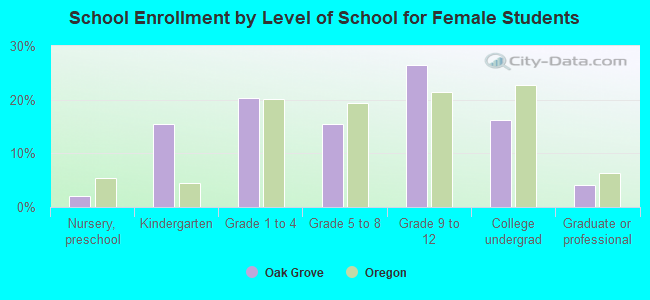
Private vs. public school enrollment:
Students in private schools in grades 1 to 8 (elementary and middle school): 106 Students in private schools in grades 9 to 12 (high school): 85 Students in private undergraduate colleges: 61