Oak Park, IL (Illinois) Houses and Residents
| Oak Park: | $452,049 |
| Illinois: | $251,600 |
Mean price in 2022:
Detached houses: $576,134
Here: $576,134 State: $310,164 Townhouses or other attached units: $358,496
Here: $358,496 State: $286,230 In 2-unit structures: $403,051
Here: $403,051 State: $299,638 In 3-to-4-unit structures: $231,140
Here: $231,140 State: $330,907 In 5-or-more-unit structures: $195,049
Here: $195,049 State: $318,887
Total population: 52,008 (All urban)
Houses: 24,813 (23,444 occupied: 14,191 owner occupied, 9,653 renter occupied)
| % of renters here: | 40% |
| State: | 33% |
Housing density: 5,278 houses/condos per square mile
Median price asked for vacant for-sale houses and condos in 2022: $212,177.
Median contract rent in 2022: $1,309 (lower quartile is $1,044, upper quartile is $1,893)
Median rent asked for vacant for-rent units in 2022: $1,584
Median gross rent in Oak Park, IL in 2022: $1,402
Housing units in Oak Park with a mortgage: 10,008 (1,132 second mortgage, 21 home equity loan, 1,008 both second mortgage and home equity loan)
Houses without a mortgage: 454
Median household income for houses/condos with a mortgage: $159,163
Median household income for apartments without a mortgage: $106,377
Median monthly housing costs: $1,847
Compare current foreclosures in Oak Park, IL:
| Photo | Address | Area | Beds / Baths | Price | Details |
|---|---|---|---|---|---|

|
#1
S Ridgeland Ave
Oak Park, IL 60302
|
2,400 sq. feet
|
3 baths 4 beds |
$625,000
|
show details |

|
#2
Washington Blvd Apt 1
Oak Park, IL 60302
|
- sq. feet
|
1 baths 2 beds |
$149,900
|
show details |

|
#3
N Harvey Ave
Oak Park, IL 60302
|
1,857 sq. feet
|
2 baths 3 beds |
show details | |

|
#4
N Lombard Ave
Oak Park, IL 60302
|
1,384 sq. feet
|
1 baths - beds |
show details | |

|
#5
S Humphrey Ave
Oak Park, IL 60302
|
2,688 sq. feet
|
2 baths - beds |
show details | |

|
#6
S Taylor Ave
Oak Park, IL 60304
|
1,014 sq. feet
|
1 baths - beds |
show details | |

|
#7
N Austin Blvd
Oak Park, IL 60302
|
1,024 sq. feet
|
1 baths - beds |
show details | |

|
#8
Augusta St
Oak Park, IL 60302
|
1,426 sq. feet
|
1 baths - beds |
show details | |

|
#9
N Ridgeland Ave
Oak Park, IL 60302
|
1,262 sq. feet
|
1 baths - beds |
show details | |

|
#10
N Harvey Ave
Oak Park, IL 60302
|
1,857 sq. feet
|
2 baths - beds |
show details |
| Photo | Address | Area | Beds / Baths | Price | Details |
|---|---|---|---|---|---|

|
#11
N Lombard Ave
Oak Park, IL 60302
|
1,364 sq. feet
|
2 baths - beds |
show details | |

|
#12
N Ridgeland Ave
Oak Park, IL 60302
|
1,016 sq. feet
|
1 baths - beds |
show details | |

|
#13
S Austin Blvd
Oak Park, IL 60304
|
3,095 sq. feet
|
4 baths - beds |
show details | |

|
#14
N Harvey Ave
Oak Park, IL 60302
|
2,035 sq. feet
|
2 baths - beds |
show details | |

|
#15
Chicago Ave
Oak Park, IL 60302
|
2,428 sq. feet
|
3 baths - beds |
show details | |

|
#16
N Humphrey Ave
Oak Park, IL 60302
|
1,356 sq. feet
|
1 baths - beds |
show details | |

|
#17
N Taylor Ave
Oak Park, IL 60302
|
960 sq. feet
|
1 baths - beds |
show details | |

|
#18
N Grove Ave
Oak Park, IL 60302
|
1,567 sq. feet
|
1 baths - beds |
show details | |

|
#19
S Ridgeland Ave
Oak Park, IL 60304
|
1,639 sq. feet
|
1 baths - beds |
show details | |

|
#20
N Taylor Ave
Oak Park, IL 60302
|
960 sq. feet
|
1 baths - beds |
show details |
| Photo | Address | Area | Beds / Baths | Price | Details |
|---|---|---|---|---|---|

|
#21
S Taylor Ave
Oak Park, IL 60304
|
940 sq. feet
|
3 baths - beds |
show details | |

|
#22
Chicago Ave Apt 205
Oak Park, IL 60302
|
- sq. feet
|
- baths - beds |
show details | |

|
#23
N Maple Ave Apt 3c
Oak Park, IL 60302
|
- sq. feet
|
- baths - beds |
show details | |

|
#24
Chicago Ave
Oak Park, IL 60302
|
- sq. feet
|
- baths - beds |
show details | |

|
#25
N Harlem Ave Apt 1221
Oak Park, IL 60301
|
- sq. feet
|
- baths - beds |
show details | |

|
#26
Westgate St # 418
Oak Park, IL 60301
|
- sq. feet
|
- baths - beds |
show details | |

|
#27
S Elmwood Ave
Oak Park, IL 60302
|
- sq. feet
|
- baths - beds |
show details | |

|
#28
Garfield St Apt 2s
Oak Park, IL 60304
|
- sq. feet
|
- baths - beds |
show details | |

|
#29
Home Ave
Oak Park, IL 60302
|
- sq. feet
|
- baths - beds |
show details | |

|
#30
S Maple Ave Apt 305
Oak Park, IL 60302
|
- sq. feet
|
- baths - beds |
show details |
| Photo | Address | Area | Beds / Baths | Price | Details |
|---|---|---|---|---|---|

|
#31
S Kenilworth Ave Apt G
Oak Park, IL 60302
|
- sq. feet
|
- baths - beds |
show details | |

|
#32
S Taylor Ave Apt 2a
Oak Park, IL 60302
|
- sq. feet
|
- baths - beds |
show details | |

|
#33
S Taylor Ave # 2
Oak Park, IL 60304
|
- sq. feet
|
- baths - beds |
show details | |

|
#34
S Harvey Ave Apt 3e
Oak Park, IL 60302
|
- sq. feet
|
- baths - beds |
show details | |

|
#35
North Ave
Oak Park, IL 60302
|
- sq. feet
|
- baths - beds |
show details | |

|
#36
Washington Blvd
Oak Park, IL 60302
|
- sq. feet
|
- baths - beds |
show details | |

|
#37
1/2 North Blvd, Apt 20
Oak Park, IL 60301
|
- sq. feet
|
- baths - beds |
show details | |

|
#38
S Austin Blvd Apt 3n
Oak Park, IL 60304
|
- sq. feet
|
- baths - beds |
show details | |

|
#39
Garfield St Apt 3
Oak Park, IL 60304
|
- sq. feet
|
- baths - beds |
show details | |

|
#40
S Elmwood Ave # 2
Oak Park, IL 60302
|
- sq. feet
|
- baths - beds |
show details |
| Photo | Address | Area | Beds / Baths | Price | Details |
|---|---|---|---|---|---|

|
#41
Washington Blvd Apt 2
Oak Park, IL 60302
|
- sq. feet
|
- baths - beds |
show details | |

|
#42
1/2 Madison St, Apt 2ne
Oak Park, IL 60302
|
- sq. feet
|
- baths - beds |
show details | |

|
#43
S Oak Park Ave Apt 109
Oak Park, IL 60302
|
- sq. feet
|
- baths - beds |
show details | |

|
#44
Lake St Apt 801
Oak Park, IL 60302
|
- sq. feet
|
- baths - beds |
show details | |

|
#45
Lake St Apt I2
Oak Park, IL 60302
|
- sq. feet
|
- baths - beds |
show details | |

|
#46
South Blvd # 615
Oak Park, IL 60302
|
- sq. feet
|
- baths - beds |
show details | |

|
#47
Washington Blvd Apt 3
Oak Park, IL 60302
|
- sq. feet
|
- baths - beds |
show details | |

|
#48
N Austin Blvd Apt 1
Oak Park, IL 60302
|
- sq. feet
|
- baths - beds |
show details | |

|
#49
S Taylor Ave # 1
Oak Park, IL 60302
|
- sq. feet
|
- baths - beds |
show details | |

|
Check over 1 million property listings on Foreclosure.com!
|
browse all offers | |||


 | Any Rental houses in Oak park or Forest park area (5 replies) |
| Oak Park homes under $300K? (75 replies) |
| Naperville, Oak Park... something else? (56 replies) |
| Break down Oak Park for me please (32 replies) |
| Other towns with housing similar to Oak Park. (19 replies) |
| Apartment/Condo listings in Oak Park/Forest Park (9 replies) |

Median year apartment built: 1959
Household type by relationship:
Households: 52,638- Male householders: 10,219 (3,154 living alone), Female householders: 12,606 (5,544 living alone)
9,792 spouses (9,660 opposite-sex spouses), 1,461 unmarried partners, (1,282 opposite-sex unmarried partners), 15,140 children (14,131 natural, 572 adopted, 435 stepchildren), 840 grandchildren, 276 brothers or sisters, 419 parents, 0 foster children, 219 other relatives, 1,196 non-relatives
- In group quarters: 464
Size of family households: 5,670 2-persons, 2,814 3-persons, 3,265 4-persons, 880 5-persons, 325 6-persons, 31 7-or-more-persons.
Size of nonfamily households: 9,344 1-person, 1,385 2-persons, 170 3-persons, 19 4-persons, 7 6-persons.
8,505 married couples with children.
2,402 single-parent households (581 men, 1,821 women).
86.1% of residents of Oak Park speak English at home.
6.3% of residents speak Spanish at home (83% speak English very well, 14% speak English well, 2% speak English not well, 1% don't speak English at all).
3.8% of residents speak other Indo-European language at home (81% speak English very well, 16% speak English well, 3% speak English not well).
2.9% of residents speak Asian or Pacific Island language at home (83% speak English very well, 11% speak English well, 6% speak English not well, 1% don't speak English at all).
0.6% of residents speak other language at home (89% speak English very well, 6% speak English well, 6% speak English not well).
Foreign born population: 4,395 (8.3%)
(69.3% of them are naturalized citizens)
| Here: | 6.9 |
| State: | 6.4 |
| Here: | 3.7 |
| State: | 4.1 |

- Bedrooms in owner-occupied houses and condos in Oak Park, Illinois
- 47no bedroom
- 1,2411 bedroom
- 3,1662 bedrooms
- 4,8573 bedrooms
- 3,3284 bedrooms
- 1,5535+ bedrooms

- Bedrooms in renter-occupied apartments in Oak Park, Illinois
- 1,018no bedroom
- 4,9161 bedroom
- 2,8802 bedrooms
- 6003 bedrooms
- 1144 bedrooms
- 1255+ bedrooms

- Cars and other vehicles available in Oak Park in owner-occupied houses/condos
- 572no vehicle
- 6,0081 vehicle
- 6,3932 vehicles
- 1,0383 vehicles
- 1214 vehicles
- 605+ vehicles

- Cars and other vehicles available in Oak Park in renter-occupied apartments
- 2,407no vehicle
- 5,8231 vehicle
- 1,2562 vehicles
- 913 vehicles
- 764 vehicles
- 05+ vehicles

- Rooms in owner-occupied houses in Oak Park, Illinois
- 371 room
- 1442 rooms
- 3573 rooms
- 1,3774 rooms
- 2,0085 rooms
- 2,1496 rooms
- 2,3817 rooms
- 1,8448 rooms
- 3,8959+ rooms

- Rooms in renter-occupied apartments in Oak Park, Illinois
- 7701 room
- 7852 rooms
- 2,5233 rooms
- 2,2934 rooms
- 1,8455 rooms
- 9266 rooms
- 2287 rooms
- 968 rooms
- 1879+ rooms


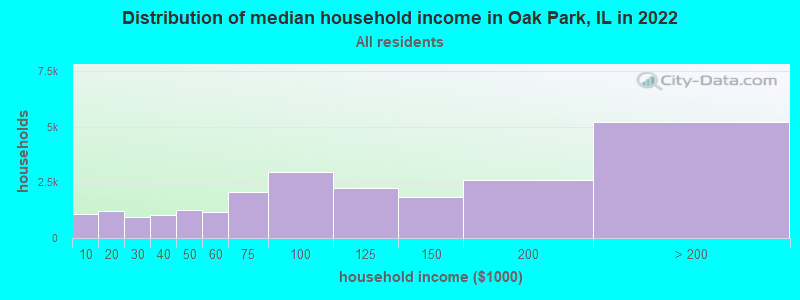
Oak Park, IL household income distribution

- 1,088Less than $10,000
- 1,212$10,000 to $19,999
- 950$20,000 to $29,999
- 1,037$30,000 to $39,999
- 1,239$40,000 to $49,999
- 1,182$50,000 to $59,999
- 2,082$60,000 to $74,999
- 2,976$75,000 to $99,999
- 2,266$100,000 to $124,999
- 1,845$125,000 to $149,999
- 2,631$150,000 to $199,999
- 5,219$200,000 or more
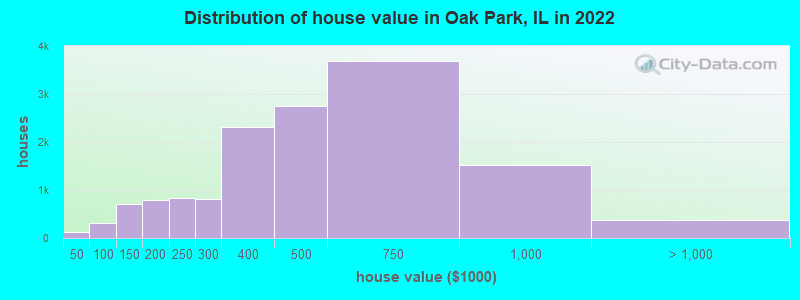
Home value of owner - occupied houses in 2022 in Oak Park, IL
-
- 28Less than $10,000
- 10$10,000 to $14,999
- 36$30,000 to $34,999
- 52$35,000 to $39,999
- 16$50,000 to $59,999
- 27$60,000 to $69,999
- 95$70,000 to $79,999
- 93$80,000 to $89,999
- 88$90,000 to $99,999
- 299$100,000 to $124,999
- 405$125,000 to $149,999
- 372$150,000 to $174,999
- 428$175,000 to $199,999
- 840$200,000 to $249,999
- 804$250,000 to $299,999
- 2,317$300,000 to $399,999
- 2,759$400,000 to $499,999
- 3,687$500,000 to $749,999
- 1,511$750,000 to $999,999
- 237$1,000,000 to $1,499,999
- 57$1,500,000 to $1,999,999
- 74$2,000,000 or more
Rent paid by renters in 2022 in Oak Park, IL
-
- 59Less than $100
- 15$100 to $149
- 52$150 to $199
- 137$200 to $249
- 34$250 to $299
- 51$300 to $349
- 102$350 to $399
- 159$400 to $449
- 82$450 to $499
- 62$500 to $549
- 14$550 to $599
- 25$600 to $649
- 100$700 to $749
- 160$750 to $799
- 305$800 to $899
- 511$900 to $999
- 2,401$1,000 to $1,249
- 1,620$1,250 to $1,499
- 1,488$1,500 to $1,999
- 907$2,000 to $2,499
- 459$2,500 to $2,999
- 296$3,000 to $3,499
- 313$3,500 or more
- 168No cash rent

Percentage of workers working in this county: 90.6%
Number of people working at home: 8,586 (30.6% of all workers)
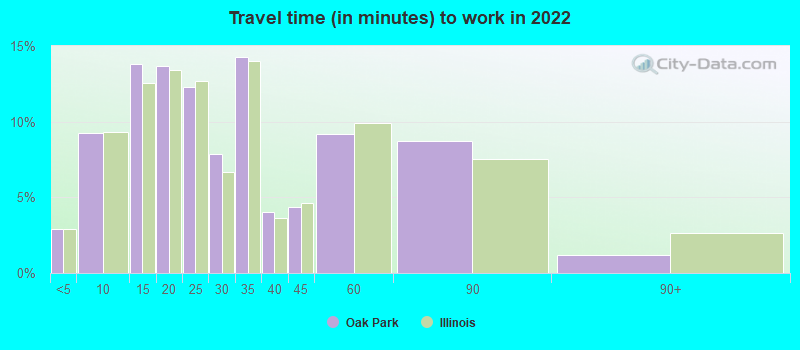
Travel time to work (commute)
- Less than 5 minutes: 466
- 5 to 9 minutes: 1,219
- 10 to 14 minutes: 1,879
- 15 to 19 minutes: 1,276
- 20 to 24 minutes: 2,129
- 25 to 29 minutes: 1,184
- 30 to 34 minutes: 3,308
- 35 to 39 minutes: 1,079
- 40 to 44 minutes: 1,667
- 45 to 59 minutes: 3,998
- 60 to 89 minutes: 1,790
- 90 or more minutes: 316
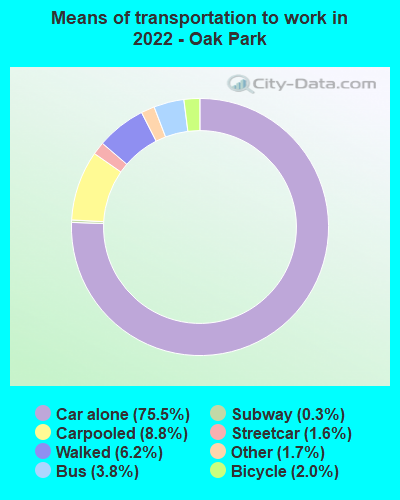
Means of transportation to work:
- Drove a car alone: 11,845 (52.7%)
- Carpooled: 1,486 (6.6%)
- Bus: 556 (2.5%)
- Subway or elevated rail: 190 (0.8%)
- Long-distance train or commuter rail: 31 (0.1%)
- Taxi: 274 (1.2%)
- Bicycle: 329 (1.5%)
- Walked: 1,006 (4.5%)
- Worked at home: 8,586 (38.2%)
- Unemployment by race in 2022
- Unemployment rate for White non-Hispanic residents
- 2.6%Males
- 2.7%Females
- Unemployment rate for Black residents
- 7.3%Males
- 9.5%Females
- Unemployment rate for Asian residents
- 4.1%Females
- Unemployment rate for other race residents
- 5.0%Females
- Unemployment rate for two or more race residents
- 3.5%Males
- 2.1%Females
- Unemployment rate for Hispanic or Latino residents
- 4.7%Males
- 2.1%Females

- Year of entry for the foreign-born population in Oak Park, Illinois
- 1,3432010 or later
- 6432000 to 2009
- 9361990 to 1999
- 8681980 to 1989
- 8761970 to 1979
- 983Before 1970

First ancestries reported:
- Irish: 1,874 (8.4%)
- German: 1,513 (6.8%)
- European: 1,012 (4.5%)
- Polish: 843 (3.8%)
- Italian: 793 (3.6%)
- American: 771 (3.5%)
- English: 585 (2.6%)
- Dutch: 222 (1.0%)
- African: 207 (0.9%)
- Swedish: 196 (0.9%)
- Russian: 192 (0.9%)
- Iranian: 143 (0.6%)
- Eastern European: 142 (0.6%)
- Czech: 136 (0.6%)
- Scandinavian: 122 (0.5%)
- Norwegian: 119 (0.5%)
- British: 103 (0.5%)
- Greek: 98 (0.4%)
- Latvian: 97 (0.4%)
- Jamaican: 97 (0.4%)
- Lithuanian: 89 (0.4%)
- Scotch-Irish: 81 (0.4%)
- Armenian: 81 (0.4%)
- Romanian: 70 (0.3%)
- Swiss: 68 (0.3%)
- Welsh: 67 (0.3%)
- Ukrainian: 62 (0.3%)
- Serbian: 54 (0.2%)
- Nigerian: 54 (0.2%)
- Slovak: 47 (0.2%)
- Scottish: 46 (0.2%)
- Palestinian: 42 (0.2%)
- Brazilian: 42 (0.2%)
- Northern European: 40 (0.2%)
- Hungarian: 38 (0.2%)
- Turkish: 37 (0.2%)
- Cape Verdean: 37 (0.2%)
- French: 27 (0.1%)
- Haitian: 26 (0.1%)
- Canadian: 25 (0.1%)
- Danish: 24 (0.1%)
- French Canadian: 23 (0.1%)
- Slavic: 21 (0.09%)
- Albanian: 21 (0.09%)
- Israeli: 19 (0.09%)
- Cajun: 15 (0.07%)
- Barbadian: 14 (0.06%)
- Egyptian: 13 (0.06%)
- Ghanaian: 13 (0.06%)
- Belgian: 11 (0.05%)
- Austrian: 9 (0.04%)
- Estonian: 8 (0.04%)
- Assyrian: 7 (0.03%)
- Lebanese: 6 (0.03%)
- Finnish: 6 (0.03%)
- Moroccan: 6 (0.03%)
- Bulgarian: 5 (0.02%)
- Portuguese: 3 (0.01%)
Most common places of birth for foreign-born residents (%):
| Oak Park: | 11.0% (485) |
| Illinois: | 34.7% (626,958) |
| Oak Park: | 10.2% (450) |
| Illinois: | 5.2% (93,003) |
| Oak Park: | 8.5% (372) |
| Illinois: | 9.2% (166,409) |
| Oak Park: | 5.5% (241) |
| Illinois: | 1.0% (18,753) |
| Oak Park: | 5.0% (221) |
| Illinois: | 2.2% (40,393) |
| Oak Park: | 4.0% (175) |
| Illinois: | 0.9% (16,553) |
| Oak Park: | 3.8% (165) |
| Illinois: | 6.9% (124,474) |
| Oak Park: | 3.6% (157) |
| Illinois: | 4.1% (74,364) |
| Oak Park: | 2.5% (110) |
| Illinois: | 0.6% (10,943) |
| Oak Park: | 2.3% (99) |
| Illinois: | 0.4% (6,922) |
| Oak Park: | 2.2% (96) |
| Illinois: | 0.9% (15,679) |
| Oak Park: | 2.2% (95) |
| Illinois: | 0.5% (8,778) |
| Oak Park: | 2.2% (95) |
| Illinois: | 0.0% (670) |
| Oak Park: | 2.1% (91) |
| Illinois: | 0.2% (3,231) |
| Oak Park: | 2.0% (86) |
| Illinois: | 0.2% (2,988) |
| Oak Park: | 1.9% (82) |
| Illinois: | 1.3% (22,793) |
| Oak Park: | 1.6% (70) |
| Illinois: | 0.5% (9,671) |
| Oak Park: | 1.5% (68) |
| Illinois: | 1.6% (29,519) |
Place of birth for U.S.-born residents:
- This state: 31,604
- Other state: 15,882
- Northeast: 3,241
- Midwest: 6,912
- South: 3,880
- West: 1,944
86.1% of Oak Park residents lived in the same house 1 years ago.
Out of people who lived in different houses, 41.2% lived in this county.
Out of people who lived in different counties, 40.4% lived in Illinois.
| Oak Park: | 86.1% |
| State average: | 88.3% |
Education attainment for males 25 years and older:
- No schooling: 47
- Nursery to 4th grade: 30
- 5th and 6th grade: 0
- 7th and 8th grade: 70
- 9th grade: 76
- 10th grade: 77
- 11th grade: 29
- 12th grade, no diploma: 123
- High school graduate (or equivalency): 1,427
- Less than 1 year of college: 520
- Some college more than 1 year, no degree: 1,368
- Associate degree: 859
- Bachelor's degree: 5,697
- Master's degree: 3,890
- Professional school degree: 1,439
- Doctorate degree: 1,279

Education attainment for females 25 years and older:
- No schooling: 91
- Nursery to 4th grade: 14
- 5th and 6th grade: 50
- 7th and 8th grade: 141
- 9th grade: 10
- 10th grade: 22
- 11th grade: 127
- 12th grade, no diploma: 131
- High school graduate (or equivalency): 1,636
- Less than 1 year of college: 499
- Some college more than 1 year, no degree: 1,929
- Associate degree: 990
- Bachelor's degree: 6,988
- Master's degree: 6,241
- Professional school degree: 1,300
- Doctorate degree: 830


Housing units in structures:
- One, detached: 10,069
- One, attached: 830
- Two: 1,463
- 3 or 4: 934
- 5 to 9: 2,722
- 10 to 19: 2,371
- 20 to 49: 3,360
- 50 or more: 3,060
Housing units lacking complete kitchen facilities in 2022: 1.3%
House/condo owner moved in on average 11 years ago
Renter moved in on average 1 years ago

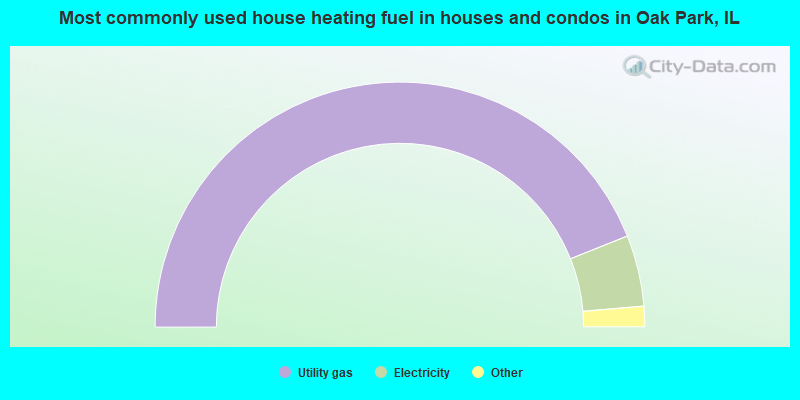
- 87.9%Utility gas
- 9.4%Electricity
- 1.0%Other fuel
- 0.9%Bottled, tank, or LP gas
- 0.7%No fuel used
- 0.1%Fuel oil, kerosene, etc.
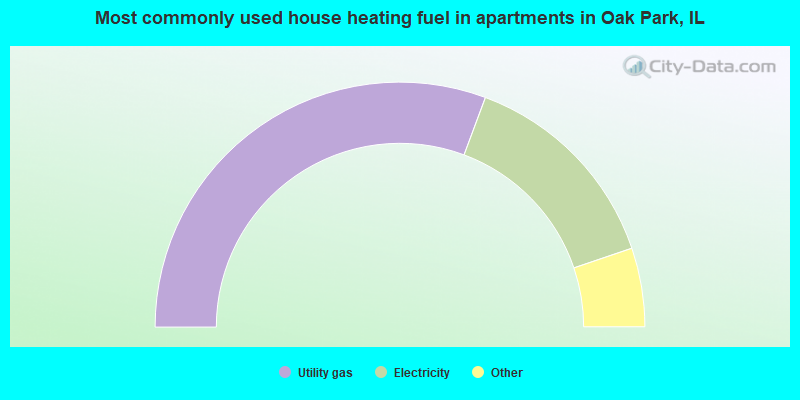
- 61.3%Utility gas
- 28.2%Electricity
- 3.7%Other fuel
- 3.3%Bottled, tank, or LP gas
- 2.8%No fuel used
- 0.5%Fuel oil, kerosene, etc.
- 0.1%Solar energy
Private vs. public school enrollment:
| Here: | 11.6% |
| Illinois: | 13.3% |
| Here: | 5.5% |
| Illinois: | 9.9% |
| Here: | 37.2% |
| Illinois: | 27.4% |


