Oakdale, CA (California) Houses and Residents
| Oakdale: | $468,462 |
| California: | $715,900 |
Mean price in 2022:
Detached houses: $452,038
Here: $452,038 State: $988,808 Townhouses or other attached units: $277,828
Here: $277,828 State: $838,546 Mobile homes: $107,489
Here: $107,489 State: $184,506
Total population: 21,854 (Urban population: 15,602 (all inside urban clusters), Rural population: 48 (all nonfarm))
Houses: 8,705 (8,354 occupied: 5,307 owner occupied, 3,049 renter occupied)
| % of renters here: | 36% |
| State: | 44% |
Housing density: 1,732 houses/condos per square mile
Median price asked for vacant for-sale houses and condos in 2022 in this county: $516,748.
Median contract rent in 2022: $1,155 (lower quartile is $841, upper quartile is $1,666)
Median rent asked for vacant for-rent units in 2022: $1,556
Median gross rent in Oakdale, CA in 2022: $1,395
Housing units in Oakdale with a mortgage: 3,549 (117 second mortgage, 0 home equity loan, 149 both second mortgage and home equity loan)
Houses without a mortgage: 52
Median household income for houses/condos with a mortgage: $120,574
Median household income for apartments without a mortgage: $86,946
Median monthly housing costs: $1,499
Compare current foreclosures in Oakdale, CA:
| Photo | Address | Area | Beds / Baths | Price | Details |
|---|---|---|---|---|---|

|
#1
Hinkley Ave
Oakdale, CA 95361
|
1,318 sq. feet
|
1 baths 2 beds |
show details | |

|
#2
Allen St
Oakdale, CA 95361
|
844 sq. feet
|
1 baths 2 beds |
show details | |

|
#3
Tori Way
Oakdale, CA 95361
|
2,606 sq. feet
|
2 baths 3 beds |
show details | |

|
#4
Magnolia St
Oakdale, CA 95361
|
2,247 sq. feet
|
2 baths 3 beds |
show details | |

|
#5
Grand Oak Way
Oakdale, CA 95361
|
3,262 sq. feet
|
3 baths 5 beds |
show details | |

|
#6
River Bluff Dr
Oakdale, CA 95361
|
1,682 sq. feet
|
2 baths 3 beds |
show details | |

|
#7
Brett Ave
Oakdale, CA 95361
|
1,345 sq. feet
|
2 baths 3 beds |
show details | |

|
#8
Eucalyptus Ave
Oakdale, CA 95361
|
1,892 sq. feet
|
2 baths 3 beds |
show details | |

|
#9
Celia Ct
Oakdale, CA 95361
|
1,980 sq. feet
|
3 baths 4 beds |
show details | |

|
#10
Reynolds Ave
Oakdale, CA 95361
|
1,120 sq. feet
|
2 baths 3 beds |
show details |
| Photo | Address | Area | Beds / Baths | Price | Details |
|---|---|---|---|---|---|

|
#11
Cindy Dr
Oakdale, CA 95361
|
2,171 sq. feet
|
2 baths 3 beds |
show details | |

|
#12
W H St
Oakdale, CA 95361
|
1,560 sq. feet
|
2 baths 3 beds |
show details | |

|
#13
Crow Creek Dr
Oakdale, CA 95361
|
1,556 sq. feet
|
2 baths 3 beds |
show details | |

|
#14
Hudson Ave
Oakdale, CA 95361
|
3,990 sq. feet
|
3 baths 4 beds |
show details | |

|
#15
Esther Ct
Oakdale, CA 95361
|
2,171 sq. feet
|
2 baths 4 beds |
show details | |

|
#16
Magnolia St
Oakdale, CA 95361
|
1,956 sq. feet
|
2 baths 4 beds |
show details | |

|
#17
Webster Rd
Oakdale, CA 95361
|
- sq. feet
|
2 baths 3 beds |
show details | |

|
#18
N 5th Ave
Oakdale, CA 95361
|
- sq. feet
|
4 baths 5 beds |
show details | |

|
#19
Crow Rd
Oakdale, CA 95361
|
- sq. feet
|
2 baths 3 beds |
show details | |

|
#20
Peach Blossom Ln
Oakdale, CA 95361
|
- sq. feet
|
4 baths 4 beds |
show details |
| Photo | Address | Area | Beds / Baths | Price | Details |
|---|---|---|---|---|---|

|
#21
Morrison Rd
Oakdale, CA 95361
|
- sq. feet
|
2 baths 3 beds |
show details | |

|
#22
E F St, Bldg A Pmb 102
Oakdale, CA 95361
|
- sq. feet
|
- baths - beds |
show details | |

|
#23
Valley Home Rd
Oakdale, CA 95361
|
- sq. feet
|
- baths - beds |
show details | |

|
#24
E J St # 2
Oakdale, CA 95361
|
- sq. feet
|
- baths - beds |
show details | |

|
#25
N Yosemite Ave
Oakdale, CA 95361
|
- sq. feet
|
- baths - beds |
show details | |

|
#26
E E St Apt 23
Oakdale, CA 95361
|
- sq. feet
|
- baths - beds |
show details | |

|
#27
Davitt Ave
Oakdale, CA 95361
|
- sq. feet
|
- baths - beds |
show details | |

|
#28
E F St, Bldg A Pmb 102
Oakdale, CA 95361
|
- sq. feet
|
- baths - beds |
show details | |

|
#29
E C St
Oakdale, CA 95361
|
- sq. feet
|
- baths - beds |
show details | |

|
#30
26 Mile Rd, Spc 36
Oakdale, CA 95361
|
- sq. feet
|
- baths - beds |
show details |
| Photo | Address | Area | Beds / Baths | Price | Details |
|---|---|---|---|---|---|

|
#31
N 4th Ave
Oakdale, CA 95361
|
- sq. feet
|
- baths - beds |
show details | |

|
#32
W G St
Oakdale, CA 95361
|
- sq. feet
|
- baths - beds |
show details | |

|
#33
Churchill Downs Cir
Oakdale, CA 95361
|
- sq. feet
|
- baths - beds |
show details | |

|
#34
Goldsborough Cir
Oakdale, CA 95361
|
- sq. feet
|
- baths - beds |
show details | |

|
#35
Greger St
Oakdale, CA 95361
|
- sq. feet
|
- baths - beds |
show details | |

|
Check over 1 million property listings on Foreclosure.com!
|
browse all offers | |||

Latest news about housing in Oakdale, CA collected exclusively by city-data.com from local newspapers, TV, and radio stations


Median year apartment built: 1985
Household type by relationship:
Households: 23,086- Male householders: 3,833 (811 living alone), Female householders: 4,447 (1,231 living alone)
4,240 spouses (4,215 opposite-sex spouses), 427 unmarried partners, (416 opposite-sex unmarried partners), 7,901 children (7,474 natural, 29 adopted, 397 stepchildren), 689 grandchildren, 186 brothers or sisters, 199 parents, 9 foster children, 333 other relatives, 601 non-relatives
- In group quarters: 215
Size of family households: 2,475 2-persons, 1,271 3-persons, 1,010 4-persons, 683 5-persons, 451 6-persons, 98 7-or-more-persons.
Size of nonfamily households: 2,036 1-person, 251 2-persons, 29 3-persons.
4,436 married couples with children.
924 single-parent households (356 men, 568 women).
80.5% of residents of Oakdale speak English at home.
16.7% of residents speak Spanish at home (55% speak English very well, 12% speak English well, 24% speak English not well, 9% don't speak English at all).
2.1% of residents speak other Indo-European language at home (99% speak English very well, 1% don't speak English at all).
0.5% of residents speak Asian or Pacific Island language at home (72% speak English very well, 28% speak English not well).
Foreign born population: 2,495 (10.8%)
(43.7% of them are naturalized citizens)
| Here: | 6.3 |
| State: | 6.0 |
| Here: | 4.3 |
| State: | 3.9 |

- Bedrooms in owner-occupied houses and condos in Oakdale, California
- 0no bedroom
- 381 bedroom
- 6982 bedrooms
- 2,4513 bedrooms
- 1,7424 bedrooms
- 3785+ bedrooms

- Bedrooms in renter-occupied apartments in Oakdale, California
- 51no bedroom
- 9461 bedroom
- 9612 bedrooms
- 8023 bedrooms
- 2884 bedrooms
- 05+ bedrooms

- Cars and other vehicles available in Oakdale in owner-occupied houses/condos
- 105no vehicle
- 1,1181 vehicle
- 2,1172 vehicles
- 1,2193 vehicles
- 5174 vehicles
- 2325+ vehicles

- Cars and other vehicles available in Oakdale in renter-occupied apartments
- 591no vehicle
- 1,1881 vehicle
- 8632 vehicles
- 3593 vehicles
- 354 vehicles
- 145+ vehicles

- Rooms in owner-occupied houses in Oakdale, California
- 01 room
- 382 rooms
- 773 rooms
- 3314 rooms
- 1,5355 rooms
- 9466 rooms
- 8797 rooms
- 5248 rooms
- 9789+ rooms

- Rooms in renter-occupied apartments in Oakdale, California
- 511 room
- 1342 rooms
- 6003 rooms
- 9514 rooms
- 4945 rooms
- 4936 rooms
- 2267 rooms
- 538 rooms
- 479+ rooms


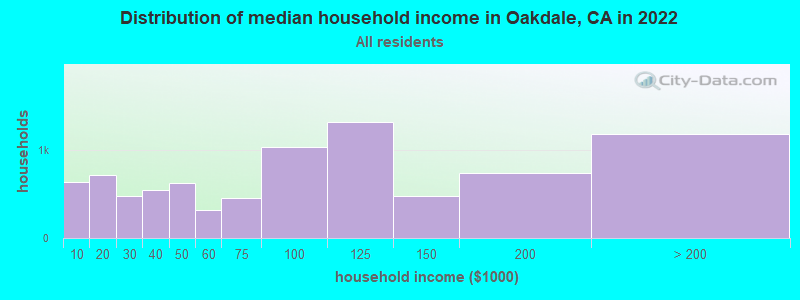
Oakdale, CA household income distribution

- 640Less than $10,000
- 719$10,000 to $19,999
- 476$20,000 to $29,999
- 544$30,000 to $39,999
- 629$40,000 to $49,999
- 323$50,000 to $59,999
- 449$60,000 to $74,999
- 1,032$75,000 to $99,999
- 1,318$100,000 to $124,999
- 472$125,000 to $149,999
- 733$150,000 to $199,999
- 1,176$200,000 or more
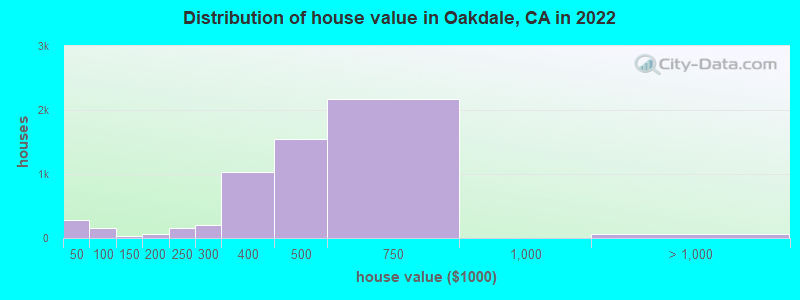
Home value of owner - occupied houses in 2022 in Oakdale, CA
-
- 132Less than $10,000
- 39$10,000 to $14,999
- 9$30,000 to $34,999
- 27$35,000 to $39,999
- 76$40,000 to $49,999
- 11$50,000 to $59,999
- 67$80,000 to $89,999
- 29$125,000 to $149,999
- 52$150,000 to $174,999
- 4$175,000 to $199,999
- 151$200,000 to $249,999
- 197$250,000 to $299,999
- 1,024$300,000 to $399,999
- 1,551$400,000 to $499,999
- 2,175$500,000 to $749,999
- 5$750,000 to $999,999
- 62$1,000,000 to $1,499,999
Rent paid by renters in 2022 in Oakdale, CA
-
- 13Less than $100
- 110$100 to $149
- 22$150 to $199
- 16$200 to $249
- 20$250 to $299
- 25$300 to $349
- 105$350 to $399
- 51$500 to $549
- 149$600 to $649
- 121$650 to $699
- 38$700 to $749
- 57$750 to $799
- 121$800 to $899
- 250$900 to $999
- 608$1,000 to $1,249
- 212$1,250 to $1,499
- 739$1,500 to $1,999
- 189$2,000 to $2,499
- 8$3,500 or more
- 146No cash rent


Percentage of workers working in this county: 74.1%
Number of people working at home: 417 (4.1% of all workers)
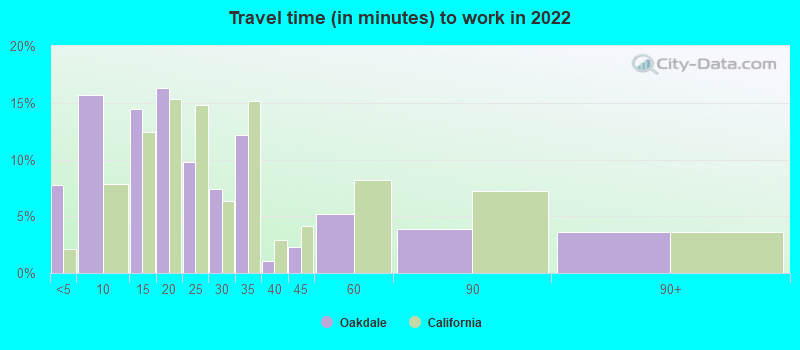
Travel time to work (commute)
- Less than 5 minutes: 880
- 5 to 9 minutes: 1,570
- 10 to 14 minutes: 891
- 15 to 19 minutes: 590
- 20 to 24 minutes: 670
- 25 to 29 minutes: 712
- 30 to 34 minutes: 1,209
- 35 to 39 minutes: 179
- 40 to 44 minutes: 356
- 45 to 59 minutes: 1,330
- 60 to 89 minutes: 397
- 90 or more minutes: 1,026
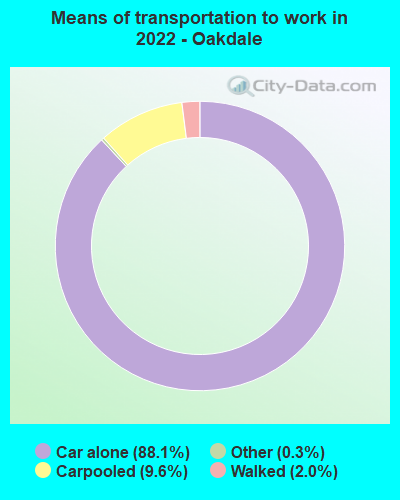
Means of transportation to work:
- Drove a car alone: 7,363 (81.6%)
- Carpooled: 968 (10.7%)
- Taxi: 24 (0.3%)
- Walked: 223 (2.5%)
- Worked at home: 417 (4.6%)

- Unemployment by race in 2022
- Unemployment rate for White non-Hispanic residents
- 6.3%Males
- 1.5%Females
- Unemployment rate for Asian residents
- 68.4%Males
- 6.6%Females
- Unemployment rate for other race residents
- 3.2%Males
- 12.3%Females
- Unemployment rate for two or more race residents
- 19.8%Males
- 3.2%Females
- Unemployment rate for Hispanic or Latino residents
- 16.0%Males
- 7.2%Females

- Year of entry for the foreign-born population in Oakdale, California
- 2562010 or later
- 6662000 to 2009
- 5571990 to 1999
- 4391980 to 1989
- 4551970 to 1979
- 229Before 1970

First ancestries reported:
- American: 961 (9.2%)
- Italian: 540 (5.2%)
- European: 535 (5.1%)
- Irish: 519 (5.0%)
- English: 387 (3.7%)
- German: 366 (3.5%)
- Portuguese: 215 (2.1%)
- Iranian: 177 (1.7%)
- Norwegian: 141 (1.4%)
- Scottish: 74 (0.7%)
- Scotch-Irish: 68 (0.7%)
- British: 64 (0.6%)
- Swiss: 59 (0.6%)
- Scandinavian: 45 (0.4%)
- Dutch: 39 (0.4%)
- Czechoslovakian: 25 (0.2%)
- Ethiopian: 19 (0.2%)
- Canadian: 18 (0.2%)
- Basque: 16 (0.2%)
- French Canadian: 15 (0.1%)
- Swedish: 15 (0.1%)
- Ukrainian: 13 (0.1%)
- Egyptian: 11 (0.1%)
- Hungarian: 11 (0.1%)
- Russian: 11 (0.1%)
- Danish: 9 (0.09%)
Most common places of birth for foreign-born residents (%):
| Oakdale: | 69.6% (1,679) |
| California: | 37.2% (3,881,193) |
| Oakdale: | 5.2% (126) |
| California: | 2.8% (290,436) |
| Oakdale: | 3.6% (87) |
| California: | 0.6% (57,953) |
| Oakdale: | 3.4% (81) |
| California: | 7.8% (818,297) |
| Oakdale: | 2.6% (63) |
| California: | 0.2% (24,635) |
| Oakdale: | 1.9% (45) |
| California: | 6.6% (684,672) |
Place of birth for U.S.-born residents:
- This state: 16,903
- Other state: 3,261
- Northeast: 187
- Midwest: 902
- South: 979
- West: 1,231
88.3% of Oakdale residents lived in the same house 1 years ago.
Out of people who lived in different houses, 38.1% lived in this county.
Out of people who lived in different counties, 92.7% lived in California.
| Oakdale: | 88.3% |
| State average: | 88.9% |
Education attainment for males 25 years and older:
- No schooling: 116
- Nursery to 4th grade: 11
- 5th and 6th grade: 204
- 7th and 8th grade: 73
- 9th grade: 16
- 10th grade: 31
- 11th grade: 226
- 12th grade, no diploma: 233
- High school graduate (or equivalency): 1,921
- Less than 1 year of college: 548
- Some college more than 1 year, no degree: 1,285
- Associate degree: 761
- Bachelor's degree: 1,204
- Master's degree: 329
- Professional school degree: 84
- Doctorate degree: 17

Education attainment for females 25 years and older:
- No schooling: 127
- Nursery to 4th grade: 45
- 5th and 6th grade: 115
- 7th and 8th grade: 114
- 9th grade: 193
- 10th grade: 65
- 11th grade: 120
- 12th grade, no diploma: 330
- High school graduate (or equivalency): 1,992
- Less than 1 year of college: 664
- Some college more than 1 year, no degree: 1,497
- Associate degree: 764
- Bachelor's degree: 804
- Master's degree: 338
- Professional school degree: 385
- Doctorate degree: 40


Housing units in structures:
- One, detached: 6,529
- One, attached: 223
- Two: 143
- 3 or 4: 220
- 5 to 9: 106
- 10 to 19: 167
- 20 to 49: 185
- 50 or more: 653
- Mobile homes: 475
Housing units lacking complete kitchen facilities in 2022: 2.2%
House/condo owner moved in on average 9 years ago
Renter moved in on average 3 years ago

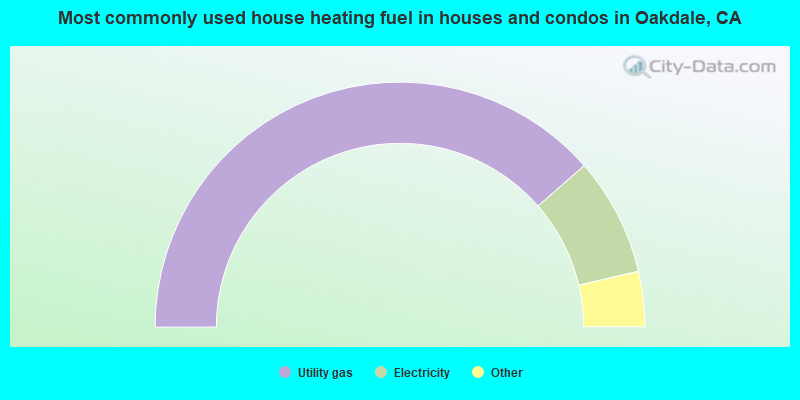
- 77.1%Utility gas
- 15.6%Electricity
- 3.8%Wood
- 2.4%Bottled, tank, or LP gas
- 0.8%No fuel used
- 0.2%Solar energy
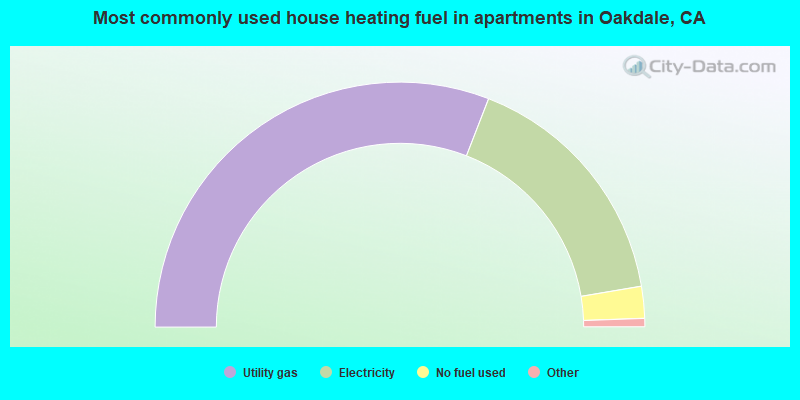
- 61.8%Utility gas
- 32.9%Electricity
- 4.2%No fuel used
- 0.7%Solar energy
- 0.4%Wood
Private vs. public school enrollment:
| Here: | 17.0% |
| California: | 10.5% |
| Here: | 2.7% |
| California: | 8.5% |
| Here: | 4.9% |
| California: | 15.9% |


