Oakwood, IL (Illinois) Houses and Residents
| Oakwood: | $106,880 |
| Illinois: | $251,600 |
Total population: 1,542 (Urban population: 0, Rural population: 1,516 (all nonfarm))
Houses: 646 (573 occupied: 489 owner occupied, 107 renter occupied)
| % of renters here: | 18% |
| State: | 33% |
Housing density: 718 houses/condos per square mile
Median price asked for vacant for-sale houses and condos in 2022: $47,342.
Median contract rent in 2022: $495 (lower quartile is $360, upper quartile is $661)
Median rent asked for vacant for-rent units in 2022: $363
Median gross rent in Oakwood, IL in 2022: $693
Housing units in Oakwood with a mortgage: 205 (4 second mortgage, 0 home equity loan, 5 both second mortgage and home equity loan)
Houses without a mortgage: 0
Median household income for houses/condos with a mortgage: $76,028
Median household income for apartments without a mortgage: $45,752
Median monthly housing costs: $742
Compare current foreclosures near Oakwood, IL:
| Photo | Address | Area | Beds / Baths | Price | Details |
|---|---|---|---|---|---|

|
#1
N Franklin St
Danville, IL 61832
|
900 sq. feet
|
1 baths 2 beds |
$26,900
|
show details |

|
#2
N 780 East Rd
Oakwood, IL 61858
|
- sq. feet
|
- baths - beds |
show details | |

|
#3
Falcon Crest Dr
Oakwood, IL 61858
|
- sq. feet
|
- baths - beds |
show details | |

|
#4
E 1815 North Rd
Oakwood, IL 61858
|
- sq. feet
|
- baths - beds |
show details | |

|
#5
Elmwood Ave
Danville, IL 61832
|
- sq. feet
|
1 baths 3 beds |
$14,900
|
show details |

|
#6
N Vermilion Ave
Allerton, IL 61810
|
1,560 sq. feet
|
2 baths 3 beds |
show details | |

|
#7
E Fairchild St
Danville, IL 61832
|
- sq. feet
|
- baths - beds |
$12,900
|
show details |

|
#8
Timberline Dr
Danville, IL 61832
|
- sq. feet
|
1 baths 3 beds |
show details | |

|
#9
Illinois Ave
Westville, IL 61883
|
- sq. feet
|
1 baths 2 beds |
show details | |

|
#10
Meadowlane Dr
Catlin, IL 61817
|
- sq. feet
|
- baths - beds |
show details |
| Photo | Address | Area | Beds / Baths | Price | Details |
|---|---|---|---|---|---|

|
#11
Johnson St
Danville, IL 61832
|
- sq. feet
|
- baths - beds |
show details | |

|
#12
Mill Rd
Georgetown, IL 61846
|
- sq. feet
|
- baths - beds |
show details | |

|
#13
W Voorhees St
Danville, IL 61832
|
- sq. feet
|
- baths - beds |
show details | |

|
#14
W Lincoln Ave
Ogden, IL 61859
|
- sq. feet
|
- baths - beds |
show details | |

|
#15
N Vermilion St Apt 405
Danville, IL 61832
|
- sq. feet
|
- baths - beds |
show details | |

|
#16
E N 3rd St Apt 4
Georgetown, IL 61846
|
- sq. feet
|
- baths - beds |
show details | |

|
#17
E 14th St Trlr 11
Danville, IL 61832
|
- sq. feet
|
- baths - beds |
show details | |

|
#18
County Road 1900 N
Saint Joseph, IL 61873
|
- sq. feet
|
- baths - beds |
show details | |

|
#19
E 9th St
Georgetown, IL 61846
|
- sq. feet
|
- baths - beds |
show details | |

|
#20
Westwood Dr
Catlin, IL 61817
|
- sq. feet
|
- baths - beds |
show details |
| Photo | Address | Area | Beds / Baths | Price | Details |
|---|---|---|---|---|---|

|
#21
N West St
Homer, IL 61849
|
- sq. feet
|
- baths - beds |
show details | |

|
#22
Sunset Rdg
Danville, IL 61832
|
- sq. feet
|
- baths - beds |
show details | |

|
#23
W Center St
Catlin, IL 61817
|
- sq. feet
|
- baths - beds |
show details | |

|
#24
Griggs St
Danville, IL 61832
|
- sq. feet
|
- baths - beds |
show details | |

|
#25
Willow St
Ogden, IL 61859
|
- sq. feet
|
- baths - beds |
show details | |

|
#26
Shasta Dr
Danville, IL 61832
|
- sq. feet
|
- baths - beds |
show details | |

|
#27
E Lincoln Ave
Ogden, IL 61859
|
- sq. feet
|
- baths - beds |
show details | |

|
#28
Oak St
Danville, IL 61832
|
- sq. feet
|
- baths - beds |
show details | |

|
#29
N Walnut St
Danville, IL 61832
|
- sq. feet
|
- baths - beds |
show details | |

|
#30
Oak St # 9
Danville, IL 61832
|
- sq. feet
|
- baths - beds |
show details |
| Photo | Address | Area | Beds / Baths | Price | Details |
|---|---|---|---|---|---|

|
#31
S Washington St Apt F
Tilton, IL 61833
|
- sq. feet
|
- baths - beds |
show details | |

|
#32
Locust St
Alvin, IL 61811
|
- sq. feet
|
- baths - beds |
show details | |

|
#33
N Vermilion Ave
Allerton, IL 61810
|
- sq. feet
|
- baths - beds |
show details | |

|
#34
E 5th St
Tilton, IL 61833
|
- sq. feet
|
- baths - beds |
show details | |

|
#35
E 2750 North Rd
Danville, IL 61834
|
- sq. feet
|
- baths - beds |
show details | |

|
#36
E Woodland Dr
Saint Joseph, IL 61873
|
- sq. feet
|
- baths - beds |
show details | |

|
#37
County Road 2200 E
Saint Joseph, IL 61873
|
- sq. feet
|
- baths - beds |
show details | |

|
#38
King St
Danville, IL 61832
|
- sq. feet
|
- baths - beds |
show details | |

|
#39
County Road 1050 N
Homer, IL 61849
|
- sq. feet
|
- baths - beds |
show details | |

|
#40
W Grant St
Tilton, IL 61833
|
- sq. feet
|
- baths - beds |
show details |
| Photo | Address | Area | Beds / Baths | Price | Details |
|---|---|---|---|---|---|

|
#41
W Grant St
Tilton, IL 61833
|
- sq. feet
|
- baths - beds |
show details | |

|
#42
Perrysville Rd Lot 2
Danville, IL 61834
|
- sq. feet
|
- baths - beds |
show details | |

|
#43
Cr 1850n
Saint Joseph, IL 61873
|
- sq. feet
|
- baths - beds |
show details | |

|
#44
County Road 1850 N
Saint Joseph, IL 61873
|
- sq. feet
|
- baths - beds |
show details | |

|
#45
W 9th St
Georgetown, IL 61846
|
- sq. feet
|
- baths - beds |
show details | |

|
#46
S Church St
Homer, IL 61849
|
- sq. feet
|
- baths - beds |
show details | |

|
#47
Sherwood Dr
Saint Joseph, IL 61873
|
- sq. feet
|
- baths - beds |
show details | |

|
#48
Hillside Dr
Georgetown, IL 61846
|
- sq. feet
|
- baths - beds |
show details | |

|
#49
E 600 North Rd
Georgetown, IL 61846
|
- sq. feet
|
- baths - beds |
show details | |

|
Check over 1 million property listings on Foreclosure.com!
|
browse all offers | |||

Latest news about housing in Oakwood, IL collected exclusively by city-data.com from local newspapers, TV, and radio stations

 | Too many high rise condos but any new public housing? (25 replies) |
| Dominos are starting to fall. Crime in the city leading to billionaires and businesses relocating (216 replies) |
| Is Chicago for me and where should I live there? (26 replies) |
| Mayor Lori Lightfoot Address (290 replies) |
| Apartments around Decatur? (4 replies) |
| RELO from NH: Job in Hoffman Estates, live where? (11 replies) |

Median year apartment built: 1976
Household type by relationship:
Households: 1,317- Male householders: 254 (34 living alone), Female householders: 308 (140 living alone)
223 spouses (223 opposite-sex spouses), 41 unmarried partners, (41 opposite-sex unmarried partners), 369 children (355 natural, 1 adopted, 12 stepchildren), 35 grandchildren, 0 brothers or sisters, 6 parents, 0 foster children, 3 other relatives, 73 non-relatives
Size of family households: 166 2-persons, 75 3-persons, 58 4-persons, 23 5-persons, 8 6-persons.
Size of nonfamily households: 210 1-person, 41 2-persons, 13 3-persons.
98 married couples with children.
216 single-parent households (26 men, 190 women).
98.3% of residents of Oakwood speak English at home.
0.2% of residents speak Spanish at home (100% speak English very well).
1.1% of residents speak other Indo-European language at home (69% speak English very well, 31% speak English well).
0.2% of residents speak Asian or Pacific Island language at home (100% speak English very well).
Foreign born population: 7 (0.5%)
(42.9% of them are naturalized citizens)
| Here: | 6.1 |
| State: | 6.4 |
| Here: | 3.7 |
| State: | 4.1 |

- Bedrooms in owner-occupied houses and condos in Oakwood, Illinois
- 0no bedroom
- 01 bedroom
- 1362 bedrooms
- 2583 bedrooms
- 934 bedrooms
- 35+ bedrooms

- Bedrooms in renter-occupied apartments in Oakwood, Illinois
- 0no bedroom
- 451 bedroom
- 462 bedrooms
- 173 bedrooms
- 14 bedrooms
- 05+ bedrooms

- Cars and other vehicles available in Oakwood in owner-occupied houses/condos
- 6no vehicle
- 1741 vehicle
- 1782 vehicles
- 973 vehicles
- 274 vehicles
- 75+ vehicles

- Cars and other vehicles available in Oakwood in renter-occupied apartments
- 14no vehicle
- 651 vehicle
- 282 vehicles
- 03 vehicles
- 04 vehicles
- 05+ vehicles

- Rooms in owner-occupied houses in Oakwood, Illinois
- 01 room
- 02 rooms
- 63 rooms
- 744 rooms
- 855 rooms
- 1786 rooms
- 1117 rooms
- 108 rooms
- 269+ rooms

- Rooms in renter-occupied apartments in Oakwood, Illinois
- 01 room
- 02 rooms
- 373 rooms
- 494 rooms
- 175 rooms
- 06 rooms
- 27 rooms
- 38 rooms
- 09+ rooms


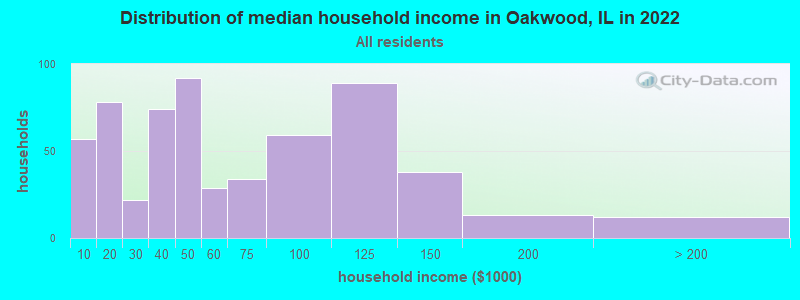
Oakwood, IL household income distribution

- 57Less than $10,000
- 78$10,000 to $19,999
- 22$20,000 to $29,999
- 74$30,000 to $39,999
- 92$40,000 to $49,999
- 29$50,000 to $59,999
- 34$60,000 to $74,999
- 59$75,000 to $99,999
- 89$100,000 to $124,999
- 38$125,000 to $149,999
- 13$150,000 to $199,999
- 12$200,000 or more
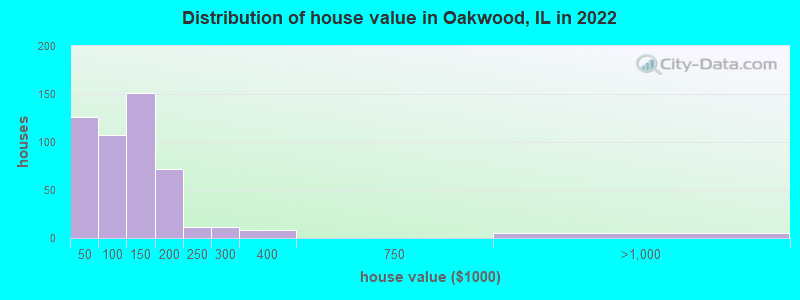
Home value of owner - occupied houses in 2022 in Oakwood, IL
-
- 23Less than $10,000
- 19$10,000 to $14,999
- 3$15,000 to $19,999
- 33$20,000 to $24,999
- 11$25,000 to $29,999
- 11$30,000 to $34,999
- 3$35,000 to $39,999
- 19$40,000 to $49,999
- 17$50,000 to $59,999
- 9$60,000 to $69,999
- 19$70,000 to $79,999
- 24$80,000 to $89,999
- 16$90,000 to $99,999
- 66$100,000 to $124,999
- 84$125,000 to $149,999
- 46$150,000 to $174,999
- 25$175,000 to $199,999
- 10$200,000 to $249,999
- 10$250,000 to $299,999
- 8$300,000 to $399,999
- 3$750,000 to $999,999
- 2$2,000,000 or more
Rent paid by renters in 2022 in Oakwood, IL
-
- 11Less than $100
- 4$150 to $199
- 2$200 to $249
- 5$300 to $349
- 30$450 to $499
- 21$500 to $549
- 2$600 to $649
- 27$650 to $699
- 1$700 to $749
- 5$800 to $899
- 1$900 to $999
- 9$1,000 to $1,249
- 5No cash rent


Percentage of workers working in this county: 79.0%
Number of people working at home: 78 (14.1% of all workers)
Travel time to work (commute)
- Less than 5 minutes: 20
- 5 to 9 minutes: 45
- 10 to 14 minutes: 30
- 15 to 19 minutes: 89
- 20 to 24 minutes: 113
- 25 to 29 minutes: 16
- 30 to 34 minutes: 81
- 35 to 39 minutes: 7
- 40 to 44 minutes: 38
- 45 to 59 minutes: 15
- 60 to 89 minutes: 13
- 90 or more minutes: 7
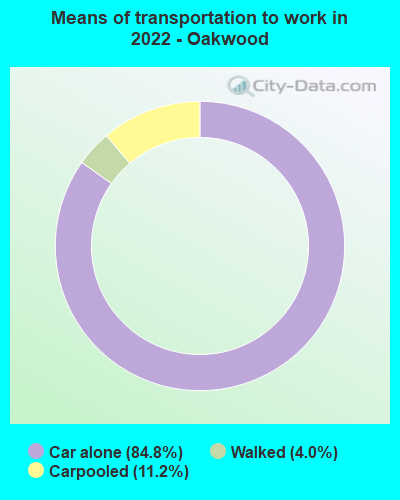
Means of transportation to work:
- Drove a car alone: 182 (64.1%)
- Carpooled: 25 (8.8%)
- Walked: 8 (2.8%)
- Worked at home: 78 (27.5%)

- Unemployment by race in 2022
- Unemployment rate for White non-Hispanic residents
- 1.7%Males
- 1.4%Females

- Year of entry for the foreign-born population in Oakwood, Illinois
- 02010 or later
- 02000 to 2009
- 41990 to 1999
- 01980 to 1989
- 01970 to 1979
- 3Before 1970

First ancestries reported:
- German: 83 (24.3%)
- American: 76 (22.3%)
- English: 54 (15.8%)
- Irish: 28 (8.2%)
- European: 16 (4.7%)
- Dutch: 14 (4.1%)
- Italian: 7 (2.1%)
- French: 5 (1.5%)
- Scotch-Irish: 4 (1.2%)
- Austrian: 2 (0.6%)
- French Canadian: 2 (0.6%)
- Welsh: 2 (0.6%)
Most common places of birth for foreign-born residents (%):
| Oakwood: | 70.0% (7) |
| Illinois: | 1.0% (18,753) |
| Oakwood: | 20.0% (2) |
| Illinois: | 0.1% (2,376) |
Place of birth for U.S.-born residents:
- This state: 1,195
- Other state: 119
- Northeast: 2
- Midwest: 63
- South: 27
- West: 28
91.0% of Oakwood residents lived in the same house 1 years ago.
Out of people who lived in different houses, 44.3% lived in this county.
Out of people who lived in different counties, 58.8% lived in Illinois.
| Oakwood: | 91.0% |
| State average: | 88.3% |
Education attainment for males 25 years and older:
- No schooling: 0
- Nursery to 4th grade: 0
- 5th and 6th grade: 0
- 7th and 8th grade: 0
- 9th grade: 0
- 10th grade: 9
- 11th grade: 4
- 12th grade, no diploma: 11
- High school graduate (or equivalency): 211
- Less than 1 year of college: 47
- Some college more than 1 year, no degree: 33
- Associate degree: 33
- Bachelor's degree: 6
- Master's degree: 18
- Professional school degree: 0
- Doctorate degree: 0

Education attainment for females 25 years and older:
- No schooling: 3
- Nursery to 4th grade: 0
- 5th and 6th grade: 0
- 7th and 8th grade: 2
- 9th grade: 0
- 10th grade: 5
- 11th grade: 0
- 12th grade, no diploma: 5
- High school graduate (or equivalency): 246
- Less than 1 year of college: 54
- Some college more than 1 year, no degree: 43
- Associate degree: 96
- Bachelor's degree: 29
- Master's degree: 18
- Professional school degree: 0
- Doctorate degree: 0


Housing units in structures:
- One, detached: 417
- One, attached: 6
- Two: 11
- 3 or 4: 14
- 5 to 9: 33
- 10 to 19: 2
- Mobile homes: 158
Median worth of mobile homes: $24,026
Housing units lacking complete kitchen facilities in 2022: 2.3%
House/condo owner moved in on average 15 years ago
Renter moved in on average 3 years ago

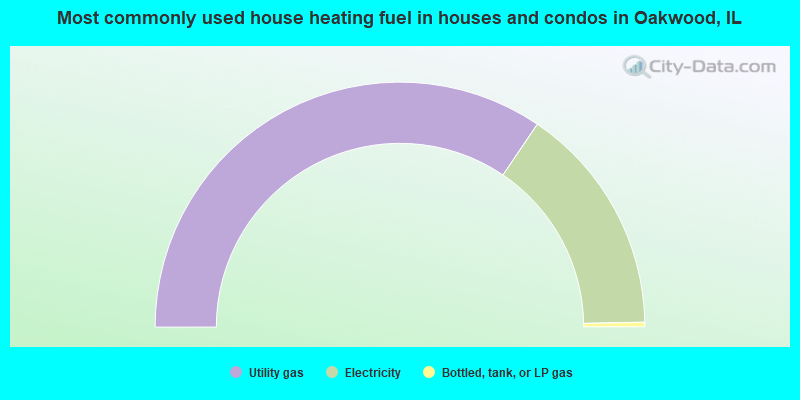
- 68.9%Utility gas
- 30.4%Electricity
- 0.6%Bottled, tank, or LP gas
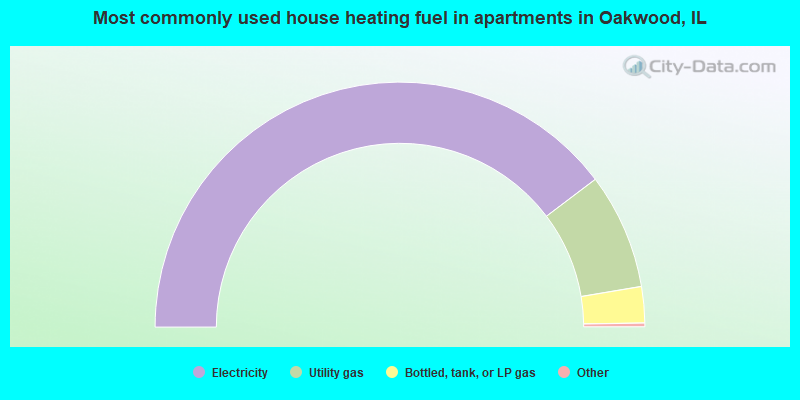
- 79.8%Electricity
- 15.4%Utility gas
- 4.8%Bottled, tank, or LP gas
Private vs. public school enrollment:
| Here: | 4.6% |
| Illinois: | 13.3% |
| Here: | 2.6% |
| Illinois: | 9.9% |
| Here: | 0.0% |
| Illinois: | 27.4% |


