Occidental, CA (California) Houses and Residents
| Occidental: | $1,198,887 |
| California: | $715,900 |
Mean price in 2022:
Detached houses: $1,143,562
Here: $1,143,562 State: $988,808
Total population: 1,115 (Urban population: 0, Rural population: 1,494 (all nonfarm))
Houses: 813 (558 occupied: 360 owner occupied, 204 renter occupied)
| % of renters here: | 36% |
| State: | 44% |
Housing density: 163 houses/condos per square mile
Median price asked for vacant for-sale houses and condos in 2022: $937,957.
Median gross rent in Occidental, CA in 2022: $1,092
Housing units in Occidental with a mortgage: 186 (10 second mortgage, 0 home equity loan, 10 both second mortgage and home equity loan)
Houses without a mortgage: 0
Compare current foreclosures near Occidental, CA:
| Photo | Address | Area | Beds / Baths | Price | Details |
|---|---|---|---|---|---|

|
#1
Bittner Rd
Occidental, CA 95465
|
- sq. feet
|
- baths - beds |
show details | |

|
#2
Hidden Valley Rd
Guerneville, CA 95446
|
284 sq. feet
|
1 baths 1 beds |
$199,900
|
show details |

|
#3
Mcconnell Ave
Santa Rosa, CA 95404
|
1,216 sq. feet
|
2 baths 4 beds |
show details | |

|
#4
Meadowbrook Ct
Cotati, CA 94931
|
1,733 sq. feet
|
2 baths 2 beds |
show details | |

|
#5
Montecito Ave
Santa Rosa, CA 95404
|
1,537 sq. feet
|
2 baths 2 beds |
show details | |

|
#6
Harvest Ln
Santa Rosa, CA 95401
|
1,062 sq. feet
|
2 baths 2 beds |
show details | |

|
#7
Corby Ave
Santa Rosa, CA 95407
|
836 sq. feet
|
1 baths 2 beds |
show details | |

|
#8
Ridgway Ave
Santa Rosa, CA 95401
|
1,603 sq. feet
|
2 baths 3 beds |
show details | |

|
#9
Witter Rd
Sebastopol, CA 95472
|
1,183 sq. feet
|
1 baths 4 beds |
show details | |

|
#10
Carson St
Santa Rosa, CA 95403
|
1,408 sq. feet
|
2 baths 3 beds |
show details |
| Photo | Address | Area | Beds / Baths | Price | Details |
|---|---|---|---|---|---|

|
#11
Decanter Cir
Windsor, CA 95492
|
2,855 sq. feet
|
2 baths 4 beds |
show details | |

|
#12
Mill Station Rd
Sebastopol, CA 95472
|
2,992 sq. feet
|
2 baths 4 beds |
show details | |

|
#13
Graton Rd
Sebastopol, CA 95472
|
2,235 sq. feet
|
3 baths 4 beds |
show details | |

|
#14
Jewett Rd
Petaluma, CA 94952
|
1,600 sq. feet
|
2 baths 4 beds |
show details | |

|
#15
Chiquita Rd
Healdsburg, CA 95448
|
1,606 sq. feet
|
1 baths 2 beds |
show details | |

|
#16
Pistachio Pl
Windsor, CA 95492
|
2,439 sq. feet
|
3 baths 3 beds |
show details | |

|
#17
Wooded Glen Ct
Windsor, CA 95492
|
1,633 sq. feet
|
3 baths 4 beds |
show details | |

|
#18
Antelope Ln
Santa Rosa, CA 95407
|
1,700 sq. feet
|
3 baths 4 beds |
show details | |

|
#19
Aston Cir
Santa Rosa, CA 95404
|
1,012 sq. feet
|
3 baths 3 beds |
show details | |

|
#20
Ward St
Healdsburg, CA 95448
|
1,074 sq. feet
|
1 baths 2 beds |
show details |
| Photo | Address | Area | Beds / Baths | Price | Details |
|---|---|---|---|---|---|

|
#21
Tokay St
Santa Rosa, CA 95404
|
1,569 sq. feet
|
3 baths 4 beds |
show details | |

|
#22
Santa Barbara Dr
Santa Rosa, CA 95404
|
877 sq. feet
|
1 baths 2 beds |
show details | |

|
#23
Wright St
Santa Rosa, CA 95404
|
1,208 sq. feet
|
1 baths 2 beds |
show details | |

|
#24
Leo Dr
Santa Rosa, CA 95407
|
1,873 sq. feet
|
2 baths 3 beds |
show details | |

|
#25
Colgan Ave
Santa Rosa, CA 95404
|
1,340 sq. feet
|
1 baths 2 beds |
show details | |

|
#26
El Mercado Pkwy
Santa Rosa, CA 95403
|
1,439 sq. feet
|
3 baths 3 beds |
show details | |

|
#27
Ashwood Dr
Santa Rosa, CA 95407
|
1,287 sq. feet
|
1 baths 4 beds |
show details | |

|
#28
Ridgway Ave
Santa Rosa, CA 95401
|
1,603 sq. feet
|
2 baths 3 beds |
show details | |

|
#29
Pollard Way
Windsor, CA 95492
|
1,235 sq. feet
|
2 baths 3 beds |
show details | |

|
#30
Ventana Dr
Windsor, CA 95492
|
2,018 sq. feet
|
3 baths 4 beds |
show details |
| Photo | Address | Area | Beds / Baths | Price | Details |
|---|---|---|---|---|---|

|
#31
Hewett St
Santa Rosa, CA 95401
|
2,432 sq. feet
|
2 baths 4 beds |
show details | |

|
#32
Debbie Dr
Santa Rosa, CA 95407
|
1,077 sq. feet
|
2 baths 3 beds |
show details | |

|
#33
Pollard Way
Windsor, CA 95492
|
1,438 sq. feet
|
2 baths 3 beds |
show details | |

|
#34
Equity Ct
Windsor, CA 95492
|
2,342 sq. feet
|
3 baths 4 beds |
show details | |

|
#35
Raccoon Ln
Santa Rosa, CA 95401
|
1,163 sq. feet
|
3 baths 2 beds |
show details | |

|
#36
Racquet Club Cir
Rohnert Park, CA 94928
|
1,162 sq. feet
|
2 baths 2 beds |
show details | |

|
#37
Parkside Dr
Santa Rosa, CA 95404
|
1,198 sq. feet
|
2 baths 3 beds |
show details | |

|
#38
Bernice Ave
Rohnert Park, CA 94928
|
1,400 sq. feet
|
2 baths 4 beds |
show details | |

|
#39
Chiquita Rd
Healdsburg, CA 95448
|
1,606 sq. feet
|
1 baths 2 beds |
show details | |

|
#40
Tarton Dr
Santa Rosa, CA 95405
|
2,145 sq. feet
|
3 baths 4 beds |
show details |
| Photo | Address | Area | Beds / Baths | Price | Details |
|---|---|---|---|---|---|

|
#41
Everglade Dr
Santa Rosa, CA 95409
|
1,344 sq. feet
|
2 baths 4 beds |
show details | |

|
#42
Shade Tree Ln
Santa Rosa, CA 95405
|
1,681 sq. feet
|
2 baths 2 beds |
show details | |

|
#43
Brookshire Cir
Santa Rosa, CA 95405
|
1,558 sq. feet
|
2 baths 4 beds |
show details | |

|
#44
Keyt Way
Cotati, CA 94931
|
1,928 sq. feet
|
3 baths 4 beds |
show details | |

|
#45
Lancaster Dr
Rohnert Park, CA 94928
|
1,408 sq. feet
|
2 baths 3 beds |
show details | |

|
#46
Lisbon Ct
Rohnert Park, CA 94928
|
1,160 sq. feet
|
2 baths 3 beds |
show details | |

|
#47
Hilltop Rd
Healdsburg, CA 95448
|
949 sq. feet
|
1 baths 1 beds |
show details | |

|
#48
Cactus Ave
Santa Rosa, CA 95405
|
1,505 sq. feet
|
2 baths 3 beds |
show details | |

|
#49
Pozzan Rd
Healdsburg, CA 95448
|
1,320 sq. feet
|
2 baths 2 beds |
show details | |

|
Check over 1 million property listings on Foreclosure.com!
|
browse all offers | |||

Latest news about housing in Occidental, CA collected exclusively by city-data.com from local newspapers, TV, and radio stations

 | The Los Angeles Homeless Containment Thread (9136 replies) |
| What on earth is so appealing about LA?? (81 replies) |
| 12 Million Californians Brace for "Bomb Cyclone" caused by Atmospheric River (261 replies) |
| 9 California Universities on List of Nation's 50 Best (75 replies) |
| California: Wonderful Despite Disasters, Crowds, Expense? (54 replies) |
| Seeking advice on Highland Park houses (4 replies) |

Median year apartment built: 1966
Household type by relationship:
Households: 1,048- Male householders: 349 (194 living alone), Female householders: 193 (61 living alone)
254 spouses (231 opposite-sex spouses), 18 unmarried partners, (8 opposite-sex unmarried partners), 123 children (103 natural, 0 adopted, 19 stepchildren), 0 grandchildren, 0 brothers or sisters, 0 parents, 0 foster children, 0 other relatives, 107 non-relatives
Size of family households: 211 2-persons, 34 3-persons, 8 4-persons, 20 7-or-more-persons.
Size of nonfamily households: 281 1-person, 30 2-persons.
98 married couples with children.
0 single-parent households (0 men, 0 women).
89.2% of residents of Occidental speak English at home.
5.4% of residents speak Spanish at home (67% speak English very well, 33% speak English well).
4.3% of residents speak other Indo-European language at home (56% speak English very well, 12% speak English well, 33% speak English not well).
1.7% of residents speak other language at home (100% speak English very well).
Foreign born population: 137 (13.1%)
(65.0% of them are naturalized citizens)
| Here: | 6.6 |
| State: | 6.0 |
| Here: | 3.4 |
| State: | 3.9 |

- Bedrooms in owner-occupied houses and condos in Occidental, California
- 0no bedroom
- 131 bedroom
- 882 bedrooms
- 1573 bedrooms
- 644 bedrooms
- 385+ bedrooms

- Bedrooms in renter-occupied apartments in Occidental, California
- 0no bedroom
- 1201 bedroom
- 762 bedrooms
- 03 bedrooms
- 84 bedrooms
- 05+ bedrooms

- Cars and other vehicles available in Occidental in owner-occupied houses/condos
- 0no vehicle
- 411 vehicle
- 1302 vehicles
- 1283 vehicles
- 94 vehicles
- 515+ vehicles

- Cars and other vehicles available in Occidental in renter-occupied apartments
- 27no vehicle
- 571 vehicle
- 492 vehicles
- 713 vehicles
- 04 vehicles
- 05+ vehicles

- Rooms in owner-occupied houses in Occidental, California
- 01 room
- 02 rooms
- 03 rooms
- 454 rooms
- 665 rooms
- 236 rooms
- 1367 rooms
- 338 rooms
- 599+ rooms

- Rooms in renter-occupied apartments in Occidental, California
- 01 room
- 82 rooms
- 973 rooms
- 804 rooms
- 205 rooms
- 06 rooms
- 07 rooms
- 08 rooms
- 09+ rooms


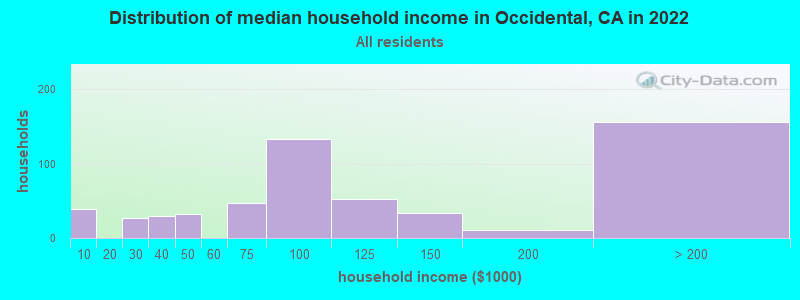
Occidental, CA household income distribution

- 39Less than $10,000
- 27$20,000 to $29,999
- 29$30,000 to $39,999
- 32$40,000 to $49,999
- 47$60,000 to $74,999
- 133$75,000 to $99,999
- 53$100,000 to $124,999
- 34$125,000 to $149,999
- 11$150,000 to $199,999
- 156$200,000 or more
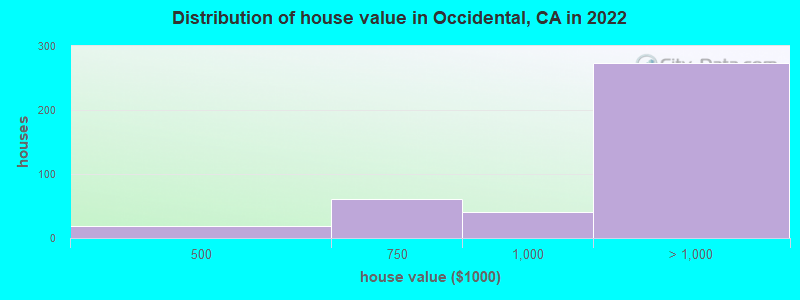
Home value of owner - occupied houses in 2022 in Occidental, CA
-
- 18$400,000 to $499,999
- 61$500,000 to $749,999
- 40$750,000 to $999,999
- 86$1,000,000 to $1,499,999
- 156$1,500,000 to $1,999,999
- 30$2,000,000 or more
Rent paid by renters in 2022 in Occidental, CA
-
- 95$600 to $649
- 36$800 to $899
- 38$900 to $999
- 6$1,500 to $1,999
- 36$2,000 to $2,499
- 15$2,500 to $2,999
- 9$3,000 to $3,499
- 11No cash rent


Percentage of workers working in this county: 101.1%
Number of people working at home: 357 (66.4% of all workers)
Travel time to work (commute)
- Less than 5 minutes: 22
- 5 to 9 minutes: 0
- 10 to 14 minutes: 0
- 15 to 19 minutes: 74
- 20 to 24 minutes: 9
- 25 to 29 minutes: 8
- 30 to 34 minutes: 31
- 35 to 39 minutes: 14
- 40 to 44 minutes: 30
- 45 to 59 minutes: 34
- 60 to 89 minutes: 0
- 90 or more minutes: 0
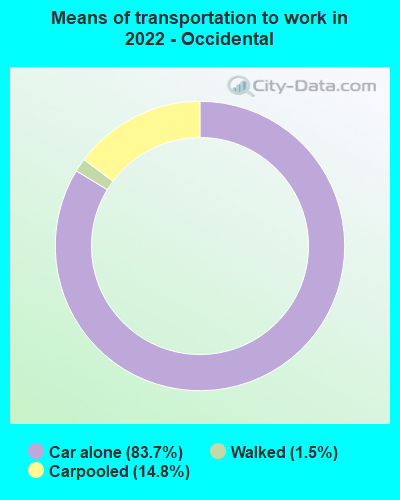
Means of transportation to work:
- Drove a car alone: 435 (60.7%)
- Carpooled: 68 (9.5%)
- Walked: 4 (0.6%)
- Worked at home: 417 (58.2%)

- Unemployment by race in 2022
- Unemployment rate for other race residents
- 42.7%Females

- Year of entry for the foreign-born population in Occidental, California
- 322010 or later
- 42000 to 2009
- 321990 to 1999
- 01980 to 1989
- 161970 to 1979
- 17Before 1970

First ancestries reported:
- American: 40 (9.9%)
- English: 29 (7.2%)
- European: 26 (6.4%)
- Italian: 20 (4.9%)
- Irish: 9 (2.2%)
- Maltese: 9 (2.2%)
- British: 8 (2.0%)
- Russian: 6 (1.5%)
- Bulgarian: 5 (1.2%)
- Armenian: 4 (1.0%)
- French Canadian: 3 (0.7%)
- Scottish: 2 (0.5%)
Most common places of birth for foreign-born residents (%):
| Occidental: | 47.4% (65) |
| California: | 37.2% (3,881,193) |
| Occidental: | 18.2% (25) |
| California: | 0.6% (60,582) |
| Occidental: | 11.7% (16) |
| California: | 0.4% (39,097) |
| Occidental: | 8.8% (12) |
| California: | 0.3% (33,029) |
| Occidental: | 3.6% (5) |
| California: | 0.1% (9,442) |
| Occidental: | 2.2% (3) |
| California: | 0.3% (33,937) |
Place of birth for U.S.-born residents:
- This state: 512
- Other state: 408
- Northeast: 73
- Midwest: 215
- South: 54
- West: 55
94.2% of Occidental residents lived in the same house 1 years ago.
Out of people who lived in different houses, 34.6% lived in this county.
Out of people who lived in different counties, 100.0% lived in California.
| Occidental: | 94.2% |
| State average: | 88.9% |
Education attainment for males 25 years and older:
- No schooling: 0
- Nursery to 4th grade: 0
- 5th and 6th grade: 28
- 7th and 8th grade: 0
- 9th grade: 0
- 10th grade: 0
- 11th grade: 0
- 12th grade, no diploma: 0
- High school graduate (or equivalency): 95
- Less than 1 year of college: 0
- Some college more than 1 year, no degree: 99
- Associate degree: 0
- Bachelor's degree: 193
- Master's degree: 32
- Professional school degree: 72
- Doctorate degree: 0

Education attainment for females 25 years and older:
- No schooling: 0
- Nursery to 4th grade: 0
- 5th and 6th grade: 0
- 7th and 8th grade: 0
- 9th grade: 0
- 10th grade: 0
- 11th grade: 0
- 12th grade, no diploma: 0
- High school graduate (or equivalency): 3
- Less than 1 year of college: 11
- Some college more than 1 year, no degree: 70
- Associate degree: 32
- Bachelor's degree: 189
- Master's degree: 95
- Professional school degree: 0
- Doctorate degree: 7


Housing units in structures:
- One, detached: 712
- One, attached: 37
- Mobile homes: 63
Housing units lacking complete kitchen facilities in 2022: 13.6%
House/condo owner moved in on average 16 years ago
Renter moved in on average 9 years ago

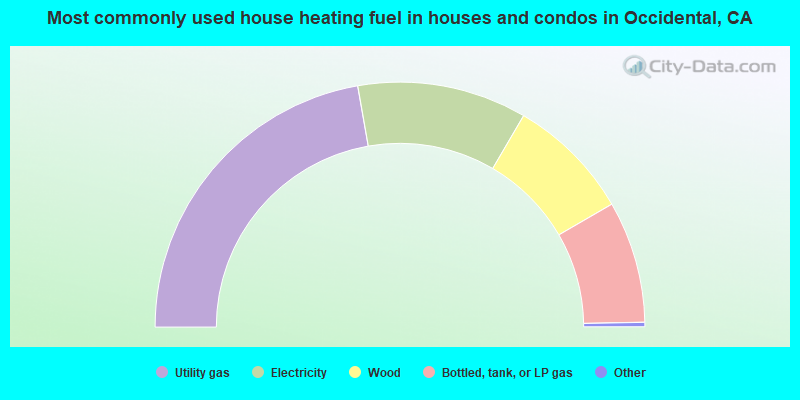
- 44.7%Utility gas
- 22.5%Electricity
- 16.5%Wood
- 16.2%Bottled, tank, or LP gas
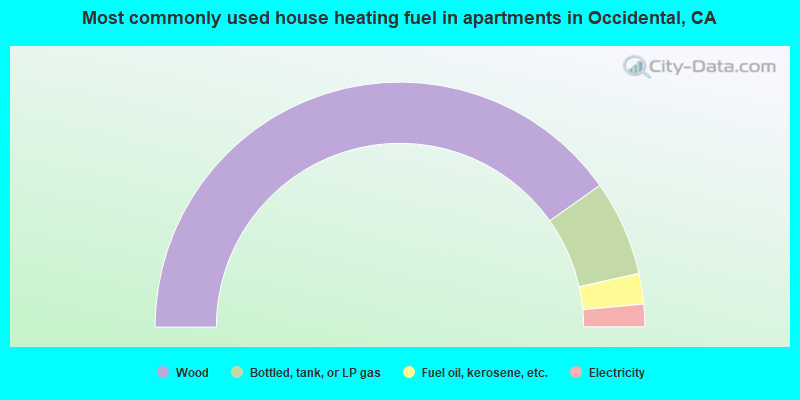
- 80.4%Wood
- 12.6%Bottled, tank, or LP gas
- 4.0%Fuel oil, kerosene, etc.
- 3.0%Electricity
Private vs. public school enrollment:
| Here: | 0.0% |
| California: | 10.5% |
| Here: | 0.0% |
| California: | 8.5% |
| Here: | 0.0% |
| California: | 15.9% |


