Ocean Springs, MS (Mississippi) Houses and Residents
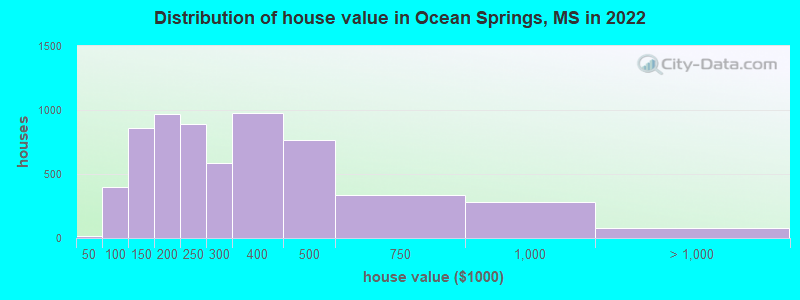
Estimated median house or condo value in 2022: $229,369 (it was $96,900 in 2000 )
Ocean Springs:
$229,369Mississippi:
$162,500
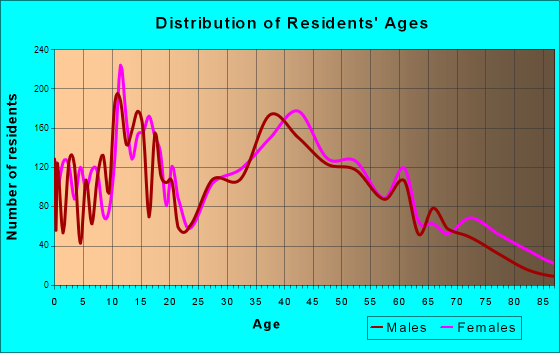
Lower value quartile - upper value quartile: $158,372 - $384,412Total population: 17,530 (Urban population: 17,136, Rural population: 81 (all nonfarm) )
Houses: 8,583 (8,045 occupied: 5,824 owner occupied, 2,499 renter occupied )
% of renters here:
30%State:
30%
Housing density: 737 houses/condos per square mile
Median price asked for vacant for-sale houses and condos in 2022: $471,088.
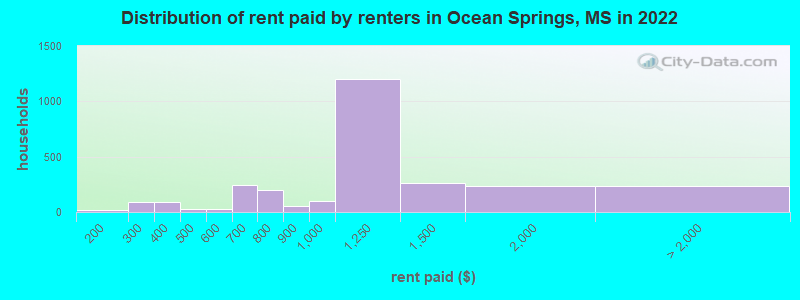
Median contract rent in 2022: $1,087 (lower quartile is $697, upper quartile is $1,406)
Median rent asked for vacant for-rent units in 2022: $3,192
Median gross rent in Ocean Springs, MS in 2022: $1,269
Housing units in Ocean Springs with a mortgage: 3,731 (245 second mortgage, 0 home equity loan, 192 both second mortgage and home equity loan )Houses without a mortgage: 50
Median household income for houses/condos with a mortgage: $99,246
Median household income for apartments without a mortgage: $63,537
Median monthly housing costs: $1,288
Data:
Median house or condo value ($)
Median house or condo value ($ change since 2000)
Median house or condo value ($) - White
Median house or condo value ($) - Black or African American
Median house or condo value ($) - Asian
Median house or condo value ($) - Hispanic or Latino
Median house or condo value ($) - American Indian and Alaska Native
Median house or condo value ($) - Multirace
Median house or condo value ($) - Other Race
Median price asked for mobile homes ($)
Household density (households per square mile)
Mean house or condo value by units in structure - 1, detached ($)
Mean house or condo value by units in structure - 1, attached ($)
Mean house or condo value by units in structure - 2 ($)
Mean house or condo value by units in structure by units in structure - 3 or 4 ($)
Mean house or condo value by units in structure - 5 or more ($)
Mean house or condo value by units in structure - Boat, RV, van, etc. ($)
Mean house or condo value by units in structure - Mobile home ($)
Median contract rent ($)
Median contract rent - Lower quartile ($)
Median contract rent - Upper quartile ($)
Median gross rent ($)
Urban houses (%)
Rural houses (%)
Houses occupied (%)
Houses occupied (% change since 2000)
Houses owner occupied (%)
Houses owner occupied (% change since 2000)
Houses renter occupied (%)
Houses renter occupied (% change since 2000)
Vacant housing units - For rent (%)
Vacant housing units - For rent (% change since 2000)
Vacant housing units - For sale only (%)
Vacant housing units - For sale only (% change since 2000)
Vacant housing units - Rented or sold, not occupied (%)
Vacant housing units - Rented or sold, not occupied (% change since 2000)
Vacant housing units - For seasonal, recreational, or occasional use (%)
Vacant housing units - For seasonal, recreational, or occasional use (% change since 2000)
Vacant housing units - For migrant workers (%)
Vacant housing units - For migrant workers (% change since 2000)
Vacant housing units - Other vacant (%)
Vacant housing units - Other vacant (% change since 2000)
Median monthly housing costs ($)
Median household income for houses/condos with a mortgage ($)
Median household income for houses/condos without a mortgage ($)
Median household income ($)
Median household income ($) - White
Median household income ($) - Black or African American
Median household income ($) - Asian
Median household income ($) - Hispanic or Latino
Median household income ($) - American Indian and Alaska Native
Median household income ($) - Multirace
Median household income ($) - Other Race
Mortgage status - with mortgage (%)
Mortgage status - with second mortgage (%)
Mortgage status - with home equity loan (%)
Mortgage status - with both second mortgage and home equity loan (%)
Mortgage status - without a mortgage (%)
Median year house/condo built
Median year apartment built
Household type by relationship - Male householder living alone (%)
Household type by relationship - Male householder not living alone (%)
Household type by relationship - Female householder living alone (%)
Household type by relationship - Female householder not living alone (%)
Household type by relationship - Opposite-Sex spouse (%)
Household type by relationship - Same-Sex spouse (%)
Household type by relationship - Opposite-Sex unmarried partner (%)
Household type by relationship - Same-Sex unmarried partner (%)
Household type by relationship - In group quarters (%)
Size of family households - 2-person household (%)
Size of family households - 3-person household (%)
Size of family households - 4-person household (%)
Size of family households - 5-person household (%)
Size of family households - 6-person household (%)
Size of family households - 7-or-more-person household (%)
Size of nonfamily households - 1-person household (%)
Size of nonfamily households - 2-person household (%)
Size of nonfamily households - 3-person household (%)
Size of nonfamily households - 4-person household (%)
Size of nonfamily households - 5-person household (%)
Size of nonfamily households - 6-person household (%)
Size of nonfamily households - 7-or-moreperson household (%)
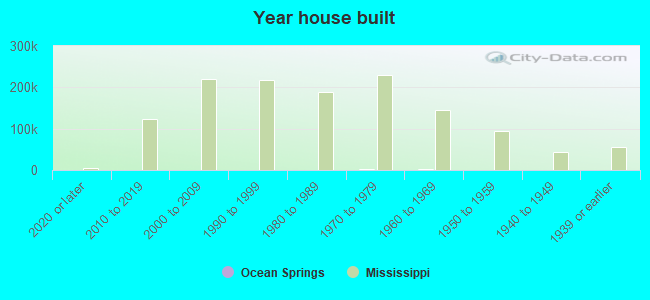
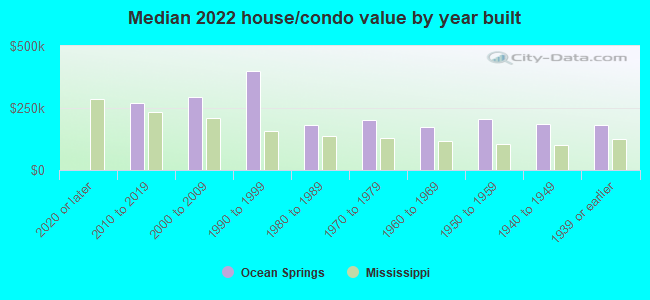
Year house built - Built 2010 or later (%)
Year house built - Built 2000 to 2009 (%)
Year house built - Built 1990 to 1999 (%)
Year house built - Built 1980 to 1989 (%)
Year house built - Built 1970 to 1979 (%)
Year house built - Built 1960 to 1969 (%)
Year house built - Built 1950 to 1959 (%)
Year house built - Built 1940 to 1949 (%)
Year house built - Built 1939 or earlier (%)
Median number of rooms in houses and condos
Median number of rooms in apartments
Median number of bedrooms in owner occupied houses
Mean number of bedrooms in owner occupied houses
Median number of bedrooms in renter occupied houses
Mean number of bedrooms in renter occupied houses
Median number of vehichles in owner occupied houses
Mean number of vehichles in owner occupied houses
Median number of vehichles in renter occupied houses
Mean number of vehichles in renter occupied houses
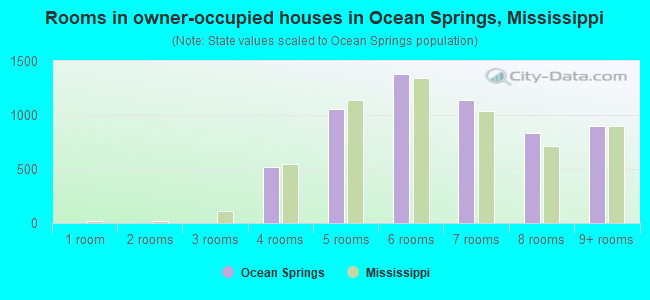
Rooms in owner-occupied houses - 1 room (%)
Rooms in owner-occupied houses - 2 rooms (%)
Rooms in owner-occupied houses - 3 rooms (%)
Rooms in owner-occupied houses - 4 rooms (%)
Rooms in owner-occupied houses - 5 rooms (%)
Rooms in owner-occupied houses - 6 rooms (%)
Rooms in owner-occupied houses - 7 rooms (%)
Rooms in owner-occupied houses - 8 rooms (%)
Rooms in owner-occupied houses - 9+ rooms (%)
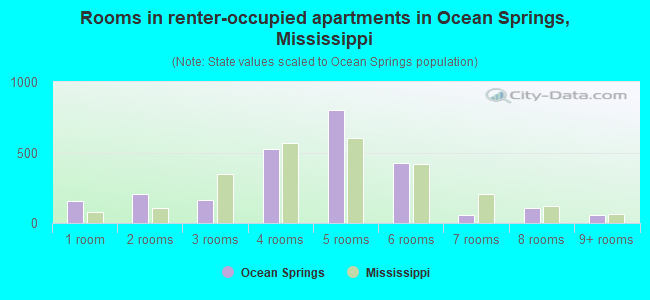
Rooms in renter-occupied houses - 1 room (%)
Rooms in renter-occupied houses - 2 rooms (%)
Rooms in renter-occupied houses - 3 rooms (%)
Rooms in renter-occupied houses - 4 rooms (%)
Rooms in renter-occupied houses - 5 rooms (%)
Rooms in renter-occupied houses - 6 rooms (%)
Rooms in renter-occupied houses - 7 rooms (%)
Rooms in renter-occupied houses - 8 rooms (%)
Rooms in renter-occupied houses - 9+ rooms (%)
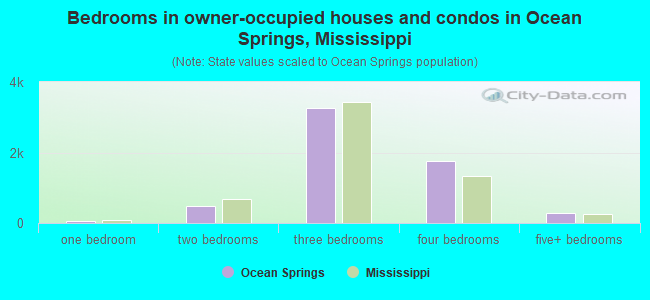
Bedrooms in owner-occupied houses - no bedrooms (%)
Bedrooms in owner-occupied houses - 1 bedroom (%)
Bedrooms in owner-occupied houses - 2 bedrooms (%)
Bedrooms in owner-occupied houses - 3 bedrooms (%)
Bedrooms in owner-occupied houses - 4 bedrooms (%)
Bedrooms in owner-occupied houses - 5+ bedrooms (%)
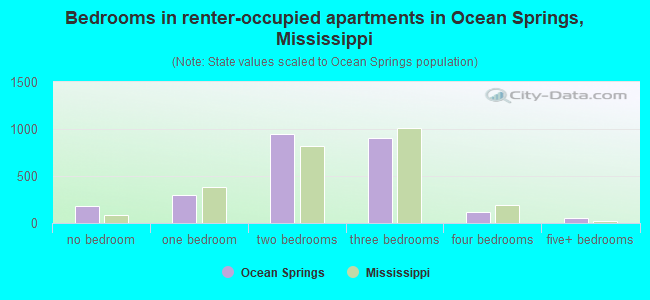
Bedrooms in renter-occupied houses - no bedrooms (%)
Bedrooms in renter-occupied houses - 1 bedroom (%)
Bedrooms in renter-occupied houses - 2 bedrooms (%)
Bedrooms in renter-occupied houses - 3 bedrooms (%)
Bedrooms in renter-occupied houses - 4 bedrooms (%)
Bedrooms in renter-occupied houses - 5+ bedrooms (%)
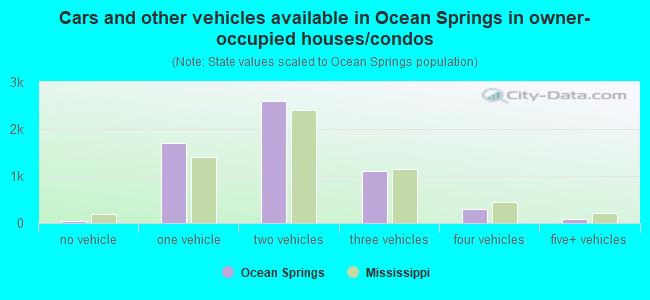
Vehicles available in owner-occupied houses - no vehicle available (%)
Vehicles available in owner-occupied houses - 1 vehicle available(%)
Vehicles available in owner-occupied houses - 2 Vehicles available (%)
Vehicles available in owner-occupied houses - 3 Vehicles available (%)
Vehicles available in owner-occupied houses - 4 Vehicles available (%)
Vehicles available in owner-occupied houses - 5+ Vehicles available (%)
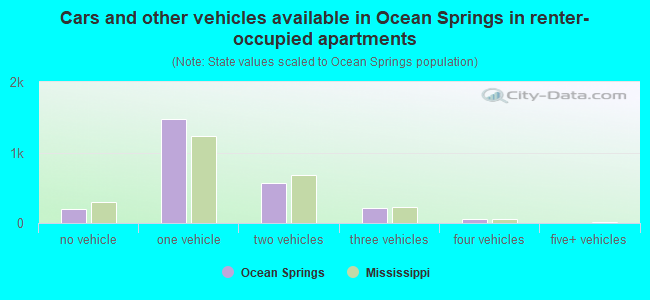
Vehicles available in renter-occupied houses - no vehicle available (%)
Vehicles available in renter-occupied houses - 1 vehicle available (%)
Vehicles available in renter-occupied houses - 2 Vehicles available (%)
Vehicles available in renter-occupied houses - 3 Vehicles available (%)
Vehicles available in renter-occupied houses - 4 Vehicles available (%)
Vehicles available in renter-occupied houses - 5+ Vehicles available (%)
Housing units in structures - 1, detached (%)
Housing units in structures - 1, attached (%)
Housing units in structures - 2 (%)
Housing units in structures - 3 or 4 (%)
Housing units in structures - 5 to 9 (%)
Housing units in structures - 10 to 19 (%)
Housing units in structures - 20 to 49 (%)
Housing units in structures - 50 or more (%)
Housing units in structures - Mobile home (%)
Housing units in structures - Boat, RV, van, etc. (%)
Housing units in structures - Owners - 1, detached (%)
Housing units in structures - Owners - 1, attached (%)
Housing units in structures - Owners - 2 (%)
Housing units in structures - Owners - 3 or 4 (%)
Housing units in structures - Owners - 5 to 9 (%)
Housing units in structures - Owners - 10 to 19 (%)
Housing units in structures - Owners - 20 to 49 (%)
Housing units in structures - Owners - 50 or more (%)
Housing units in structures - Owners - Mobile home (%)
Housing units in structures - Owners - Boat, RV, van, etc. (%)
Housing units in structures - Renters - 1, detached (%)
Housing units in structures - Renters - 1, attached (%)
Housing units in structures - Renters - 2 (%)
Housing units in structures - Renters - 3 or 4 (%)
Housing units in structures - Renters - 5 to 9 (%)
Housing units in structures - Renters - 10 to 19 (%)
Housing units in structures - Renters - 20 to 49 (%)
Housing units in structures - Renters - 50 or more (%)
Housing units in structures - Renters - Mobile home (%)
Housing units in structures - Renters - Boat, RV, van, etc. (%)
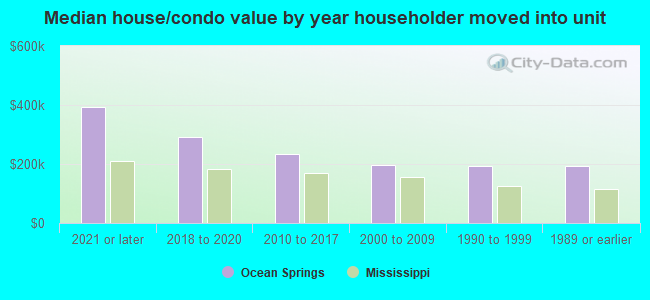
House/condo owner moved in on average (years ago)
Renter moved in on average (years ago)
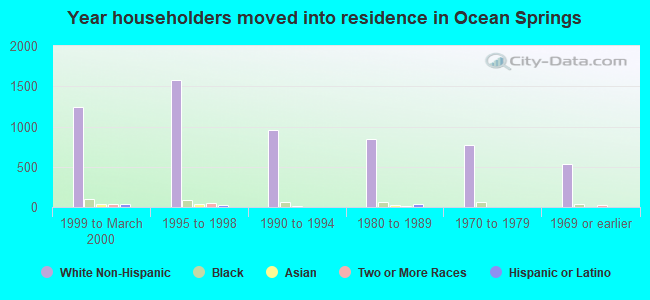
Year householder moved into unit - Moved in 1999 to March 2000 (%)
Year householder moved into unit - Moved in 1999 to March 2000 (%) - White
Year householder moved into unit - Moved in 1999 to March 2000 (%) - Black or African American
Year householder moved into unit - Moved in 1999 to March 2000 (%) - Asian
Year householder moved into unit - Moved in 1999 to March 2000 (%) - Hispanic or Latino
Year householder moved into unit - Moved in 1999 to March 2000 (%) - American Indian and Alaska Native
Year householder moved into unit - Moved in 1999 to March 2000 (%) - Multirace
Year householder moved into unit - Moved in 1999 to March 2000 (%) - Other Race
Year householder moved into unit - Moved in 1995 to 1998 (%)
Year householder moved into unit - Moved in 1995 to 1998 (%) - White
Year householder moved into unit - Moved in 1995 to 1998 (%) - Black or African American
Year householder moved into unit - Moved in 1995 to 1998 (%) - Asian
Year householder moved into unit - Moved in 1995 to 1998 (%) - Hispanic or Latino
Year householder moved into unit - Moved in 1995 to 1998 (%) - American Indian and Alaska Native
Year householder moved into unit - Moved in 1995 to 1998 (%) - Multirace
Year householder moved into unit - Moved in 1995 to 1998 (%) - Other Race
Year householder moved into unit - Moved in 1990 to 1994 (%)
Year householder moved into unit - Moved in 1990 to 1994 (%) - White
Year householder moved into unit - Moved in 1990 to 1994 (%) - Black or African American
Year householder moved into unit - Moved in 1990 to 1994 (%) - Asian
Year householder moved into unit - Moved in 1990 to 1994 (%) - Hispanic or Latino
Year householder moved into unit - Moved in 1990 to 1994 (%) - American Indian and Alaska Native
Year householder moved into unit - Moved in 1990 to 1994 (%) - Multirace
Year householder moved into unit - Moved in 1990 to 1994 (%) - Other Race
Year householder moved into unit - Moved in 1980 to 1989 (%)
Year householder moved into unit - Moved in 1980 to 1989 (%) - White
Year householder moved into unit - Moved in 1980 to 1989 (%) - Black or African American
Year householder moved into unit - Moved in 1980 to 1989 (%) - Asian
Year householder moved into unit - Moved in 1980 to 1989 (%) - Hispanic or Latino
Year householder moved into unit - Moved in 1980 to 1989 (%) - American Indian and Alaska Native
Year householder moved into unit - Moved in 1980 to 1989 (%) - Multirace
Year householder moved into unit - Moved in 1980 to 1989 (%) - Other Race
Year householder moved into unit - Moved in 1970 to 1979 (%)
Year householder moved into unit - Moved in 1970 to 1979 (%) - White
Year householder moved into unit - Moved in 1970 to 1979 (%) - Black or African American
Year householder moved into unit - Moved in 1970 to 1979 (%) - Asian
Year householder moved into unit - Moved in 1970 to 1979 (%) - Hispanic or Latino
Year householder moved into unit - Moved in 1970 to 1979 (%) - American Indian and Alaska Native
Year householder moved into unit - Moved in 1970 to 1979 (%) - Multirace
Year householder moved into unit - Moved in 1970 to 1979 (%) - Other Race
Year householder moved into unit - Moved in 1969 or earlier (%)
Year householder moved into unit - Moved in 1969 or earlier (%) - White
Year householder moved into unit - Moved in 1969 or earlier (%) - Black or African American
Year householder moved into unit - Moved in 1969 or earlier (%) - Asian
Year householder moved into unit - Moved in 1969 or earlier (%) - Hispanic or Latino
Year householder moved into unit - Moved in 1969 or earlier (%) - American Indian and Alaska Native
Year householder moved into unit - Moved in 1969 or earlier (%) - Multirace
Year householder moved into unit - Moved in 1969 or earlier (%) - Other Race
Housing units lacking complete plumbing facilities (%)
Housing units lacking complete kitchen facilities (%)
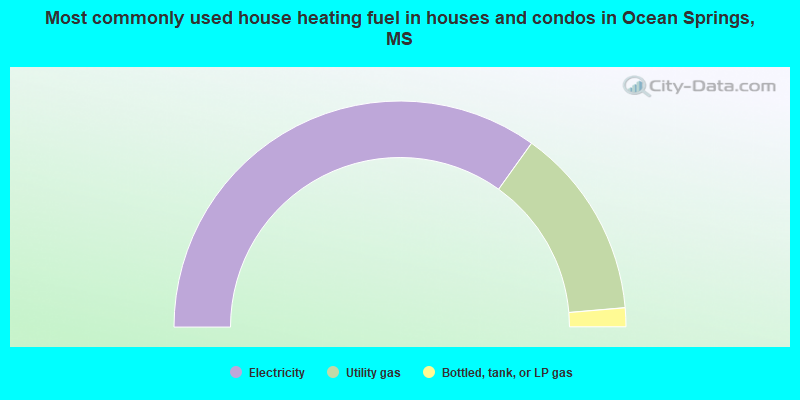
House heating fuel used in houses and condos - Utility gas (%)
House heating fuel used in houses and condos - Bottled, tank, or LP gas (%)
House heating fuel used in houses and condos - Electricity (%)
House heating fuel used in houses and condos - Fuel oil, kerosene, etc. (%)
House heating fuel used in houses and condos - Coal or coke (%)
House heating fuel used in houses and condos - Wood (%)
House heating fuel used in houses and condos - Solar energy (%)
House heating fuel used in houses and condos - Other fuel (%)
House heating fuel used in houses and condos - No fuel used (%)
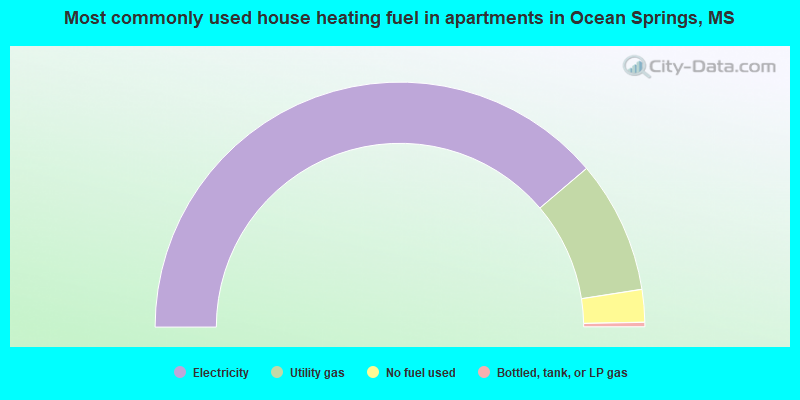
House heating fuel used in apartments - Utility gas (%)
House heating fuel used in apartments - Bottled, tank, or LP gas (%)
House heating fuel used in apartments - Electricity (%)
House heating fuel used in apartments - Fuel oil, kerosene, etc. (%)
House heating fuel used in apartments - Coal or coke (%)
House heating fuel used in apartments - Wood (%)
House heating fuel used in apartments - Solar energy (%)
House heating fuel used in apartments - Other fuel (%)
House heating fuel used in apartments - No fuel used (%)
Median year house/condo built: 1978Median year apartment built: 1980Household type by relationship:
Households: 18,577
Male householders: 4,374 (1,364 living alone ), Female householders: 3,596 (1,285 living alone )3,610 spouses (3,610 opposite-sex spouses ), 259 unmarried partners , (196 opposite-sex unmarried partners ), 5,557 children (5,246 natural , 147 adopted , 163 stepchildren ), 319 grandchildren , 109 brothers or sisters , 290 parents , 0 foster children , 60 other relatives , 252 non-relatives In group quarters: 147
Size of family households: 2,660 2-persons , 1,270 3-persons , 913 4-persons , 493 5-persons , 74 6-persons , 3 7-or-more-persons .
Size of nonfamily households: 2,708 1-person , 164 2-persons , 124 3-persons .
2,779 married couples with children. single-parent households (424 men , 877 women ).
94.6% of residents of Ocean Springs speak English at home. of residents speak Spanish at home (77% speak English very well , 13% speak English well , 7% speak English not well , 3% don't speak English at all ).of residents speak other Indo-European language at home (38% speak English very well , 12% speak English well , 50% speak English not well ).of residents speak Asian or Pacific Island language at home (78% speak English very well , 17% speak English well , 2% speak English not well , 2% don't speak English at all ).of residents speak other language at home (100% speak English well ).
Foreign born population: 721 (3.9%)of them are naturalized citizens )
Median number of rooms in houses and condos:
Median number of rooms in apartments
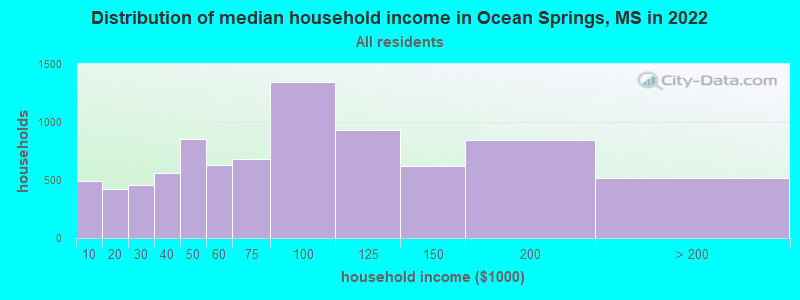
Ocean Springs, MS household income distribution 489 Less than $10,000423 $10,000 to $19,999455 $20,000 to $29,999564 $30,000 to $39,999855 $40,000 to $49,999628 $50,000 to $59,999678 $60,000 to $74,9991,345 $75,000 to $99,999928 $100,000 to $124,999622 $125,000 to $149,999848 $150,000 to $199,999518 $200,000 or more
Home value of owner - occupied houses in 2022 in Ocean Springs, MS 12 $20,000 to $24,99921 $50,000 to $59,99967 $60,000 to $69,999103 $70,000 to $79,999130 $80,000 to $89,99973 $90,000 to $99,999458 $100,000 to $124,999400 $125,000 to $149,999500 $150,000 to $174,999467 $175,000 to $199,999892 $200,000 to $249,999584 $250,000 to $299,999976 $300,000 to $399,999763 $400,000 to $499,999338 $500,000 to $749,999282 $750,000 to $999,99933 $1,000,000 to $1,499,99911 $1,500,000 to $1,999,99931 $2,000,000 or moreRent paid by renters in 2022 in Ocean Springs, MS 19 $150 to $19970 $200 to $24916 $250 to $29981 $300 to $34910 $350 to $39925 $450 to $49929 $550 to $599183 $600 to $64958 $650 to $699111 $700 to $74985 $750 to $79957 $800 to $899100 $900 to $9991,200 $1,000 to $1,249263 $1,250 to $1,499237 $1,500 to $1,99917 $2,000 to $2,49968 $3,000 to $3,49943 $3,500 or more106 No cash rent
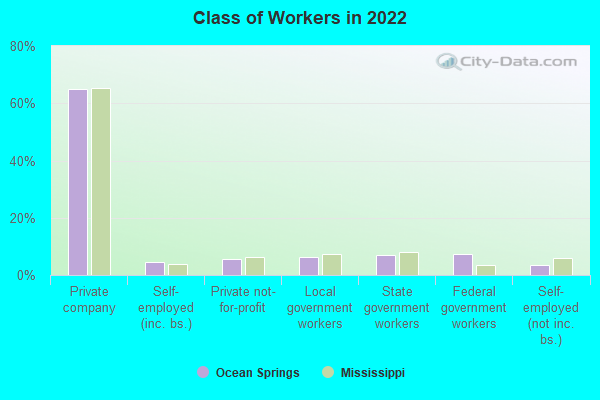
Percentage of workers working in this county: 59.9%Number of people working at home: 856 (9.9% of all workers )
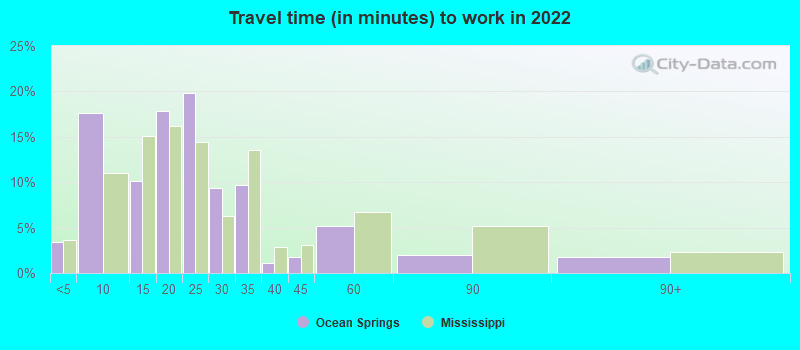
Travel time to work (commute)
Less than 5 minutes: 2945 to 9 minutes: 88310 to 14 minutes: 91515 to 19 minutes: 1,30320 to 24 minutes: 1,19125 to 29 minutes: 60530 to 34 minutes: 1,20735 to 39 minutes: 21940 to 44 minutes: 16345 to 59 minutes: 89960 to 89 minutes: 21490 or more minutes: 435
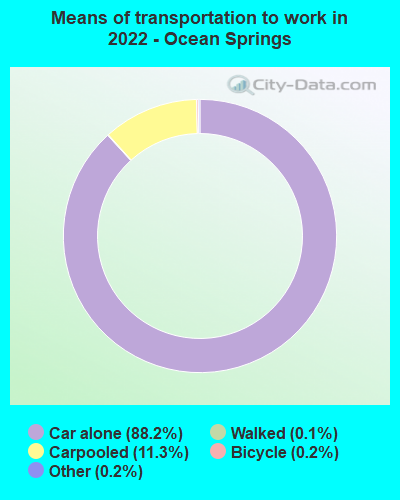
Means of transportation to work:
Drove a car alone: 8,240 (80.3%)Carpooled: 1,171 (11.4%)Taxi: 16 (0.2%)Bicycle: 16 (0.2%)Walked: 15 (0.1%)Worked at home: 856 (8.3%)
Unemployment by race in 2022
Unemployment rate for White non-Hispanic residents 3.7% Males3.3% FemalesUnemployment rate for American Indian and Alaska Native residents 100.0% Males
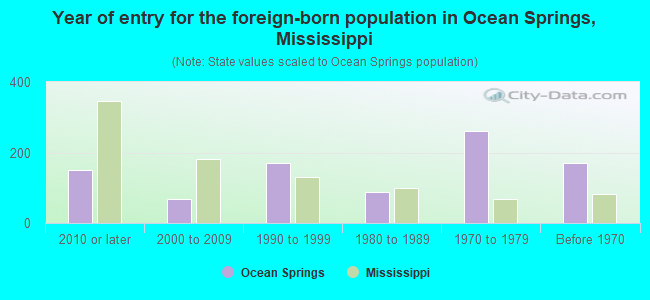
Year of entry for the foreign-born population in Ocean Springs, Mississippi
151 2010 or later 67 2000 to 2009 170 1990 to 1999 89 1980 to 1989 261 1970 to 1979 170 Before 1970
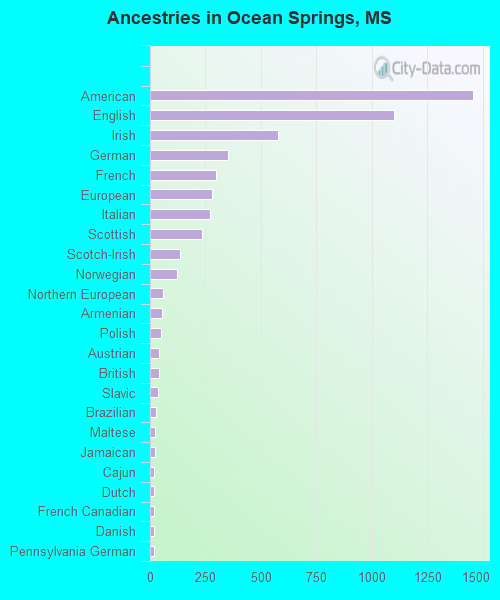
First ancestries reported:
American: 1,456 (18.3%)
English: 1,102 (13.9%)
Irish: 576 (7.3%)
German: 352 (4.4%)
French: 296 (3.7%)
European: 279 (3.5%)
Italian: 271 (3.4%)
Scottish: 235 (3.0%)
Scotch-Irish: 136 (1.7%)
Norwegian: 124 (1.6%)
Northern European: 60 (0.8%)
Armenian: 52 (0.7%)
Polish: 49 (0.6%)
Austrian: 41 (0.5%)
British: 41 (0.5%)
Slavic: 38 (0.5%)
Brazilian: 26 (0.3%)
Maltese: 22 (0.3%)
Jamaican: 22 (0.3%)
Cajun: 19 (0.2%)
Dutch: 19 (0.2%)
French Canadian: 18 (0.2%)
Danish: 16 (0.2%)
Pennsylvania German: 16 (0.2%)
Greek: 13 (0.2%)
Swedish: 13 (0.2%)
Canadian: 10 (0.1%)
Portuguese: 10 (0.1%)
Hungarian: 9 (0.1%)
Eastern European: 6 (0.08%) Most common places of birth for foreign-born residents (%): Philippines Ocean Springs:
14.7% (148)Mississippi:
4.7% (3,211)
Honduras Ocean Springs:
12.5% (126)Mississippi:
5.1% (3,475)
Vietnam Ocean Springs:
8.3% (83)Mississippi:
5.8% (3,948)
Korea Ocean Springs:
7.8% (78)Mississippi:
1.5% (1,043)
Mexico Ocean Springs:
6.2% (62)Mississippi:
25.4% (17,354)
Armenia Ocean Springs:
5.4% (54)Mississippi:
0.1% (54)
Pakistan Ocean Springs:
4.9% (49)Mississippi:
0.7% (455)
Panama Ocean Springs:
4.7% (47)Mississippi:
0.3% (221)
England Ocean Springs:
4.6% (46)Mississippi:
1.5% (1,053)
Brazil Ocean Springs:
3.9% (39)Mississippi:
0.8% (556)
Canada Ocean Springs:
3.9% (39)Mississippi:
2.0% (1,390)
Colombia Ocean Springs:
3.7% (37)Mississippi:
1.4% (941)
France Ocean Springs:
3.2% (32)Mississippi:
0.4% (259)
Taiwan Ocean Springs:
2.3% (23)Mississippi:
0.6% (414)
Jamaica Ocean Springs:
2.2% (22)Mississippi:
1.3% (899)
Other Southern Europe Ocean Springs:
2.1% (21)Mississippi:
0.0% (22)
Nepal Ocean Springs:
1.7% (17)Mississippi:
0.7% (458)
Malaysia Ocean Springs:
1.6% (16)Mississippi:
0.2% (115)
Place of birth for U.S.-born residents:
This state: 8,627Other state: 8,848Northeast: 989Midwest: 1,469South: 5,175West: 1,210 82.6% of Ocean Springs residents lived in the same house 1 years ago.
Out of people who lived in different houses, 38.1% lived in this county.
Out of people who lived in different counties, 37.2% lived in Mississippi.
Ocean Springs:
82.6%State average:
88.9%
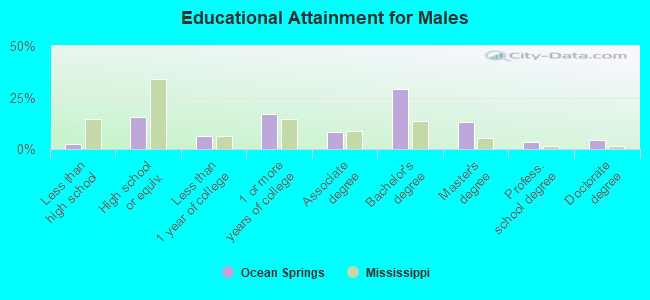
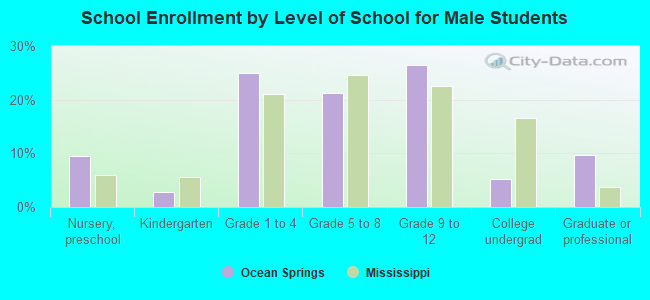
Education attainment for males 25 years and older:
No schooling: 70Nursery to 4th grade: 05th and 6th grade: 267th and 8th grade: 189th grade: 310th grade: 1611th grade: 012th grade, no diploma: 18High school graduate (or equivalency): 1,029Less than 1 year of college: 430Some college more than 1 year, no degree: 1,129Associate degree: 533Bachelor's degree: 1,936Master's degree: 862Professional school degree: 231Doctorate degree: 304
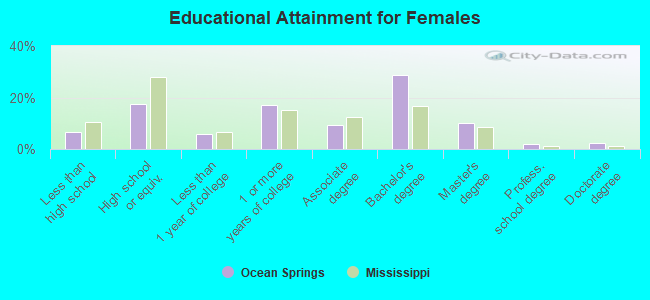
Education attainment for females 25 years and older:
No schooling: 242Nursery to 4th grade: 05th and 6th grade: 17th and 8th grade: 459th grade: 3310th grade: 6911th grade: 1312th grade, no diploma: 54High school graduate (or equivalency): 1,207Less than 1 year of college: 391Some college more than 1 year, no degree: 1,170Associate degree: 647Bachelor's degree: 1,964Master's degree: 694Professional school degree: 142Doctorate degree: 168
Housing units in structures:
One, detached: 6,608One, attached: 185Two: 2163 or 4: 2475 to 9: 44610 to 19: 27020 to 49: 16350 or more: 345Mobile homes: 98Median worth of mobile homes: $197,342
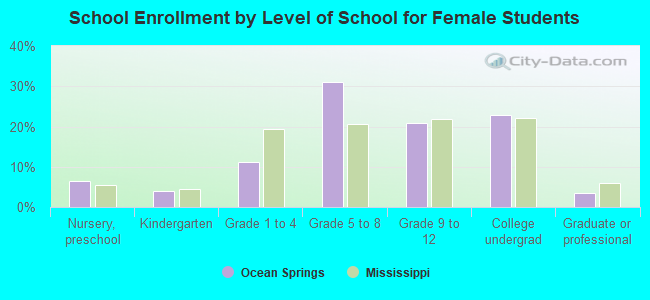
Housing units lacking complete plumbing facilities in 2022: 0.7%Housing units lacking complete kitchen facilities in 2022: 1.2%Private vs. public school enrollment:
Students in private schools in grades 1 to 8 (elementary and middle school): 246 Here:
12.1%Mississippi:
16.1%
Students in private schools in grades 9 to 12 (high school): 119 Here:
11.2%Mississippi:
14.6%
Students in private undergraduate colleges: 68 Here:
10.9%Mississippi:
12.8%