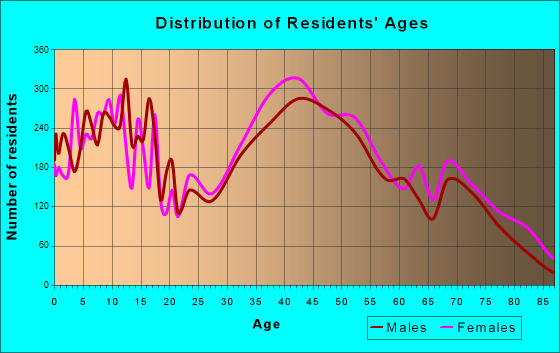
Oceanside, NY (New York) Houses and Residents
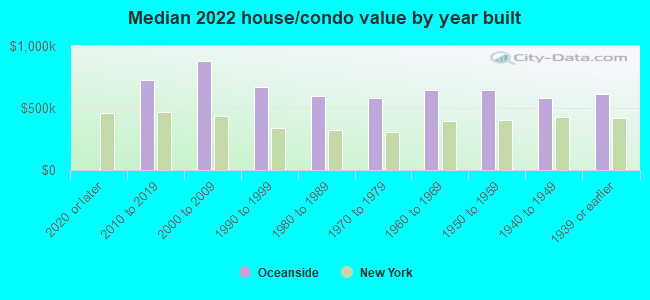
| Oceanside: | $627,850 |
| New York: | $400,400 |
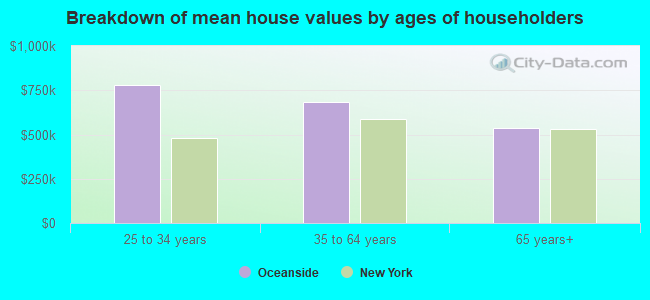
Mean price in 2022:
Detached houses: $738,256
Here: $738,256 State: $476,719 Townhouses or other attached units: $537,768
Here: $537,768 State: $699,270 In 2-unit structures: $492,737
Here: $492,737 State: $713,077 In 3-to-4-unit structures: $453,227
Here: $453,227 State: $764,568 In 5-or-more-unit structures: $334,789
Here: $334,789 State: $912,009
Total population: 32,109 (All urban)
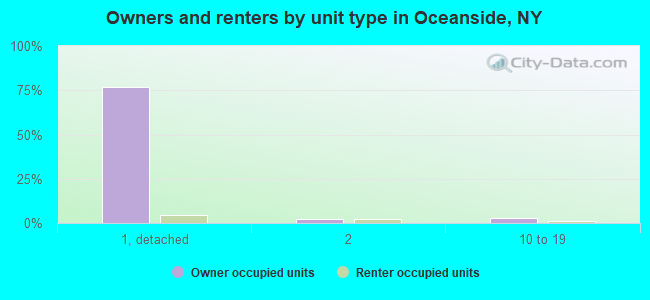
Houses: 11,199 (10,862 occupied: 9,964 owner occupied, 879 renter occupied)
| % of renters here: | 8% |
| State: | 46% |
Housing density: 2,232 houses/condos per square mile
Median price asked for vacant for-sale houses and condos in 2022: $586,611.
Median contract rent in 2022: $1,622
Median rent asked for vacant for-rent units in 2022: $4,553
Median gross rent in Oceanside, NY in 2022: $1,932
Housing units in Oceanside with a mortgage: 6,154 (924 second mortgage, 16 home equity loan, 868 both second mortgage and home equity loan)
Houses without a mortgage: 199
Median household income for houses/condos with a mortgage: $169,511
Median household income for apartments without a mortgage: $103,789
Median monthly housing costs: $2,438
Compare current foreclosures near Oceanside, NY:
| Photo | Address | Area | Beds / Baths | Price | Details |
|---|---|---|---|---|---|

|
#1
Merle Ave
Oceanside, NY 11572
|
885 sq. feet
|
1 baths 2 beds |
$450,000
|
show details |

|
#2
Oceanside Pkwy
Oceanside, NY 11572
|
1,650 sq. feet
|
2 baths 2 beds |
$545,000
|
show details |

|
#3
Christopher St
Oceanside, NY 11572
|
1,603 sq. feet
|
2 baths - beds |
show details | |

|
#4
Woods Ave
Oceanside, NY 11572
|
1,260 sq. feet
|
1 baths - beds |
show details | |

|
#5
Concord Ave
Oceanside, NY 11572
|
2,180 sq. feet
|
3 baths - beds |
show details | |

|
#6
Dennis St
Oceanside, NY 11572
|
2,029 sq. feet
|
2 baths - beds |
show details | |

|
#7
Long Beach Rd Apt 12
Oceanside, NY 11572
|
1,224 sq. feet
|
1 baths - beds |
show details | |

|
#8
Shore Rd
Oceanside, NY 11572
|
1,929 sq. feet
|
2 baths - beds |
show details | |

|
#9
Reina Rd
Oceanside, NY 11572
|
1,928 sq. feet
|
2 baths - beds |
show details | |

|
#10
Harold St
Oceanside, NY 11572
|
2,328 sq. feet
|
3 baths - beds |
show details |
| Photo | Address | Area | Beds / Baths | Price | Details |
|---|---|---|---|---|---|

|
#11
Wanamaker St
Oceanside, NY 11572
|
2,291 sq. feet
|
2 baths - beds |
show details | |

|
#12
Thorn St
Oceanside, NY 11572
|
1,211 sq. feet
|
1 baths - beds |
show details | |

|
#13
Westminster Rd
Oceanside, NY 11572
|
2,068 sq. feet
|
2 baths - beds |
show details | |

|
#14
Pearl St
Oceanside, NY 11572
|
3,134 sq. feet
|
3 baths - beds |
show details | |

|
#15
Eileen Rd
Oceanside, NY 11572
|
1,300 sq. feet
|
2 baths - beds |
show details | |

|
#16
Knight St
Oceanside, NY 11572
|
1,702 sq. feet
|
2 baths - beds |
show details | |

|
#17
George St
Oceanside, NY 11572
|
3,034 sq. feet
|
2 baths - beds |
show details | |

|
#18
Bambrick St
Oceanside, NY 11572
|
1,932 sq. feet
|
2 baths - beds |
show details | |

|
#19
Judith Ln
Oceanside, NY 11572
|
2,039 sq. feet
|
2 baths - beds |
show details | |

|
#20
Oceanside Pkwy
Oceanside, NY 11572
|
4,084 sq. feet
|
4 baths - beds |
show details |
| Photo | Address | Area | Beds / Baths | Price | Details |
|---|---|---|---|---|---|

|
#21
Virginia Ave
Oceanside, NY 11572
|
1,670 sq. feet
|
2 baths - beds |
show details | |

|
#22
Lorrie Dr
Oceanside, NY 11572
|
3,121 sq. feet
|
2 baths - beds |
show details | |

|
#23
W Henrietta Ave
Oceanside, NY 11572
|
1,666 sq. feet
|
2 baths - beds |
show details | |

|
#24
Stevens St Unit 13
Oceanside, NY 11572
|
1,296 sq. feet
|
1 baths - beds |
show details | |

|
#25
Neptune Ave
Oceanside, NY 11572
|
1,814 sq. feet
|
2 baths - beds |
show details | |

|
#26
Carrel Blvd
Oceanside, NY 11572
|
3,375 sq. feet
|
2 baths - beds |
show details | |

|
#27
Fulton Avenue
Oceanside, NY 11572
|
- sq. feet
|
- baths - beds |
show details | |

|
#28
Oceanside Rd W
Oceanside, NY 11572
|
- sq. feet
|
- baths - beds |
show details | |

|
#29
Long Beach Rd # D
Oceanside, NY 11572
|
- sq. feet
|
- baths - beds |
show details | |

|
#30
Evans Ave
Elmont, NY 11003
|
1,352 sq. feet
|
2 baths 3 beds |
$719,900
|
show details |
| Photo | Address | Area | Beds / Baths | Price | Details |
|---|---|---|---|---|---|

|
#31
Swinton Ave
Bronx, NY 10465
|
1,938 sq. feet
|
2 baths 3 beds |
$789,900
|
show details |

|
#32
Dartmouth St
Westbury, NY 11590
|
1,772 sq. feet
|
1 baths 4 beds |
$499,200
|
show details |

|
#33
90th St Apt 5d
Jackson Heights, NY 11372
|
1,000 sq. feet
|
1 baths 2 beds |
$269,900
|
show details |

|
#34
Franklin St
Elmont, NY 11003
|
1,116 sq. feet
|
2 baths 2 beds |
$679,900
|
show details |

|
#35
E Marshall St
Hempstead, NY 11550
|
1,210 sq. feet
|
2 baths 4 beds |
$479,900
|
show details |

|
#36
Tulip Ave # Gl2
Floral Park, NY 11001
|
1,200 sq. feet
|
1 baths 2 beds |
$409,900
|
show details |

|
#37
72nd Avenue
Bellerose, NY 11426
|
850 sq. feet
|
1 baths 1 beds |
$269,900
|
show details |

|
#38
Cedar Rd
Inwood, NY 11096
|
- sq. feet
|
2 baths 4 beds |
$699,000
|
show details |

|
#39
Ford Dr N
Massapequa, NY 11758
|
2,000 sq. feet
|
2 baths 5 beds |
$799,900
|
show details |

|
#40
96th St
Ozone Park, NY 11417
|
1,520 sq. feet
|
2 baths 3 beds |
$709,900
|
show details |
| Photo | Address | Area | Beds / Baths | Price | Details |
|---|---|---|---|---|---|

|
#41
A Somers St
Brooklyn, NY 11233
|
1,830 sq. feet
|
2 baths 4 beds |
$749,900
|
show details |

|
#42
Harbor Rd
Hewlett, NY 11557
|
4,549 sq. feet
|
4 baths 5 beds |
$1,155,000
|
show details |

|
#43
Ruxton St
Uniondale, NY 11553
|
1,176 sq. feet
|
1 baths 3 beds |
$450,000
|
show details |

|
#44
Bellport Ave
Wantagh, NY 11793
|
1,785 sq. feet
|
3 baths 5 beds |
$700,000
|
show details |

|
#45
Francis Lewis Blvd
Queens Village, NY 11429
|
844 sq. feet
|
1 baths 2 beds |
$589,900
|
show details |

|
#46
Belmont Pkwy
Hempstead, NY 11550
|
1,348 sq. feet
|
1 baths 3 beds |
$659,900
|
show details |

|
#47
E 32nd St Apt C7
Brooklyn, NY 11210
|
670 sq. feet
|
1 baths 1 beds |
$299,900
|
show details |

|
#48
123rd Ave
Jamaica, NY 11434
|
1,042 sq. feet
|
1 baths 3 beds |
$460,000
|
show details |

|
#49
17th Ave 1st Floor
Whitestone, NY 11357
|
610 sq. feet
|
1 baths 1 beds |
$229,900
|
show details |

|
Check over 1 million property listings on Foreclosure.com!
|
browse all offers | |||

Latest news about housing in Oceanside, NY collected exclusively by city-data.com from local newspapers, TV, and radio stations


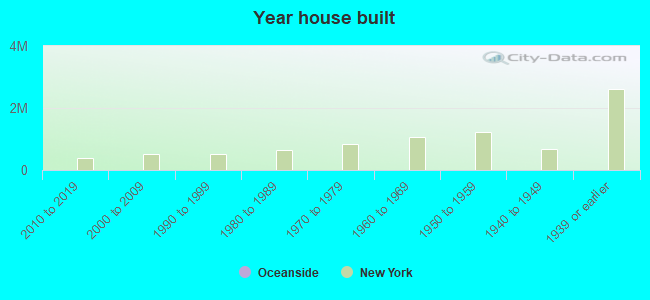
Median year apartment built: 1960
Household type by relationship:
Households: 31,364- Male householders: 5,151 (619 living alone), Female householders: 5,616 (1,332 living alone)
7,450 spouses (7,382 opposite-sex spouses), 492 unmarried partners, (492 opposite-sex unmarried partners), 10,197 children (9,707 natural, 189 adopted, 300 stepchildren), 392 grandchildren, 196 brothers or sisters, 587 parents, 148 foster children, 556 other relatives, 415 non-relatives
- In group quarters: 158
Size of family households: 3,248 2-persons, 1,985 3-persons, 2,220 4-persons, 663 5-persons, 251 6-persons, 144 7-or-more-persons.
Size of nonfamily households: 2,035 1-person, 246 2-persons, 7 3-persons, 18 4-persons, 16 5-persons.
5,060 married couples with children.
574 single-parent households (171 men, 403 women).
82.1% of residents of Oceanside speak English at home.
9.1% of residents speak Spanish at home (62% speak English very well, 25% speak English well, 11% speak English not well, 2% don't speak English at all).
5.7% of residents speak other Indo-European language at home (75% speak English very well, 18% speak English well, 6% speak English not well).
1.5% of residents speak Asian or Pacific Island language at home (47% speak English very well, 22% speak English well, 31% speak English not well).
1.1% of residents speak other language at home (84% speak English very well, 14% speak English well, 2% speak English not well).
Foreign born population: 4,702 (15.0%)
(84.1% of them are naturalized citizens)
| Here: | 6.9 |
| State: | 6.3 |
| Here: | 4.8 |
| State: | 3.8 |
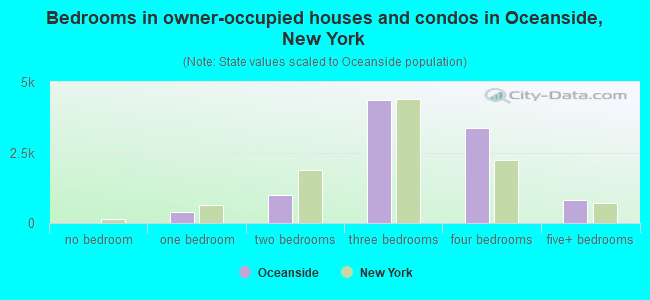
- Bedrooms in owner-occupied houses and condos in Oceanside, New York
- 8no bedroom
- 3801 bedroom
- 9942 bedrooms
- 4,3753 bedrooms
- 3,3794 bedrooms
- 8275+ bedrooms
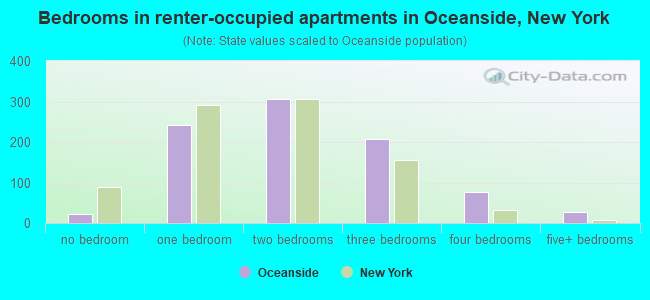
- Bedrooms in renter-occupied apartments in Oceanside, New York
- 22no bedroom
- 2421 bedroom
- 3062 bedrooms
- 2073 bedrooms
- 764 bedrooms
- 275+ bedrooms
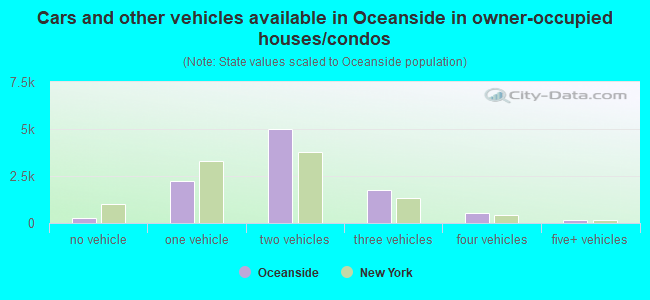
- Cars and other vehicles available in Oceanside in owner-occupied houses/condos
- 264no vehicle
- 2,2591 vehicle
- 5,0012 vehicles
- 1,7623 vehicles
- 5384 vehicles
- 1405+ vehicles
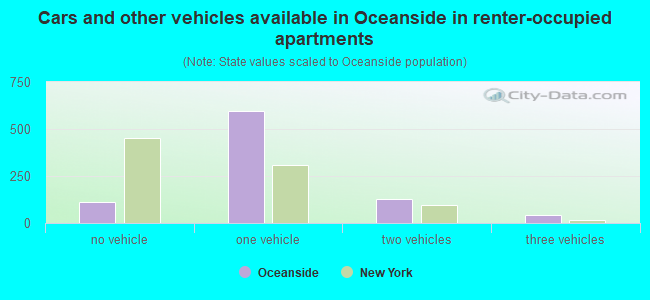
- Cars and other vehicles available in Oceanside in renter-occupied apartments
- 113no vehicle
- 5951 vehicle
- 1282 vehicles
- 433 vehicles
- 04 vehicles
- 05+ vehicles
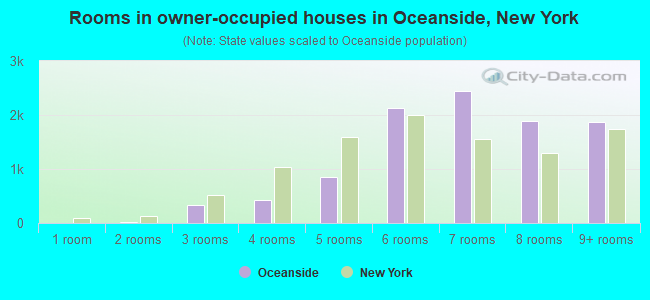
- Rooms in owner-occupied houses in Oceanside, New York
- 81 room
- 112 rooms
- 3343 rooms
- 4194 rooms
- 8605 rooms
- 2,1236 rooms
- 2,4367 rooms
- 1,8988 rooms
- 1,8759+ rooms
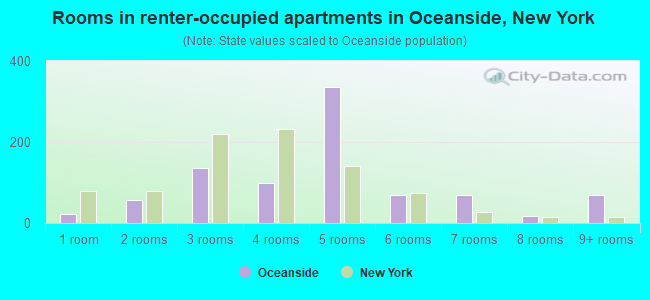
- Rooms in renter-occupied apartments in Oceanside, New York
- 221 room
- 582 rooms
- 1373 rooms
- 994 rooms
- 3375 rooms
- 706 rooms
- 697 rooms
- 178 rooms
- 699+ rooms
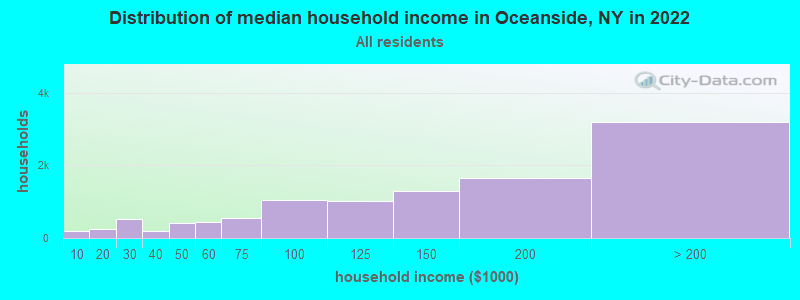
Oceanside, NY household income distribution

- 197Less than $10,000
- 260$10,000 to $19,999
- 529$20,000 to $29,999
- 200$30,000 to $39,999
- 420$40,000 to $49,999
- 450$50,000 to $59,999
- 552$60,000 to $74,999
- 1,060$75,000 to $99,999
- 1,020$100,000 to $124,999
- 1,284$125,000 to $149,999
- 1,659$150,000 to $199,999
- 3,199$200,000 or more
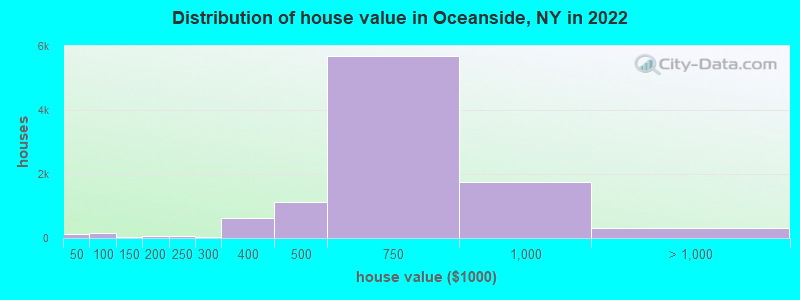
Home value of owner - occupied houses in 2022 in Oceanside, NY
-
- 56Less than $10,000
- 17$30,000 to $34,999
- 11$35,000 to $39,999
- 25$40,000 to $49,999
- 43$50,000 to $59,999
- 27$60,000 to $69,999
- 37$70,000 to $79,999
- 8$90,000 to $99,999
- 17$125,000 to $149,999
- 53$175,000 to $199,999
- 51$200,000 to $249,999
- 46$250,000 to $299,999
- 635$300,000 to $399,999
- 1,117$400,000 to $499,999
- 5,682$500,000 to $749,999
- 1,761$750,000 to $999,999
- 121$1,000,000 to $1,499,999
- 33$1,500,000 to $1,999,999
- 173$2,000,000 or more
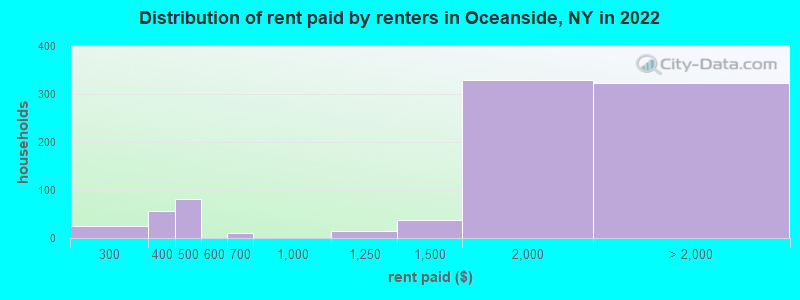
Rent paid by renters in 2022 in Oceanside, NY
-
- 15$200 to $249
- 8$250 to $299
- 44$300 to $349
- 13$350 to $399
- 7$400 to $449
- 73$450 to $499
- 10$650 to $699
- 13$1,000 to $1,249
- 38$1,250 to $1,499
- 329$1,500 to $1,999
- 86$2,000 to $2,499
- 38$2,500 to $2,999
- 20$3,000 to $3,499
- 14$3,500 or more
- 162No cash rent
Percentage of workers working in this county: 69.1%
Number of people working at home: 2,490 (15.3% of all workers)
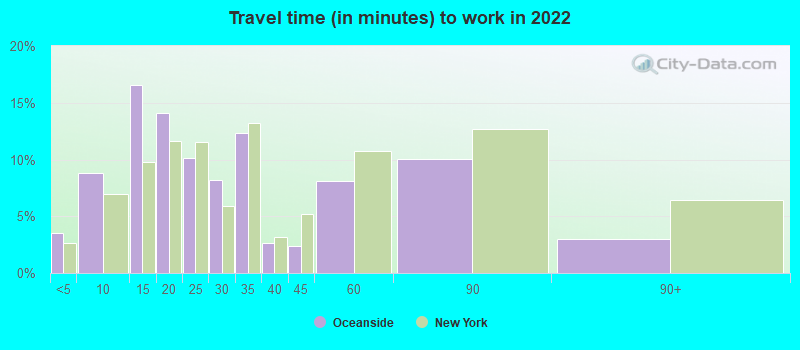
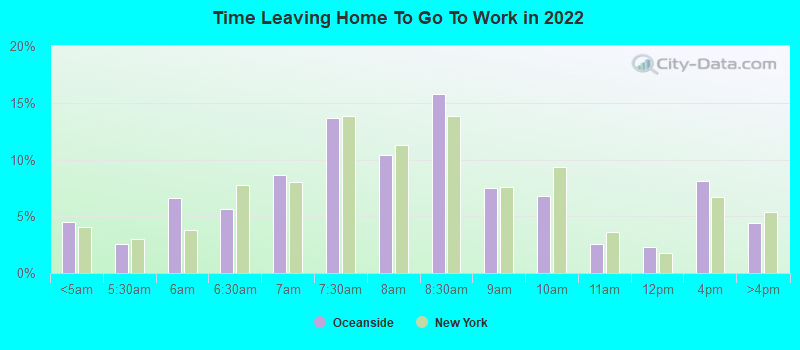
Travel time to work (commute)
- Less than 5 minutes: 388
- 5 to 9 minutes: 1,112
- 10 to 14 minutes: 1,662
- 15 to 19 minutes: 1,045
- 20 to 24 minutes: 672
- 25 to 29 minutes: 827
- 30 to 34 minutes: 1,773
- 35 to 39 minutes: 554
- 40 to 44 minutes: 615
- 45 to 59 minutes: 1,916
- 60 to 89 minutes: 2,239
- 90 or more minutes: 949
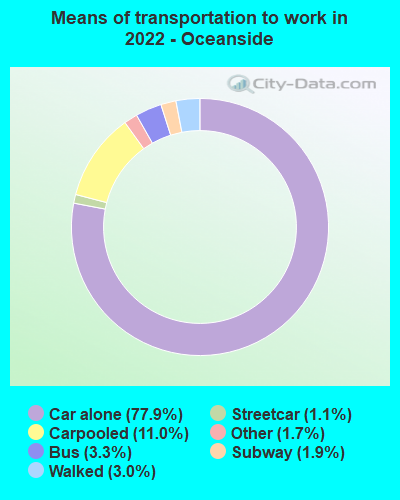
Means of transportation to work:
- Drove a car alone: 8,271 (63.2%)
- Carpooled: 1,131 (8.6%)
- Bus: 343 (2.6%)
- Subway or elevated rail: 103 (0.8%)
- Long-distance train or commuter rail: 178 (1.4%)
- Light rail, streetcar or trolley: 6 (0.0%)
- Taxi: 257 (2.0%)
- Walked: 341 (2.6%)
- Worked at home: 2,490 (19.0%)
- Unemployment by race in 2022
- Unemployment rate for White non-Hispanic residents
- 4.4%Males
- 4.0%Females
- Unemployment rate for Black residents
- 6.4%Males
- Unemployment rate for Asian residents
- 8.8%Females
- Unemployment rate for other race residents
- 14.7%Males
- 6.8%Females
- Unemployment rate for two or more race residents
- 6.1%Males
- 8.7%Females
- Unemployment rate for Hispanic or Latino residents
- 8.0%Males
- 7.4%Females
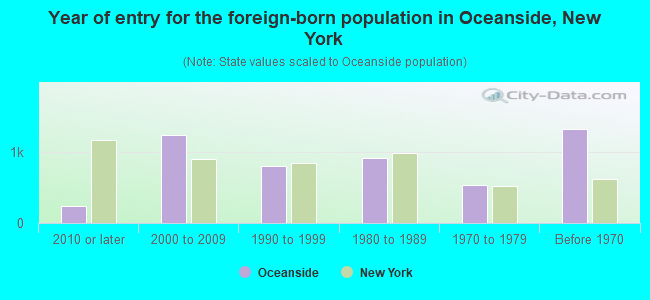
- Year of entry for the foreign-born population in Oceanside, New York
- 2322010 or later
- 1,2292000 to 2009
- 8011990 to 1999
- 9061980 to 1989
- 5341970 to 1979
- 1,317Before 1970
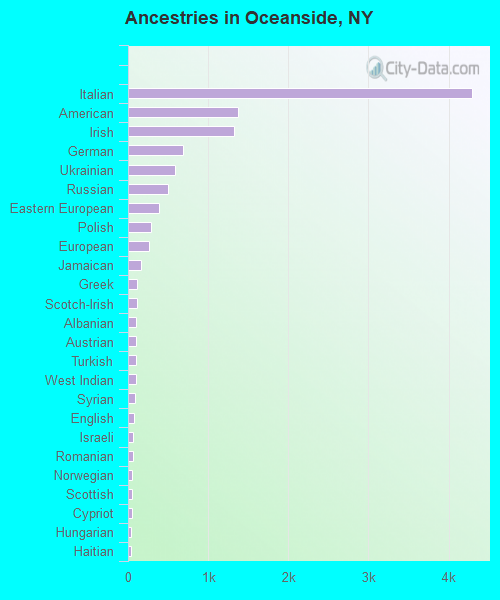
First ancestries reported:
- Italian: 4,289 (29.3%)
- American: 1,371 (9.4%)
- Irish: 1,318 (9.0%)
- German: 690 (4.7%)
- Ukrainian: 581 (4.0%)
- Russian: 493 (3.4%)
- Eastern European: 391 (2.7%)
- Polish: 285 (1.9%)
- European: 261 (1.8%)
- Jamaican: 158 (1.1%)
- Greek: 111 (0.8%)
- Scotch-Irish: 109 (0.7%)
- Albanian: 106 (0.7%)
- Austrian: 105 (0.7%)
- Turkish: 105 (0.7%)
- West Indian: 95 (0.6%)
- Syrian: 90 (0.6%)
- English: 77 (0.5%)
- Israeli: 68 (0.5%)
- Romanian: 65 (0.4%)
- Norwegian: 56 (0.4%)
- Scottish: 50 (0.3%)
- Cypriot: 47 (0.3%)
- Hungarian: 43 (0.3%)
- Haitian: 41 (0.3%)
- Dutch: 38 (0.3%)
- Jordanian: 34 (0.2%)
- Armenian: 33 (0.2%)
- Slavic: 30 (0.2%)
- British: 25 (0.2%)
- Australian: 22 (0.2%)
- Portuguese: 16 (0.1%)
- Slovak: 15 (0.1%)
- Moroccan: 11 (0.08%)
- Slovene: 11 (0.08%)
- Lebanese: 8 (0.05%)
- Belgian: 8 (0.05%)
- Canadian: 6 (0.04%)
- French: 5 (0.03%)
- Nigerian: 5 (0.03%)
- Scandinavian: 4 (0.03%)
Most common places of birth for foreign-born residents (%):
| Oceanside: | 11.3% (514) |
| New York: | 1.2% (54,759) |
| Oceanside: | 11.2% (508) |
| New York: | 11.1% (501,040) |
| Oceanside: | 8.6% (392) |
| New York: | 1.8% (81,374) |
| Oceanside: | 7.3% (334) |
| New York: | 1.7% (78,421) |
| Oceanside: | 6.2% (281) |
| New York: | 2.5% (111,920) |
| Oceanside: | 5.0% (226) |
| New York: | 0.6% (26,772) |
| Oceanside: | 4.6% (207) |
| New York: | 5.0% (227,557) |
| Oceanside: | 3.1% (142) |
| New York: | 2.0% (91,070) |
| Oceanside: | 2.6% (116) |
| New York: | 0.9% (38,713) |
| Oceanside: | 2.5% (113) |
| New York: | 3.5% (158,432) |
| Oceanside: | 2.4% (108) |
| New York: | 0.3% (11,831) |
| Oceanside: | 2.3% (103) |
| New York: | 0.5% (21,928) |
| Oceanside: | 2.2% (98) |
| New York: | 1.4% (62,442) |
| Oceanside: | 1.9% (87) |
| New York: | 0.7% (29,743) |
| Oceanside: | 1.8% (83) |
| New York: | 0.6% (28,604) |
| Oceanside: | 1.8% (80) |
| New York: | 1.4% (65,102) |
Place of birth for U.S.-born residents:
- This state: 24,858
- Other state: 1,285
- Northeast: 612
- Midwest: 205
- South: 287
- West: 173
94.2% of Oceanside residents lived in the same house 1 years ago.
Out of people who lived in different houses, 44.1% lived in this county.
Out of people who lived in different counties, 94.0% lived in New York.
| Oceanside: | 94.2% |
| State average: | 89.6% |
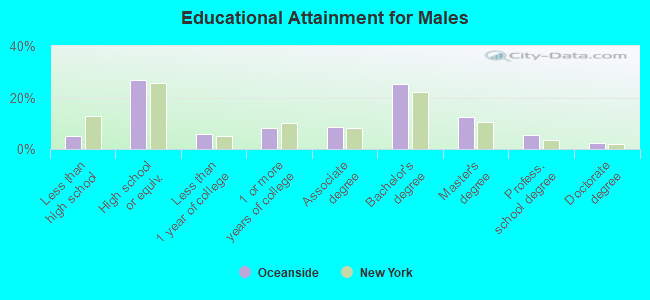
Education attainment for males 25 years and older:
- No schooling: 177
- Nursery to 4th grade: 1
- 5th and 6th grade: 36
- 7th and 8th grade: 105
- 9th grade: 1
- 10th grade: 12
- 11th grade: 23
- 12th grade, no diploma: 222
- High school graduate (or equivalency): 3,067
- Less than 1 year of college: 659
- Some college more than 1 year, no degree: 917
- Associate degree: 982
- Bachelor's degree: 2,896
- Master's degree: 1,412
- Professional school degree: 621
- Doctorate degree: 267
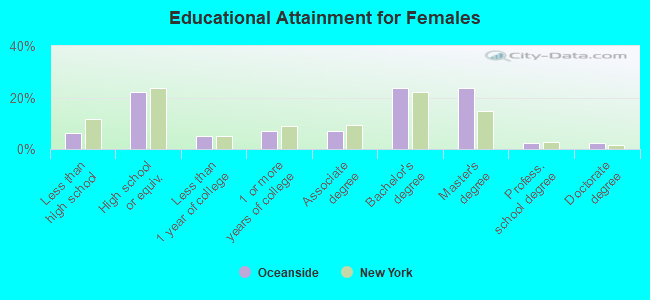
Education attainment for females 25 years and older:
- No schooling: 156
- Nursery to 4th grade: 118
- 5th and 6th grade: 39
- 7th and 8th grade: 88
- 9th grade: 8
- 10th grade: 24
- 11th grade: 66
- 12th grade, no diploma: 234
- High school graduate (or equivalency): 2,553
- Less than 1 year of college: 574
- Some college more than 1 year, no degree: 819
- Associate degree: 787
- Bachelor's degree: 2,707
- Master's degree: 2,730
- Professional school degree: 267
- Doctorate degree: 288
Housing units in structures:
- One, detached: 9,551
- One, attached: 476
- Two: 535
- 3 or 4: 109
- 5 to 9: 148
- 10 to 19: 178
- 20 to 49: 92
- 50 or more: 101
- Mobile homes: 6
Housing units lacking complete kitchen facilities in 2022: 0.4%
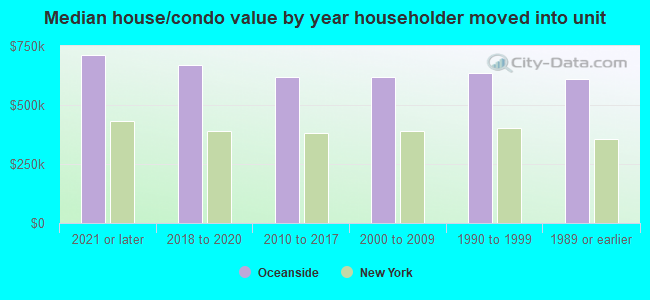
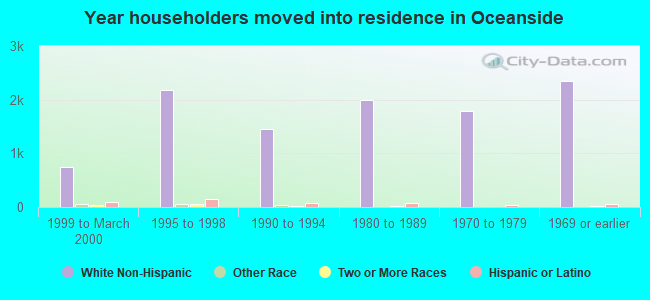
House/condo owner moved in on average 19 years ago
Renter moved in on average 10 years ago
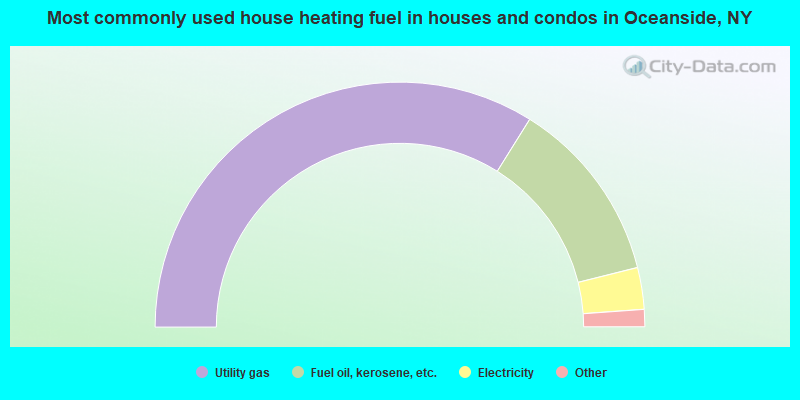
- 67.8%Utility gas
- 24.4%Fuel oil, kerosene, etc.
- 5.5%Electricity
- 1.7%Bottled, tank, or LP gas
- 0.2%Solar energy
- 0.2%Other fuel
- 0.1%Coal or coke
- 0.1%Wood
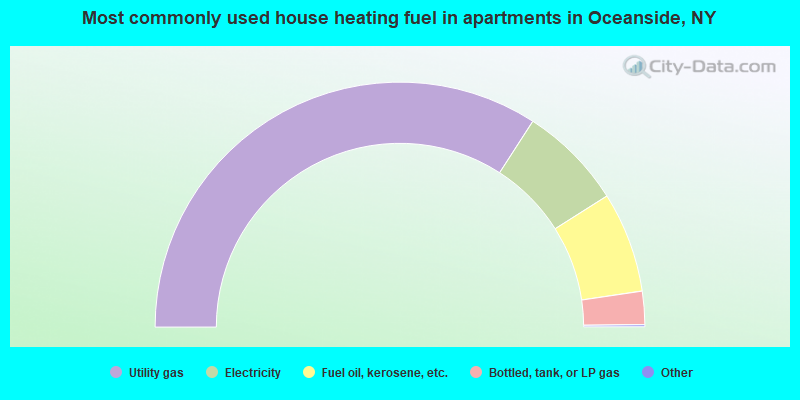
- 68.4%Utility gas
- 13.8%Electricity
- 13.3%Fuel oil, kerosene, etc.
- 4.4%Bottled, tank, or LP gas
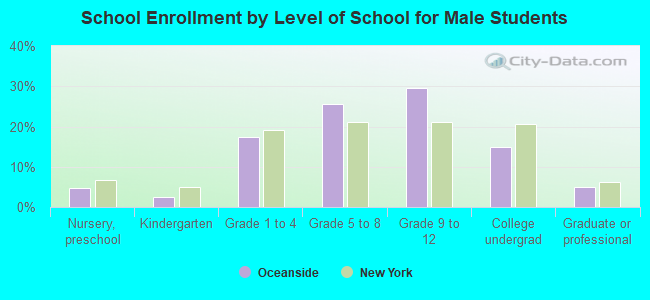
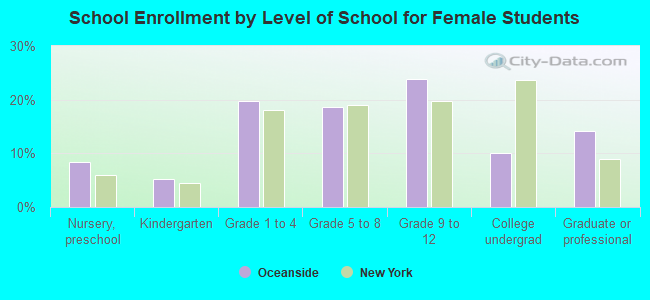
Private vs. public school enrollment:
| Here: | 5.2% |
| New York: | 15.6% |
| Here: | 4.6% |
| New York: | 15.0% |
| Here: | 43.2% |
| New York: | 39.2% |