Ohio, IL (Illinois) Houses and Residents
| Ohio: | $98,914 |
| Illinois: | $251,600 |
Mean price in 2022:
Detached houses: $100,229
Here: $100,229 State: $310,164
Total population: 498 (Urban population: 0, Rural population: 532 (19 farm, 513 nonfarm))
Houses: 272 (226 occupied: 180 owner occupied, 48 renter occupied)
| % of renters here: | 21% |
| State: | 33% |
Housing density: 361 houses/condos per square mile
Median price asked for vacant for-sale houses and condos in 2022 in this county: $675,471.
Median contract rent in 2022: $478 (lower quartile is $98, upper quartile is $567)
Median rent asked for vacant for-rent units in 2022: $487
Median gross rent in Ohio, IL in 2022: $699
Housing units in Ohio with a mortgage: 131 (34 second mortgage, 0 home equity loan, 34 both second mortgage and home equity loan)
Houses without a mortgage: 3
Median household income for houses/condos with a mortgage: $68,265
Median household income for apartments without a mortgage: $50,781
Median monthly housing costs: $876
Compare current foreclosures near Ohio, IL:
| Photo | Address | Area | Beds / Baths | Price | Details |
|---|---|---|---|---|---|

|
#1
Lincoln St
Seatonville, IL 61359
|
2,308 sq. feet
|
3 baths 4 beds |
show details | |

|
#2
E Marion St
Princeton, IL 61356
|
1,268 sq. feet
|
1 baths 2 beds |
show details | |

|
#3
2400 North Ave # -
La Moille, IL 61330
|
1,700 sq. feet
|
1 baths 4 beds |
show details | |

|
#4
Blue Heron Rd
Rock Falls, IL 61071
|
- sq. feet
|
2 baths 3 beds |
show details | |

|
#5
N Main St
Manlius, IL 61338
|
- sq. feet
|
- baths - beds |
show details | |

|
#6
Summer St
Rock Falls, IL 61071
|
- sq. feet
|
- baths - beds |
show details | |

|
#7
E Main St
Wyanet, IL 61379
|
- sq. feet
|
- baths - beds |
show details | |

|
#8
Plautz Rd
Rock Falls, IL 61071
|
- sq. feet
|
- baths - beds |
show details | |

|
#9
S Jefferson Ave
Amboy, IL 61310
|
- sq. feet
|
- baths - beds |
show details | |

|
#10
N Bailey Ave
Amboy, IL 61310
|
- sq. feet
|
- baths - beds |
show details |
| Photo | Address | Area | Beds / Baths | Price | Details |
|---|---|---|---|---|---|

|
#11
2900 North Ave
Walnut, IL 61376
|
- sq. feet
|
- baths - beds |
show details | |

|
#12
N Mercer St
Princeton, IL 61356
|
- sq. feet
|
- baths - beds |
show details | |

|
#13
N Chestnut St
Princeton, IL 61356
|
- sq. feet
|
- baths - beds |
show details | |

|
#14
W Clark St
Princeton, IL 61356
|
- sq. feet
|
- baths - beds |
show details | |

|
#15
1/2 W Marquette St
Princeton, IL 61356
|
- sq. feet
|
- baths - beds |
show details | |

|
#16
N Park Ave
Dover, IL 61323
|
- sq. feet
|
- baths - beds |
show details | |

|
#17
Pombrook Dr
Princeton, IL 61356
|
- sq. feet
|
- baths - beds |
show details | |

|
#18
2500 North Ave
La Moille, IL 61330
|
- sq. feet
|
- baths - beds |
show details | |

|
#19
Depot St
Walnut, IL 61376
|
- sq. feet
|
- baths - beds |
show details | |

|
#20
S Church St
Princeton, IL 61356
|
- sq. feet
|
- baths - beds |
show details |
| Photo | Address | Area | Beds / Baths | Price | Details |
|---|---|---|---|---|---|

|
#21
W Park St
Amboy, IL 61310
|
- sq. feet
|
- baths - beds |
show details | |

|
#22
N Chestnut St
Princeton, IL 61356
|
- sq. feet
|
- baths - beds |
show details | |

|
#23
1500 North Ave
Princeton, IL 61356
|
- sq. feet
|
- baths - beds |
show details | |

|
#24
S King St
Wyanet, IL 61379
|
- sq. feet
|
- baths - beds |
show details | |

|
#25
S King St
Wyanet, IL 61379
|
- sq. feet
|
- baths - beds |
show details | |

|
#26
Wyanet Walnut Rd
Princeton, IL 61356
|
- sq. feet
|
- baths - beds |
show details | |

|
#27
W Central Ave
Princeton, IL 61356
|
- sq. feet
|
- baths - beds |
show details | |

|
Check over 1 million property listings on Foreclosure.com!
|
browse all offers | |||

Latest news about housing in Ohio, IL collected exclusively by city-data.com from local newspapers, TV, and radio stations

 | Condos/Townhomes and Home Owners Associations...Beware? (1 reply) |
| Need advice on a condo rental, finally narrowed it down :) (3 replies) |
| Chicago 2022 (113 replies) |
| All of a Sudden the Rents in Chicago are Too Expensive! (89 replies) |
| top 3 areas to avoid in nw suburbs (84 replies) |
| WEST GARFIELD PARK : Chicago (92 replies) |

Median year apartment built: 1943
Household type by relationship:
Households: 614- Male householders: 67 (24 living alone), Female householders: 154 (33 living alone)
104 spouses (104 opposite-sex spouses), 13 unmarried partners, (12 opposite-sex unmarried partners), 249 children (235 natural, 1 adopted, 11 stepchildren), 12 grandchildren, 2 brothers or sisters, 0 parents, 0 foster children, 1 other relatives, 2 non-relatives
- In group quarters: 2
Size of family households: 72 2-persons, 42 3-persons, 29 4-persons, 8 5-persons, 11 6-persons.
Size of nonfamily households: 61 1-person, 3 2-persons.
83 married couples with children.
70 single-parent households (0 men, 70 women).
98.6% of residents of Ohio speak English at home.
0.3% of residents speak other Indo-European language at home (100% speak English very well).
Foreign born population: 5 (0.8%)
(0.0% of them are naturalized citizens)
| Here: | 7.0 |
| State: | 6.4 |
| Here: | 5.8 |
| State: | 4.1 |

- Bedrooms in owner-occupied houses and condos in Ohio, Illinois
- 0no bedroom
- 01 bedroom
- 592 bedrooms
- 673 bedrooms
- 374 bedrooms
- 175+ bedrooms

- Bedrooms in renter-occupied apartments in Ohio, Illinois
- 10no bedroom
- 91 bedroom
- 112 bedrooms
- 73 bedrooms
- 24 bedrooms
- 95+ bedrooms

- Cars and other vehicles available in Ohio in owner-occupied houses/condos
- 0no vehicle
- 471 vehicle
- 862 vehicles
- 373 vehicles
- 74 vehicles
- 35+ vehicles

- Cars and other vehicles available in Ohio in renter-occupied apartments
- 11no vehicle
- 181 vehicle
- 52 vehicles
- 143 vehicles
- 04 vehicles
- 05+ vehicles

- Rooms in owner-occupied houses in Ohio, Illinois
- 01 room
- 02 rooms
- 03 rooms
- 54 rooms
- 225 rooms
- 396 rooms
- 457 rooms
- 408 rooms
- 309+ rooms

- Rooms in renter-occupied apartments in Ohio, Illinois
- 101 room
- 62 rooms
- 33 rooms
- 04 rooms
- 25 rooms
- 86 rooms
- 07 rooms
- 58 rooms
- 149+ rooms


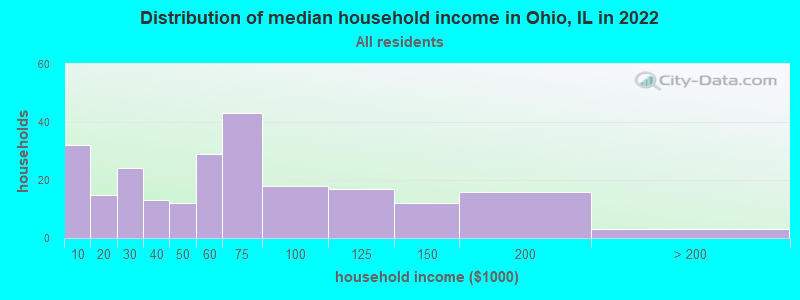
Ohio, IL household income distribution

- 32Less than $10,000
- 15$10,000 to $19,999
- 24$20,000 to $29,999
- 13$30,000 to $39,999
- 12$40,000 to $49,999
- 29$50,000 to $59,999
- 43$60,000 to $74,999
- 18$75,000 to $99,999
- 17$100,000 to $124,999
- 12$125,000 to $149,999
- 16$150,000 to $199,999
- 3$200,000 or more
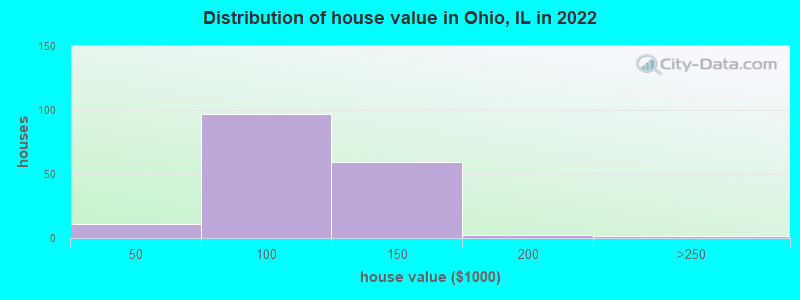
Home value of owner - occupied houses in 2022 in Ohio, IL
-
- 2Less than $10,000
- 2$10,000 to $14,999
- 0$15,000 to $19,999
- 5$40,000 to $49,999
- 6$50,000 to $59,999
- 3$60,000 to $69,999
- 27$70,000 to $79,999
- 28$80,000 to $89,999
- 25$90,000 to $99,999
- 44$100,000 to $124,999
- 15$125,000 to $149,999
- 2$175,000 to $199,999
- 1$200,000 to $249,999
Rent paid by renters in 2022 in Ohio, IL
-
- 11Less than $100
- 6$400 to $449
- 5$450 to $499
- 7$500 to $549
- 7$550 to $599
- 1$700 to $749
- 3$750 to $799


Percentage of workers working in this county: 38.9%
Number of people working at home: 2 (0.7% of all workers)
Travel time to work (commute)
- Less than 5 minutes: 25
- 5 to 9 minutes: 8
- 10 to 14 minutes: 9
- 15 to 19 minutes: 18
- 20 to 24 minutes: 35
- 25 to 29 minutes: 122
- 30 to 34 minutes: 30
- 35 to 39 minutes: 1
- 40 to 44 minutes: 1
- 45 to 59 minutes: 8
- 60 to 89 minutes: 0
- 90 or more minutes: 12
Means of transportation to work:
- Drove a car alone: 218 (82.0%)
- Carpooled: 28 (10.5%)
- Bicycle: 2 (0.8%)
- Walked: 7 (2.6%)
- Other means: 2 (0.8%)
- Worked at home: 9 (3.4%)

- Unemployment by race in 2022
- Unemployment rate for White non-Hispanic residents
- 13.9%Males
- 7.4%Females

- Year of entry for the foreign-born population in Ohio, Illinois
- 02010 or later
- 32000 to 2009
- 01990 to 1999
- 01980 to 1989
- 11970 to 1979
- 2Before 1970

First ancestries reported:
- German: 39 (33.9%)
- Irish: 20 (17.4%)
- Polish: 9 (7.8%)
- American: 7 (6.1%)
- French: 7 (6.1%)
- Swedish: 6 (5.2%)
- Italian: 5 (4.3%)
- English: 4 (3.5%)
- Belgian: 2 (1.7%)
Most common places of birth for foreign-born residents (%):
| Ohio: | 40.0% (2) |
| Illinois: | 5.2% (93,003) |
| Ohio: | 20.0% (1) |
| Illinois: | 0.1% (1,187) |
Place of birth for U.S.-born residents:
- This state: 521
- Other state: 83
- Northeast: 11
- Midwest: 37
- South: 21
- West: 14
82.4% of Ohio residents lived in the same house 1 years ago.
Out of people who lived in different houses, 21.5% lived in this county.
Out of people who lived in different counties, 97.6% lived in Illinois.
| Ohio: | 82.4% |
| State average: | 88.3% |
Education attainment for males 25 years and older:
- No schooling: 7
- Nursery to 4th grade: 0
- 5th and 6th grade: 0
- 7th and 8th grade: 0
- 9th grade: 2
- 10th grade: 0
- 11th grade: 0
- 12th grade, no diploma: 3
- High school graduate (or equivalency): 87
- Less than 1 year of college: 23
- Some college more than 1 year, no degree: 47
- Associate degree: 18
- Bachelor's degree: 11
- Master's degree: 9
- Professional school degree: 0
- Doctorate degree: 0

Education attainment for females 25 years and older:
- No schooling: 1
- Nursery to 4th grade: 0
- 5th and 6th grade: 0
- 7th and 8th grade: 0
- 9th grade: 0
- 10th grade: 26
- 11th grade: 0
- 12th grade, no diploma: 2
- High school graduate (or equivalency): 62
- Less than 1 year of college: 27
- Some college more than 1 year, no degree: 37
- Associate degree: 15
- Bachelor's degree: 17
- Master's degree: 6
- Professional school degree: 0
- Doctorate degree: 0


Housing units in structures:
- One, detached: 214
- Two: 7
- 3 or 4: 16
- 5 to 9: 10
- 10 to 19: 22
- Mobile homes: 2
Housing units lacking complete kitchen facilities in 2022: 2.6%
House/condo owner moved in on average 7 years ago
Renter moved in on average 7 years ago

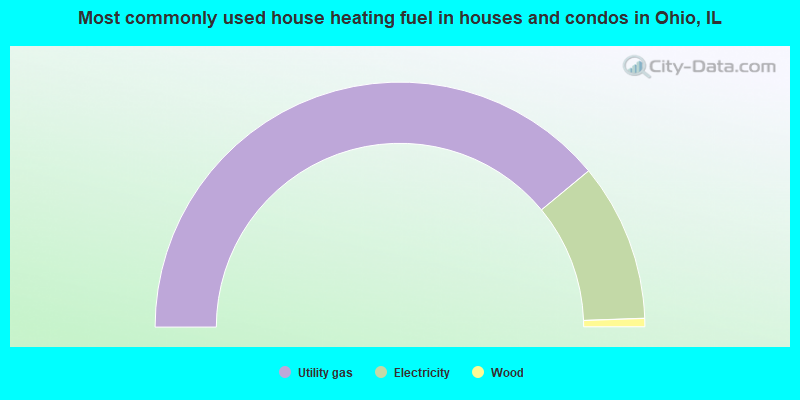
- 78.0%Utility gas
- 20.9%Electricity
- 1.1%Wood
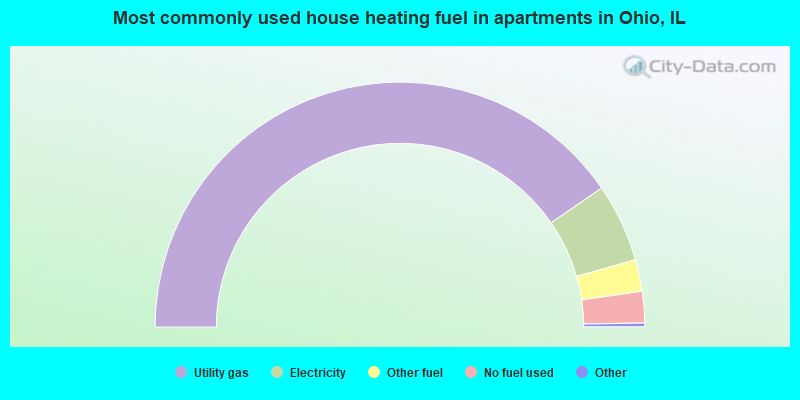
- 81.2%Utility gas
- 10.4%Electricity
- 4.2%Other fuel
- 4.2%No fuel used
Private vs. public school enrollment:
| Here: | 0.0% |
| Illinois: | 13.3% |
| Here: | 0.0% |
| Illinois: | 9.9% |
| Here: | 0.0% |
| Illinois: | 27.4% |


