Ohio, NY (New York) Houses and Residents
| Ohio: | $127,861 |
| New York: | $400,400 |
Total population: 1,002 (Urban population: 0, Rural population: 911 (all nonfarm))
Houses: 951 (351 occupied: 307 owner occupied, 44 renter occupied)
| % of renters here: | 13% |
| State: | 46% |
Housing density: 3 houses/condos per square mile
Median price asked for vacant for-sale houses and condos in 2022 in this county: $143,265.
Median contract rent in 2022: $671 (lower quartile is $446, upper quartile is $753)
Median gross rent in Ohio, NY in 2022: $1,010
Housing units in Ohio with a mortgage: 75 (3 second mortgage, 5 home equity loan, 0 both second mortgage and home equity loan)
Houses without a mortgage: 105
Compare current foreclosures near Ohio, NY:
| Photo | Address | Area | Beds / Baths | Price | Details |
|---|---|---|---|---|---|

|
#1
Old State Route 12
Remsen, NY 13438
|
1,288 sq. feet
|
2 baths 3 beds |
$83,250
|
show details |

|
#2
Bear Creek Rd
Woodgate, NY 13494
|
1,344 sq. feet
|
1 baths 3 beds |
show details | |

|
#3
Silverstone Rd
Remsen, NY 13438
|
1,280 sq. feet
|
1 baths 3 beds |
show details | |

|
#4
Conway Rd
Cold Brook, NY 13324
|
550 sq. feet
|
1 baths 2 beds |
show details | |

|
#5
Evans Rd
Remsen, NY 13438
|
1,664 sq. feet
|
2 baths 3 beds |
show details | |

|
#6
N Pond Rd
Boonville, NY 13309
|
2,000 sq. feet
|
2 baths 3 beds |
show details | |

|
#7
State Route 28
Forestport, NY 13338
|
400 sq. feet
|
1 baths - beds |
show details | |

|
#8
Warney Rd
Remsen, NY 13438
|
- sq. feet
|
- baths - beds |
show details | |

|
#9
Main St
Cold Brook, NY 13324
|
- sq. feet
|
- baths - beds |
show details | |

|
Check over 1 million property listings on Foreclosure.com!
|
browse all offers | |||
Latest news about housing in Ohio, NY collected exclusively by city-data.com from local newspapers, TV, and radio stations


Household type by relationship:
Households: 63,093- In family households: 51,519 (11,806 male householders, 5,065 female householders)
12,534 spouses, 17,823 children (16,555 natural, 377 adopted, 891 stepchildren), 1,043 grandchildren, 386 brothers or sisters, 413 parents, foster children, 395 other relatives, 1,826 non-relatives
- In nonfamily households: 11,574 (4,569 male householders (3,573 living alone)), 4,884 female householders (4,135 living alone)), 2,121 nonrelatives
- In group quarters: 1,426 (563 institutionalized population)
10,574 married couples with children.
3,947 single-parent households (1,192 men, 2,755 women).
95.8% of residents of Ohio speak English at home.
1.0% of residents speak Spanish at home (100% speak English very well).
2.7% of residents speak other Indo-European language at home (100% speak English very well).
0.5% of residents speak other language at home (100% speak English very well).
Foreign born population: 13 (1.3%)
(30.8% of them are naturalized citizens)
| Here: | 5.6 |
| State: | 6.3 |
| Here: | 5.8 |
| State: | 3.8 |

- Bedrooms in owner-occupied houses and condos in Ohio, New York
- 3no bedroom
- 381 bedroom
- 792 bedrooms
- 1473 bedrooms
- 364 bedrooms
- 45+ bedrooms

- Bedrooms in renter-occupied apartments in Ohio, New York
- 0no bedroom
- 91 bedroom
- 62 bedrooms
- 223 bedrooms
- 54 bedrooms
- 25+ bedrooms

- Cars and other vehicles available in Ohio in owner-occupied houses/condos
- 11no vehicle
- 881 vehicle
- 1362 vehicles
- 633 vehicles
- 64 vehicles
- 35+ vehicles

- Cars and other vehicles available in Ohio in renter-occupied apartments
- 0no vehicle
- 231 vehicle
- 152 vehicles
- 63 vehicles
- 04 vehicles
- 05+ vehicles

- Rooms in owner-occupied houses in Ohio, New York
- 01 room
- 112 rooms
- 163 rooms
- 524 rooms
- 965 rooms
- 556 rooms
- 447 rooms
- 188 rooms
- 159+ rooms

- Rooms in renter-occupied apartments in Ohio, New York
- 01 room
- 42 rooms
- 23 rooms
- 44 rooms
- 185 rooms
- 96 rooms
- 27 rooms
- 58 rooms
- 09+ rooms


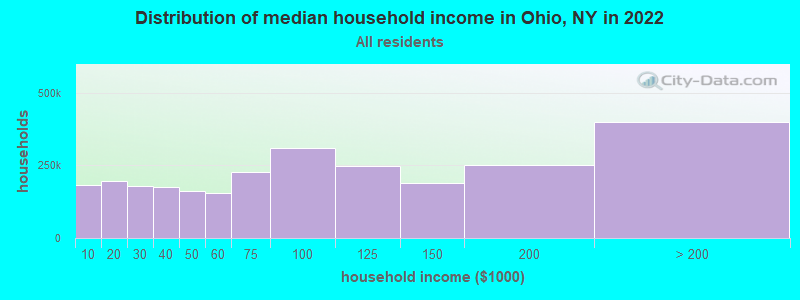
Ohio, NY household income distribution

- 29,767Less than $10,000
- 43,943$10,000 to $19,999
- 44,519$20,000 to $29,999
- 48,027$30,000 to $39,999
- 48,348$40,000 to $49,999
- 47,333$50,000 to $59,999
- 70,078$60,000 to $74,999
- 96,697$75,000 to $99,999
- 76,160$100,000 to $124,999
- 55,130$125,000 to $149,999
- 62,861$150,000 to $199,999
- 73,122$200,000 or more
Percentage of workers working in this county: 39.8%
Number of people working at home: 50 (12.0% of all workers)
Travel time to work (commute)
- Less than 5 minutes: 12
- 5 to 9 minutes: 9
- 10 to 14 minutes: 30
- 15 to 19 minutes: 21
- 20 to 24 minutes: 22
- 25 to 29 minutes: 9
- 30 to 34 minutes: 65
- 35 to 39 minutes: 23
- 40 to 44 minutes: 48
- 45 to 59 minutes: 127
- 60 to 89 minutes: 14
- 90 or more minutes: 8
Means of transportation to work:
- Drove a car alone: 319 (81.8%)
- Carpooled: 55 (14.1%)
- Bicycle: 2 (0.5%)
- Walked: 10 (2.6%)
- Other means: 2 (0.5%)
- Worked at home: 2 (0.5%)


- Year of entry for the foreign-born population in Ohio, New York
- 01995 to March 2000
- 21990 to 1994
- 01985 to 1989
- 01980 to 1984
- 01975 to 1979
- 41970 to 1974
- 01965 to 1969
- 3Before 1965

First ancestries reported:
- Irish: 257 (21.3%)
- German: 186 (15.4%)
- Other: 116 (9.6%)
- French: 106 (8.8%)
- Polish: 103 (8.5%)
- English: 82 (6.8%)
- United States: 81 (6.7%)
- Italian: 73 (6.0%)
- Dutch: 48 (4.0%)
- Scottish: 39 (3.2%)
- Welsh: 34 (2.8%)
- French Canadian: 32 (2.7%)
- Scotch-Irish: 20 (1.7%)
- Ukrainian: 7 (0.6%)
- Czech: 5 (0.4%)
- Danish: 4 (0.3%)
- Hungarian: 3 (0.2%)
- Lithuanian: 2 (0.2%)
- Norwegian: 2 (0.2%)
- Russian: 2 (0.2%)
- Slovak: 2 (0.2%)
- Swedish: 2 (0.2%)
- Arab: 1 (0.08%)
Most common places of birth for foreign-born residents (%):
| Ohio: | 77.8% (7) |
| New York: | 1.4% (54,876) |
| Ohio: | 22.2% (2) |
| New York: | 0.3% (11,866) |
Place of birth for U.S.-born residents:
- This state: 828
- Other state: 69
- Northeast: 28
- Midwest: 6
- South: 33
- West: 2
76% of Ohio residents lived in the same house 5 years ago.
Out of people who lived in different houses, 64% lived in this county.
Out of people who lived in different counties, 67% lived in New York.
Education attainment for males 25 years and older:
- No schooling: 0
- Nursery to 4th grade: 0
- 5th and 6th grade: 6
- 7th and 8th grade: 18
- 9th grade: 11
- 10th grade: 18
- 11th grade: 26
- 12th grade, no diploma: 18
- High school graduate (or equivalency): 127
- Less than 1 year of college: 4
- Some college more than 1 year, no degree: 10
- Associate degree: 37
- Bachelor's degree: 13
- Master's degree: 18
- Professional school degree: 2
- Doctorate degree: 0

Education attainment for females 25 years and older:
- No schooling: 0
- Nursery to 4th grade: 3
- 5th and 6th grade: 0
- 7th and 8th grade: 10
- 9th grade: 13
- 10th grade: 10
- 11th grade: 8
- 12th grade, no diploma: 7
- High school graduate (or equivalency): 128
- Less than 1 year of college: 10
- Some college more than 1 year, no degree: 28
- Associate degree: 38
- Bachelor's degree: 6
- Master's degree: 19
- Professional school degree: 4
- Doctorate degree: 0


Housing units in structures:
- One, detached: 831
- One, attached: 6
- Two: 2
- 3 or 4: 4
- Mobile homes: 108
Median worth of mobile homes: $55,126
Housing units lacking complete kitchen facilities: 23.6%

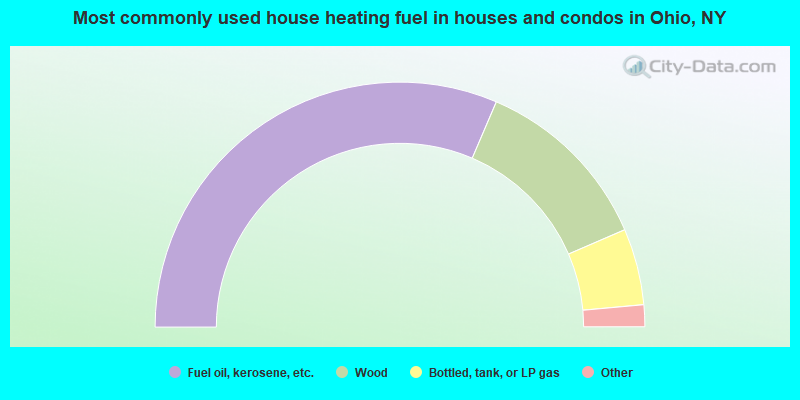
- 62.9%Fuel oil, kerosene, etc.
- 24.1%Wood
- 10.1%Bottled, tank, or LP gas
- 1.6%Electricity
- 0.7%Utility gas
- 0.7%Coal or coke
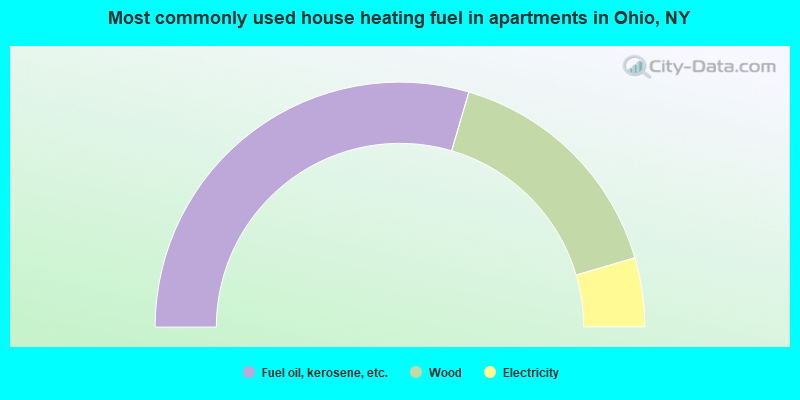
- 59.1%Fuel oil, kerosene, etc.
- 31.8%Wood
- 9.1%Electricity
Private vs. public school enrollment:
| Here: | 0.0% |
| New York: | 14.0% |
| Here: | 0.0% |
| New York: | 13.2% |
| Here: | 4.5% |
| New York: | 38.2% |


