Ojibwa, WI (Wisconsin) Houses and Residents
| Ojibwa: | $194,830 |
| Wisconsin: | $252,800 |
Total population: 249 (Urban population: 0, Rural population: 282 (5 farm, 277 nonfarm))
Houses: 270 (103 occupied: 96 owner occupied, 7 renter occupied)
| % of renters here: | 7% |
| State: | 32% |
Housing density: 5 houses/condos per square mile
Median price asked for vacant for-sale houses and condos in 2022 in this county: $149,312.
Median contract rent in 2022: $708 (lower quartile is $813, upper quartile is $781)
Median rent asked for vacant for-rent units in 2022: $164
Median gross rent in Ojibwa, WI in 2022: $998
Housing units in Ojibwa with a mortgage: 36 (2 second mortgage, 0 home equity loan, 0 both second mortgage and home equity loan)
Houses without a mortgage: 13


Latest news about housing in Ojibwa, WI collected exclusively by city-data.com from local newspapers, TV, and radio stations


Household type by relationship:
Households: 16,232- In family households: 13,344 (3,046 male householders, 1,610 female householders)
3,516 spouses, 3,927 children (3,644 natural, 93 adopted, 190 stepchildren), 348 grandchildren, 119 brothers or sisters, 132 parents, foster children, 151 other relatives, 445 non-relatives
- In nonfamily households: 2,888 (1,314 male householders (1,052 living alone)), 1,068 female householders (911 living alone)), 506 nonrelatives
- In group quarters: 325 (301 institutionalized population)
2,400 married couples with children.
1,156 single-parent households (319 men, 837 women).
95.8% of residents of Ojibwa speak English at home.
2.3% of residents speak other Indo-European language at home (67% speak English very well, 33% speak English not well).
1.9% of residents speak other language at home (100% speak English very well).
Foreign born population: 8 (2.4%)
(37.5% of them are naturalized citizens)
| Here: | 5.5 |
| State: | 6.5 |
| Here: | 4.7 |
| State: | 4.1 |

- Bedrooms in owner-occupied houses and condos in Ojibwa, Wisconsin
- 0no bedroom
- 111 bedroom
- 362 bedrooms
- 303 bedrooms
- 174 bedrooms
- 25+ bedrooms

- Bedrooms in renter-occupied apartments in Ojibwa, Wisconsin
- 0no bedroom
- 01 bedroom
- 42 bedrooms
- 33 bedrooms
- 04 bedrooms
- 05+ bedrooms

- Cars and other vehicles available in Ojibwa in owner-occupied houses/condos
- 0no vehicle
- 181 vehicle
- 522 vehicles
- 143 vehicles
- 94 vehicles
- 35+ vehicles

- Cars and other vehicles available in Ojibwa in renter-occupied apartments
- 0no vehicle
- 21 vehicle
- 52 vehicles
- 03 vehicles
- 04 vehicles
- 05+ vehicles

- Rooms in owner-occupied houses in Ojibwa, Wisconsin
- 01 room
- 02 rooms
- 113 rooms
- 184 rooms
- 315 rooms
- 146 rooms
- 127 rooms
- 28 rooms
- 89+ rooms

- Rooms in renter-occupied apartments in Ojibwa, Wisconsin
- 01 room
- 02 rooms
- 23 rooms
- 24 rooms
- 35 rooms
- 06 rooms
- 07 rooms
- 08 rooms
- 09+ rooms


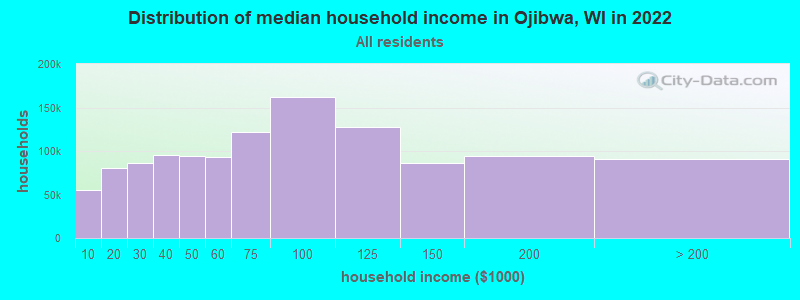
Ojibwa, WI household income distribution

- 28,806Less than $10,000
- 41,769$10,000 to $19,999
- 48,237$20,000 to $29,999
- 51,963$30,000 to $39,999
- 56,142$40,000 to $49,999
- 57,038$50,000 to $59,999
- 75,216$60,000 to $74,999
- 106,710$75,000 to $99,999
- 91,414$100,000 to $124,999
- 60,662$125,000 to $149,999
- 65,581$150,000 to $199,999
- 57,359$200,000 or more
Percentage of workers working in this county: 67.2%
Number of people working at home: 14 (11.8% of all workers)
Travel time to work (commute)
- Less than 5 minutes: 4
- 5 to 9 minutes: 11
- 10 to 14 minutes: 18
- 15 to 19 minutes: 5
- 20 to 24 minutes: 7
- 25 to 29 minutes: 4
- 30 to 34 minutes: 18
- 35 to 39 minutes: 0
- 40 to 44 minutes: 15
- 45 to 59 minutes: 7
- 60 to 89 minutes: 9
- 90 or more minutes: 3
Means of transportation to work:
- Drove a car alone: 88 (83.0%)
- Carpooled: 9 (8.5%)
- Walked: 4 (3.8%)
- Worked at home: 5 (4.7%)


- Year of entry for the foreign-born population in Ojibwa, Wisconsin
- 01995 to March 2000
- 21990 to 1994
- 01985 to 1989
- 01980 to 1984
- 01975 to 1979
- 01970 to 1974
- 01965 to 1969
- 2Before 1965

First ancestries reported:
- German: 105 (26.9%)
- Irish: 61 (15.6%)
- English: 44 (11.3%)
- Polish: 40 (10.3%)
- Swedish: 30 (7.7%)
- Other: 20 (5.1%)
- Czech: 17 (4.4%)
- French: 17 (4.4%)
- Swiss: 14 (3.6%)
- Scottish: 13 (3.3%)
- Norwegian: 8 (2.1%)
- Danish: 7 (1.8%)
- Hungarian: 3 (0.8%)
- Russian: 3 (0.8%)
- Dutch: 2 (0.5%)
- Italian: 2 (0.5%)
- Scotch-Irish: 2 (0.5%)
- United States: 2 (0.5%)
Most common places of birth for foreign-born residents (%):
| Ojibwa: | 50.0% (2) |
| Wisconsin: | 7.2% (13,863) |
| Ojibwa: | 50.0% (2) |
| Wisconsin: | 1.5% (2,863) |
Place of birth for U.S.-born residents:
- This state: 206
- Other state: 72
- Northeast: 2
- Midwest: 59
- South: 5
- West: 6
70% of Ojibwa residents lived in the same house 5 years ago.
Out of people who lived in different houses, 25% lived in this county.
Out of people who lived in different counties, 53% lived in Wisconsin.
Education attainment for males 25 years and older:
- No schooling: 0
- Nursery to 4th grade: 0
- 5th and 6th grade: 0
- 7th and 8th grade: 4
- 9th grade: 0
- 10th grade: 0
- 11th grade: 1
- 12th grade, no diploma: 5
- High school graduate (or equivalency): 57
- Less than 1 year of college: 3
- Some college more than 1 year, no degree: 9
- Associate degree: 6
- Bachelor's degree: 6
- Master's degree: 3
- Professional school degree: 0
- Doctorate degree: 0

Education attainment for females 25 years and older:
- No schooling: 0
- Nursery to 4th grade: 0
- 5th and 6th grade: 0
- 7th and 8th grade: 0
- 9th grade: 0
- 10th grade: 0
- 11th grade: 2
- 12th grade, no diploma: 0
- High school graduate (or equivalency): 60
- Less than 1 year of college: 11
- Some college more than 1 year, no degree: 6
- Associate degree: 5
- Bachelor's degree: 9
- Master's degree: 0
- Professional school degree: 3
- Doctorate degree: 0


Housing units in structures:
- One, detached: 252
- Mobile homes: 18
Median worth of mobile homes: $81,112
Housing units lacking complete kitchen facilities: 18.5%

Private vs. public school enrollment:
| Here: | 0.0% |
| Wisconsin: | 16.4% |
| Here: | 0.0% |
| Wisconsin: | 9.1% |
| Here: | 50.0% |
| Wisconsin: | 18.1% |


