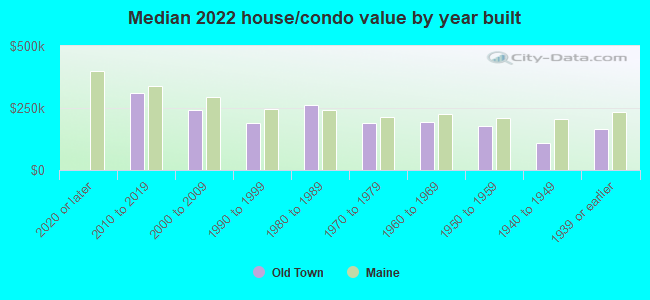
Old Town, ME (Maine) Houses and Residents
| Old Town: | $188,292 |
| Maine: | $290,600 |
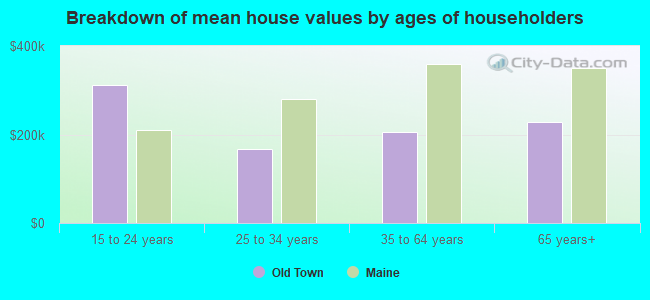
Mean price in 2022:
Detached houses: $220,913
Here: $220,913 State: $364,324 In 2-unit structures: $187,084
Here: $187,084 State: $349,654 Mobile homes: $47,749
Here: $47,749 State: $142,980
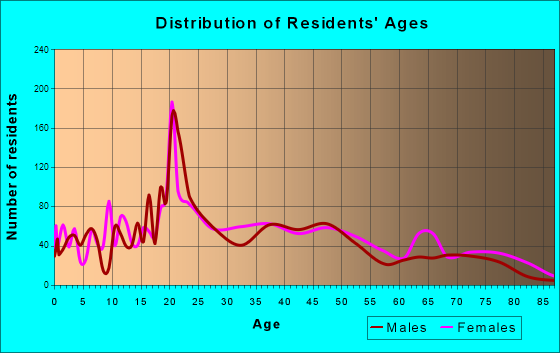
Total population: 7,693 (Urban population: 6,212, Rural population: 1,921 (49 farm, 1,872 nonfarm))
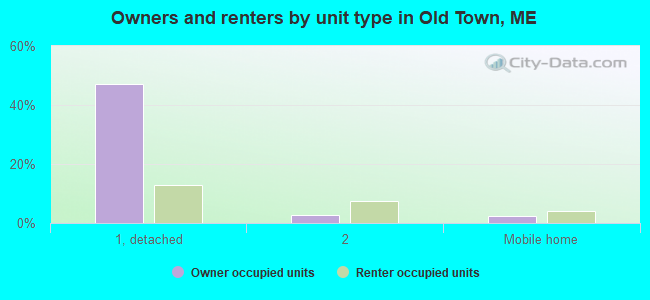
Houses: 3,763 (3,166 occupied: 1,762 owner occupied, 1,494 renter occupied)
| % of renters here: | 46% |
| State: | 26% |
Housing density: 98 houses/condos per square mile
Median price asked for vacant for-sale houses and condos in 2022 in this county: $296,806.
Median contract rent in 2022: $907 (lower quartile is $656, upper quartile is $1,036)
Median rent asked for vacant for-rent units in 2022: $1,170
Median gross rent in Old Town, ME in 2022: $923
Housing units in Old Town with a mortgage: 931 (180 second mortgage, 0 home equity loan, 166 both second mortgage and home equity loan)
Houses without a mortgage: 0
Median household income for houses/condos with a mortgage: $98,947
Median household income for apartments without a mortgage: $58,791
Median monthly housing costs: $968
Compare current foreclosures near Old Town, ME:
| Photo | Address | Area | Beds / Baths | Price | Details |
|---|---|---|---|---|---|

|
#1
Lincoln St
Old Town, ME 04468
|
725 sq. feet
|
1 baths 3 beds |
show details | |

|
#2
Summer St
Old Town, ME 04468
|
- sq. feet
|
- baths - beds |
show details | |

|
#3
Davenport St
Milford, ME 04461
|
1,200 sq. feet
|
2 baths 3 beds |
$269,900
|
show details |

|
#4
Warren St
Bangor, ME 04401
|
2,842 sq. feet
|
3 baths 5 beds |
show details | |

|
#5
Upper Cross Rd
Hudson, ME 04449
|
1,344 sq. feet
|
2 baths 3 beds |
show details | |

|
#6
Kenduskeag Levant Rd
Kenduskeag, ME 04450
|
- sq. feet
|
2 baths 3 beds |
show details | |

|
#7
Smokey Ln
Bangor, ME 04401
|
2,434 sq. feet
|
2 baths 3 beds |
show details | |

|
#8
Grove St
Bangor, ME 04401
|
910 sq. feet
|
1 baths 3 beds |
show details | |

|
#9
Allen St
Bangor, ME 04401
|
1,200 sq. feet
|
1 baths 3 beds |
show details | |

|
#10
Elm St
Bangor, ME 04401
|
- sq. feet
|
2 baths 4 beds |
show details |
| Photo | Address | Area | Beds / Baths | Price | Details |
|---|---|---|---|---|---|

|
#11
Stillwater Ave
Bangor, ME 04401
|
- sq. feet
|
- baths - beds |
show details | |

|
#12
Baker Blvd Ste 205
Brewer, ME 04412
|
- sq. feet
|
- baths - beds |
show details | |

|
#13
Broadway
Kenduskeag, ME 04450
|
- sq. feet
|
- baths - beds |
show details | |

|
#14
Pleasant Hill Ln
Orrington, ME 04474
|
- sq. feet
|
- baths - beds |
show details | |

|
#15
Pine St # B
Bangor, ME 04401
|
- sq. feet
|
- baths - beds |
show details | |

|
#16
Harris Rd Apt 31
Orono, ME 04473
|
- sq. feet
|
- baths - beds |
show details | |

|
#17
Cedar St Apt 4
Bangor, ME 04401
|
- sq. feet
|
- baths - beds |
show details | |

|
#18
Call Rd # D
Milford, ME 04461
|
- sq. feet
|
- baths - beds |
show details | |
|
|
#19
York Rd
Bangor, ME 04401
|
- sq. feet
|
- baths - beds |
show details | |

|
#20
Kenduskeag Ave # 24
Bangor, ME 04401
|
- sq. feet
|
- baths - beds |
show details |
| Photo | Address | Area | Beds / Baths | Price | Details |
|---|---|---|---|---|---|

|
#21
Hudson Hill Rd
Hudson, ME 04449
|
- sq. feet
|
- baths - beds |
show details | |

|
#22
Treats Falls Dr
Brewer, ME 04412
|
- sq. feet
|
- baths - beds |
show details | |

|
#23
Hudson Rd
Hudson, ME 04449
|
- sq. feet
|
- baths - beds |
show details | |

|
#24
Cedar Breeze N
Bangor, ME 04401
|
- sq. feet
|
- baths - beds |
show details | |

|
#25
Aa Landing Rd
Bangor, ME 04401
|
- sq. feet
|
- baths - beds |
show details | |

|
#26
Greenfield Rd
Greenbush, ME 04418
|
- sq. feet
|
- baths - beds |
show details | |

|
#27
Railroad Ln
Holden, ME 04429
|
- sq. feet
|
- baths - beds |
show details | |

|
Check over 1 million property listings on Foreclosure.com!
|
browse all offers | |||


 | Looking to move outside Bangor with kids (6 replies) |
| Main Street, Orono (4 replies) |
| Thinking of relocating to Old Town - smell? (4 replies) |
| Housing in Orono (34 replies) |
| Bangor area schools (4 replies) |
| Attic Fire Undisclosed (8 replies) |
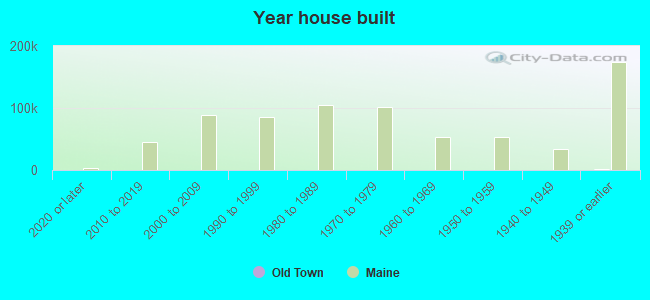
Median year apartment built: 1963
Household type by relationship:
Households: 7,509- Male householders: 1,362 (353 living alone), Female householders: 1,804 (594 living alone)
1,283 spouses (1,283 opposite-sex spouses), 260 unmarried partners, (251 opposite-sex unmarried partners), 1,515 children (1,477 natural, 29 adopted, 9 stepchildren), 153 grandchildren, 31 brothers or sisters, 87 parents, 0 foster children, 121 other relatives, 883 non-relatives
- In group quarters: 6
Size of family households: 764 2-persons, 442 3-persons, 256 4-persons, 70 5-persons, 193 6-persons, 42 7-or-more-persons.
Size of nonfamily households: 991 1-person, 426 2-persons, 18 3-persons, 42 4-persons, 2 5-persons.
710 married couples with children.
273 single-parent households (85 men, 188 women).
96.4% of residents of Old Town speak English at home.
0.1% of residents speak Spanish at home (100% speak English very well).
2.9% of residents speak other Indo-European language at home (93% speak English very well, 7% speak English well).
0.7% of residents speak other language at home (82% speak English very well, 18% speak English not well).
Foreign born population: 146 (1.9%)
(57.5% of them are naturalized citizens)
| Here: | 5.6 |
| State: | 6.1 |
| Here: | 4.5 |
| State: | 4.0 |
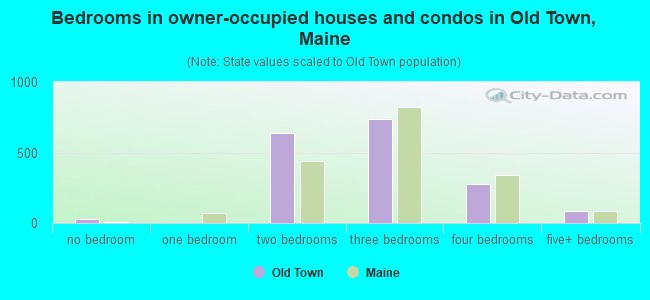
- Bedrooms in owner-occupied houses and condos in Old Town, Maine
- 26no bedroom
- 21 bedroom
- 6382 bedrooms
- 7373 bedrooms
- 2764 bedrooms
- 835+ bedrooms
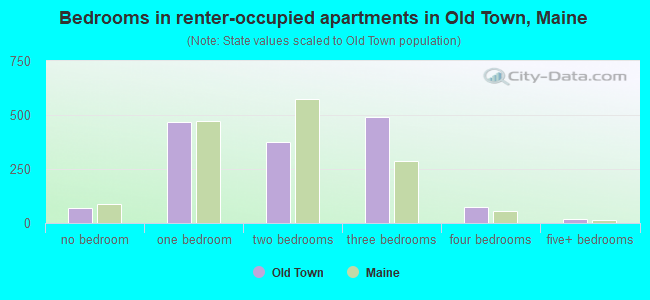
- Bedrooms in renter-occupied apartments in Old Town, Maine
- 71no bedroom
- 4661 bedroom
- 3752 bedrooms
- 4923 bedrooms
- 744 bedrooms
- 175+ bedrooms
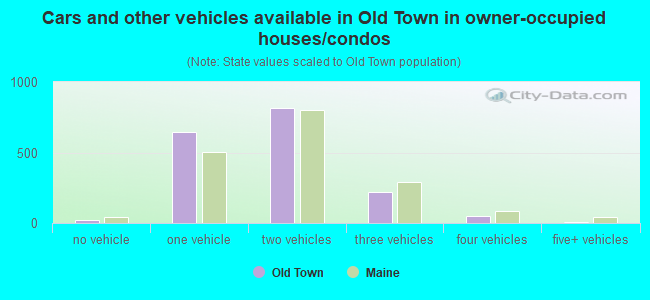
- Cars and other vehicles available in Old Town in owner-occupied houses/condos
- 22no vehicle
- 6461 vehicle
- 8152 vehicles
- 2223 vehicles
- 484 vehicles
- 105+ vehicles
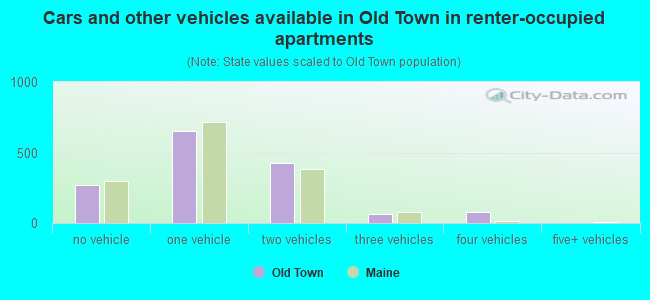
- Cars and other vehicles available in Old Town in renter-occupied apartments
- 272no vehicle
- 6511 vehicle
- 4262 vehicles
- 663 vehicles
- 774 vehicles
- 25+ vehicles
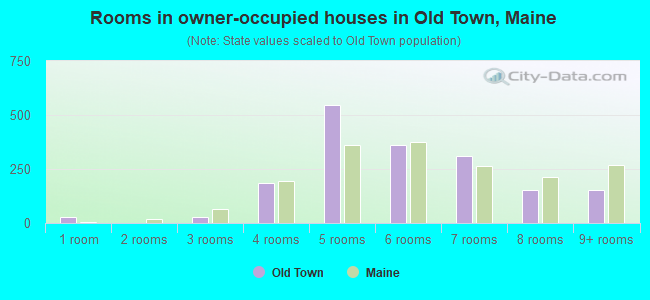
- Rooms in owner-occupied houses in Old Town, Maine
- 261 room
- 22 rooms
- 263 rooms
- 1864 rooms
- 5445 rooms
- 3616 rooms
- 3097 rooms
- 1548 rooms
- 1549+ rooms
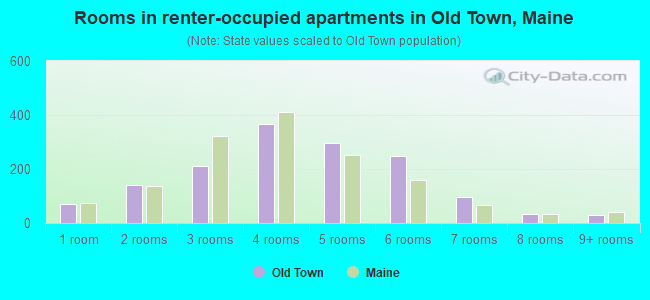
- Rooms in renter-occupied apartments in Old Town, Maine
- 711 room
- 1392 rooms
- 2103 rooms
- 3684 rooms
- 2955 rooms
- 2476 rooms
- 977 rooms
- 358 rooms
- 319+ rooms
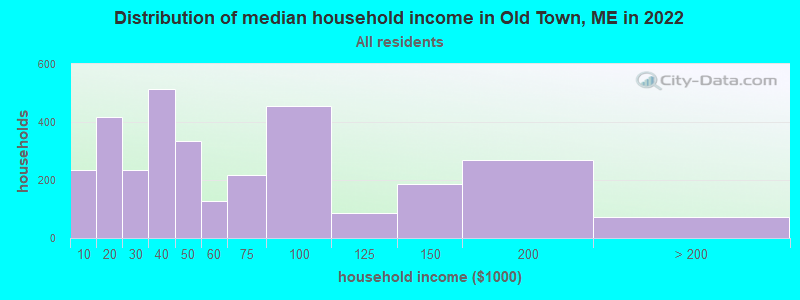
Old Town, ME household income distribution

- 233Less than $10,000
- 416$10,000 to $19,999
- 236$20,000 to $29,999
- 514$30,000 to $39,999
- 333$40,000 to $49,999
- 128$50,000 to $59,999
- 216$60,000 to $74,999
- 454$75,000 to $99,999
- 86$100,000 to $124,999
- 186$125,000 to $149,999
- 268$150,000 to $199,999
- 71$200,000 or more
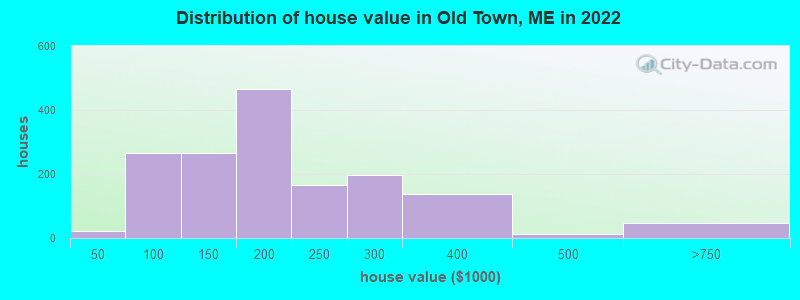
Home value of owner - occupied houses in 2022 in Old Town, ME
-
- 9$10,000 to $14,999
- 5$15,000 to $19,999
- 6$20,000 to $24,999
- 12$50,000 to $59,999
- 19$60,000 to $69,999
- 8$70,000 to $79,999
- 188$80,000 to $89,999
- 37$90,000 to $99,999
- 98$100,000 to $124,999
- 167$125,000 to $149,999
- 256$150,000 to $174,999
- 210$175,000 to $199,999
- 165$200,000 to $249,999
- 198$250,000 to $299,999
- 137$300,000 to $399,999
- 13$400,000 to $499,999
- 45$500,000 to $749,999
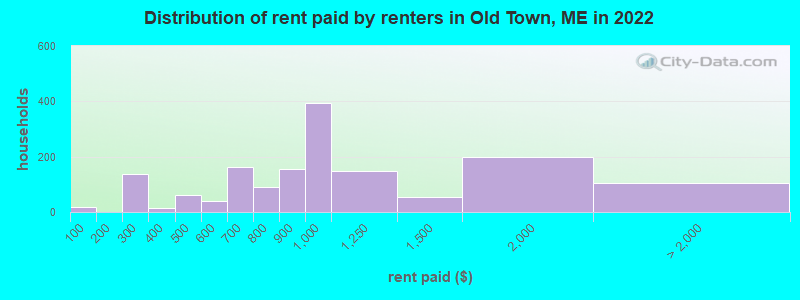
Rent paid by renters in 2022 in Old Town, ME
-
- 17Less than $100
- 117$200 to $249
- 18$250 to $299
- 12$300 to $349
- 27$400 to $449
- 34$450 to $499
- 7$500 to $549
- 31$550 to $599
- 40$600 to $649
- 122$650 to $699
- 45$700 to $749
- 43$750 to $799
- 157$800 to $899
- 394$900 to $999
- 149$1,000 to $1,249
- 53$1,250 to $1,499
- 198$1,500 to $1,999
- 2$2,000 to $2,499
- 102No cash rent
Percentage of workers working in this county: 94.5%
Number of people working at home: 645 (16.7% of all workers)
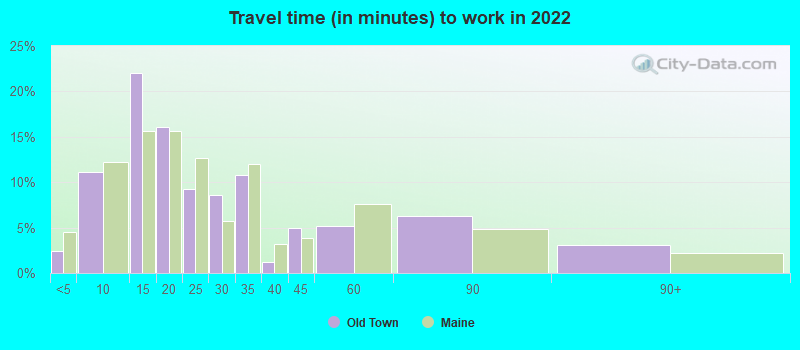
Travel time to work (commute)
- Less than 5 minutes: 131
- 5 to 9 minutes: 417
- 10 to 14 minutes: 692
- 15 to 19 minutes: 388
- 20 to 24 minutes: 742
- 25 to 29 minutes: 231
- 30 to 34 minutes: 248
- 35 to 39 minutes: 21
- 40 to 44 minutes: 51
- 45 to 59 minutes: 46
- 60 to 89 minutes: 139
- 90 or more minutes: 21
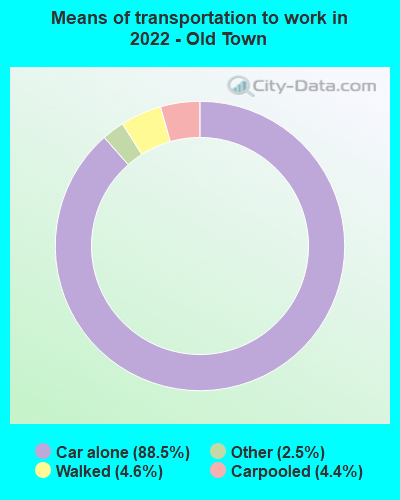
Means of transportation to work:
- Drove a car alone: 2,483 (70.7%)
- Carpooled: 124 (3.5%)
- Taxi: 102 (2.9%)
- Walked: 135 (3.8%)
- Worked at home: 645 (18.4%)
- Unemployment by race in 2022
- Unemployment rate for White non-Hispanic residents
- 1.7%Males
- 0.7%Females
- Unemployment rate for two or more race residents
- 45.5%Females
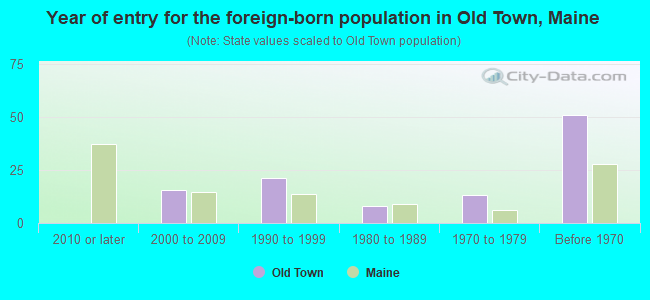
- Year of entry for the foreign-born population in Old Town, Maine
- 02010 or later
- 152000 to 2009
- 211990 to 1999
- 81980 to 1989
- 131970 to 1979
- 51Before 1970
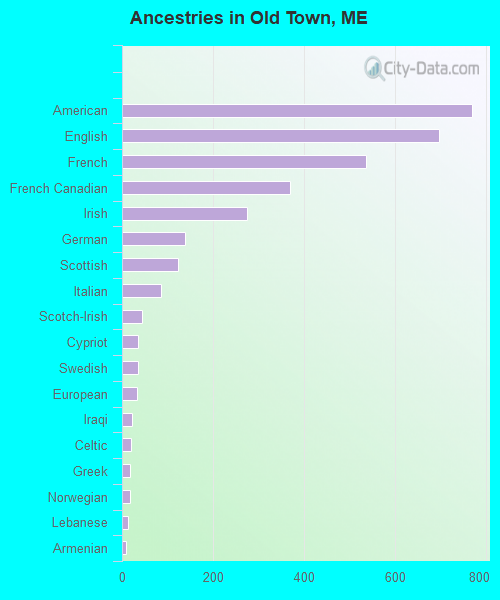
First ancestries reported:
- American: 769 (20.9%)
- English: 698 (18.9%)
- French: 536 (14.5%)
- French Canadian: 369 (10.0%)
- Irish: 275 (7.5%)
- German: 138 (3.7%)
- Scottish: 124 (3.4%)
- Italian: 85 (2.3%)
- Scotch-Irish: 45 (1.2%)
- Cypriot: 36 (1.0%)
- Swedish: 36 (1.0%)
- European: 32 (0.9%)
- Iraqi: 22 (0.6%)
- Celtic: 19 (0.5%)
- Greek: 17 (0.5%)
- Norwegian: 17 (0.5%)
- Lebanese: 14 (0.4%)
- Armenian: 9 (0.2%)
- British: 4 (0.1%)
- Dutch: 4 (0.1%)
- Polish: 4 (0.1%)
Most common places of birth for foreign-born residents (%):
| Old Town: | 23.8% (34) |
| Maine: | 18.9% (9,810) |
| Old Town: | 23.1% (33) |
| Maine: | 0.1% (30) |
| Old Town: | 17.5% (25) |
| Maine: | 0.6% (306) |
| Old Town: | 14.7% (21) |
| Maine: | 1.7% (865) |
| Old Town: | 13.3% (19) |
| Maine: | 1.2% (612) |
| Old Town: | 4.2% (6) |
| Maine: | 4.6% (2,392) |
| Old Town: | 2.8% (4) |
| Maine: | 0.7% (371) |
Place of birth for U.S.-born residents:
- This state: 5,276
- Other state: 2,027
- Northeast: 1,556
- Midwest: 41
- South: 313
- West: 151
83.0% of Old Town residents lived in the same house 1 years ago.
Out of people who lived in different houses, 38.7% lived in this county.
Out of people who lived in different counties, 56.0% lived in Maine.
| Old Town: | 83.0% |
| State average: | 89.7% |
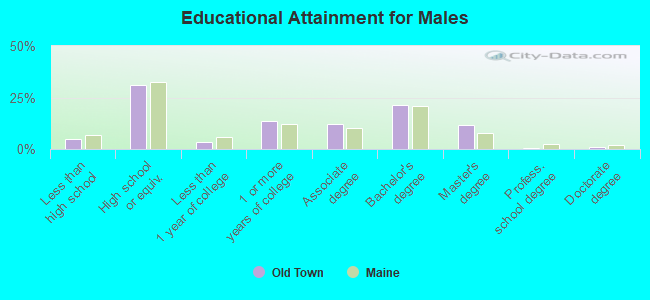
Education attainment for males 25 years and older:
- No schooling: 28
- Nursery to 4th grade: 0
- 5th and 6th grade: 25
- 7th and 8th grade: 12
- 9th grade: 11
- 10th grade: 0
- 11th grade: 44
- 12th grade, no diploma: 5
- High school graduate (or equivalency): 793
- Less than 1 year of college: 91
- Some college more than 1 year, no degree: 354
- Associate degree: 317
- Bachelor's degree: 545
- Master's degree: 300
- Professional school degree: 14
- Doctorate degree: 25
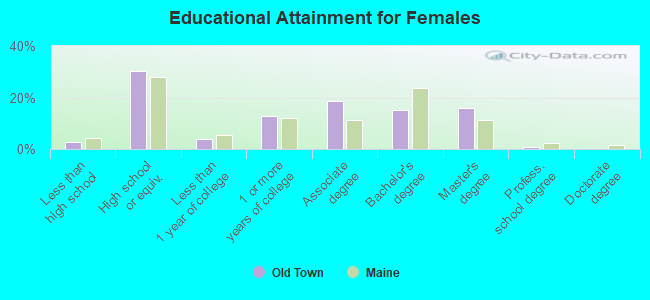
Education attainment for females 25 years and older:
- No schooling: 0
- Nursery to 4th grade: 0
- 5th and 6th grade: 3
- 7th and 8th grade: 16
- 9th grade: 17
- 10th grade: 0
- 11th grade: 25
- 12th grade, no diploma: 16
- High school graduate (or equivalency): 813
- Less than 1 year of college: 108
- Some college more than 1 year, no degree: 342
- Associate degree: 501
- Bachelor's degree: 412
- Master's degree: 426
- Professional school degree: 21
- Doctorate degree: 0
Housing units in structures:
- One, detached: 2,103
- One, attached: 17
- Two: 453
- 3 or 4: 532
- 5 to 9: 217
- 10 to 19: 121
- 20 to 49: 8
- 50 or more: 32
- Mobile homes: 276
Housing units lacking complete kitchen facilities in 2022: 0.4%
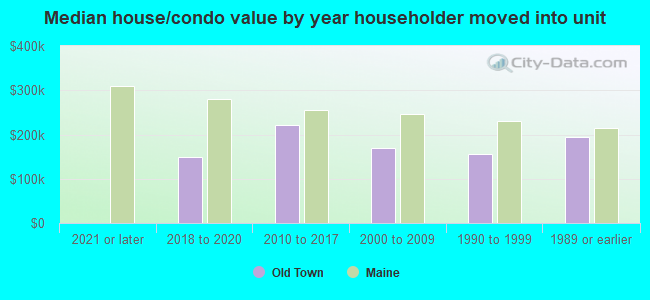
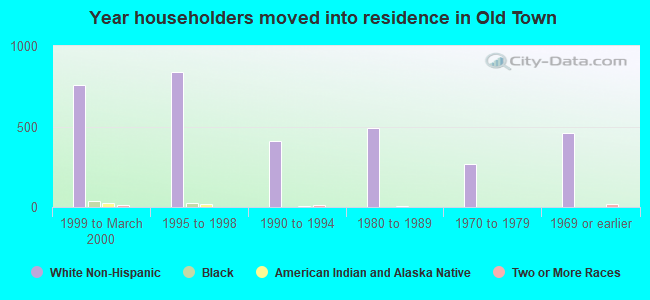
House/condo owner moved in on average 14 years ago
Renter moved in on average 3 years ago
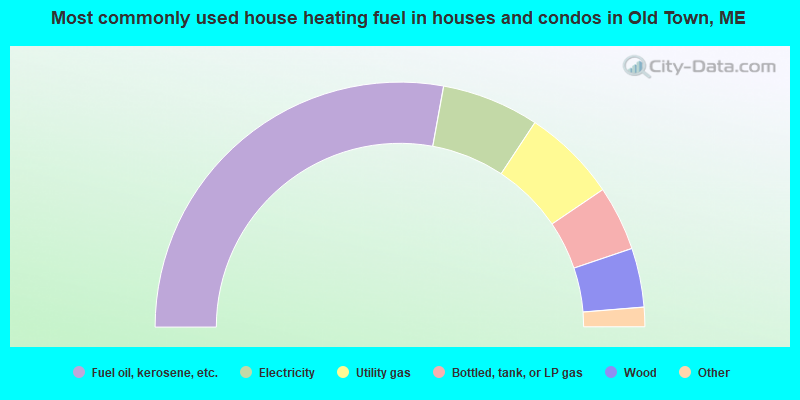
- 55.9%Fuel oil, kerosene, etc.
- 12.9%Electricity
- 12.5%Utility gas
- 8.6%Bottled, tank, or LP gas
- 7.8%Wood
- 1.4%Other fuel
- 1.1%Solar energy
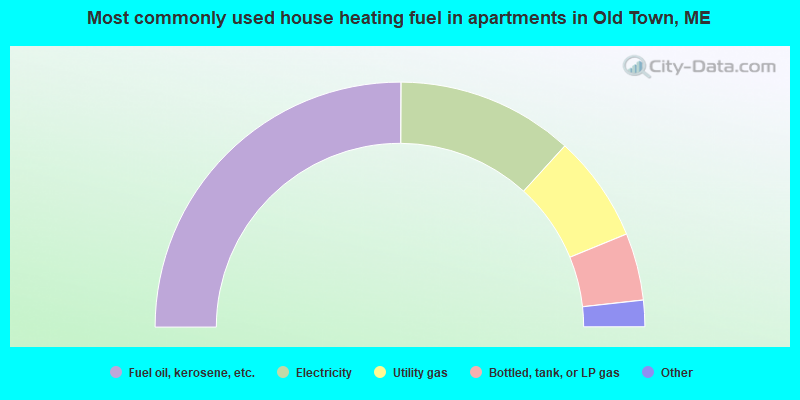
- 50.2%Fuel oil, kerosene, etc.
- 23.4%Electricity
- 14.1%Utility gas
- 8.9%Bottled, tank, or LP gas
- 1.9%Wood
- 1.5%Other fuel
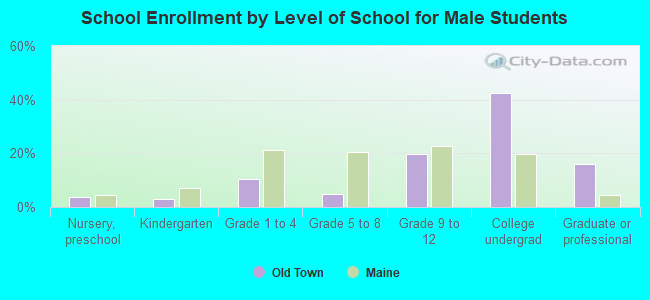
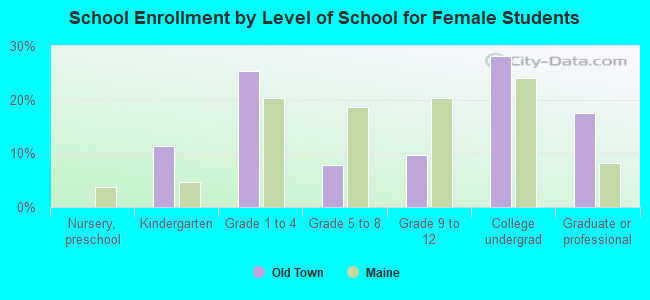
Private vs. public school enrollment:
| Here: | 0.0% |
| Maine: | 12.7% |
| Here: | 8.3% |
| Maine: | 12.6% |
| Here: | 28.0% |
| Maine: | 34.5% |