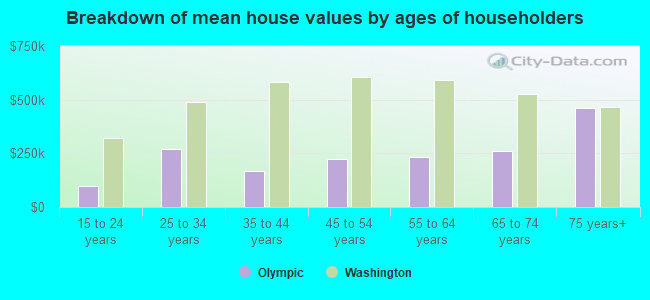
Median price asked for vacant for-sale houses and condos in 2022 in this county: $354,348.
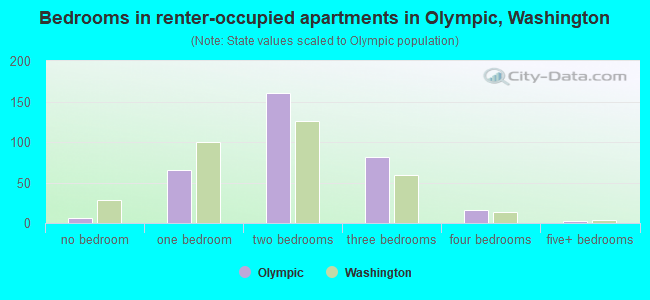
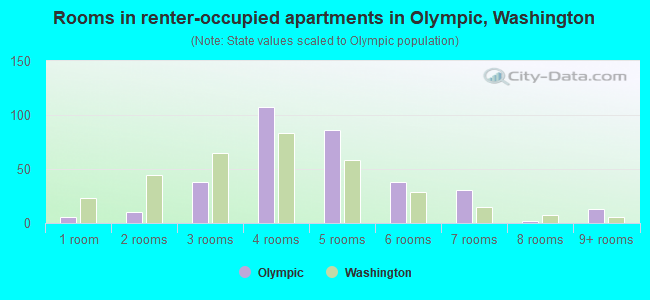
Median contract rent in 2022: $867 (lower quartile is $549, upper quartile is $1,055)
Median rent asked for vacant for-rent units in 2022: $972
Median gross rent in Olympic, WA in 2022: $1,056
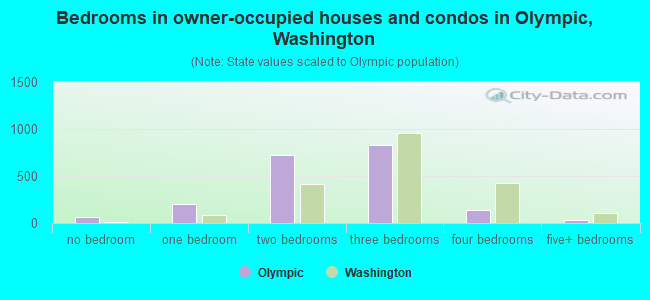
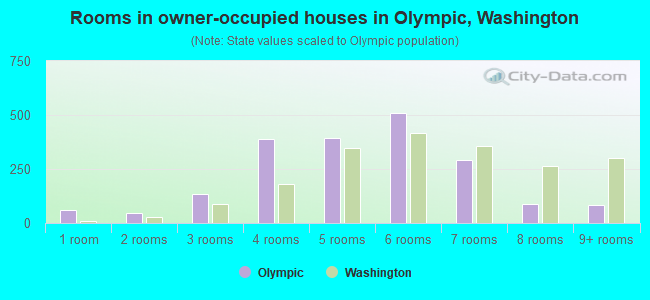
Housing units in Olympic with a mortgage: 637 (49 second mortgage, 74 home equity loan, 0 both second mortgage and home equity loan) Houses without a mortgage: 474
In family households: 48,388 (11,586 male householders, 4,471 female householders)
12,503 spouses, 14,110 children (12,515 natural, 530 adopted, 1,065 stepchildren), 1,265 grandchildren, 512 brothers or sisters, 471 parents, foster children, 813 other relatives, 2,236 non-relatives
In nonfamily households: 9,979 (4,050 male householders (3,015 living alone)), 3,725 female householders (3,021 living alone)), 2,204 nonrelatives
In group quarters: 2,332 (2,208 institutionalized population)
7,246 married couples with children.
2,944 single-parent households (887 men, 2,057 women).
95.5% of residents of Olympic speak English at home.
1.6% of residents speak Spanish at home (92% speak English very well, 8% speak English not well).
1.7% of residents speak other Indo-European language at home (89% speak English very well, 11% speak English well).
1.1% of residents speak Asian or Pacific Island language at home (82% speak English very well, 18% speak English well).
Foreign born population: 341 (4.5%)
(39.6% of them are naturalized citizens)
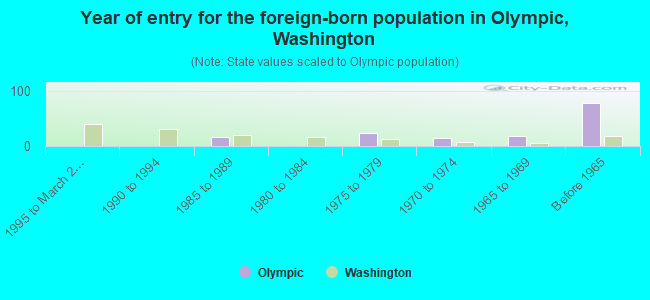
Year of entry for the foreign-born population in Olympic, Washington
01995 to March 2000
01990 to 1994
171985 to 1989
01980 to 1984
241975 to 1979
151970 to 1974
191965 to 1969
78Before 1965
Most common places of birth for foreign-born residents (%):
Canada
Olympic:
31.4% (48)
Washington:
7.7% (47,568)
Mexico
Olympic:
12.4% (19)
Washington:
24.1% (148,115)
United Kingdom
Olympic:
9.8% (15)
Washington:
3.3% (20,321)
Netherlands
Olympic:
9.8% (15)
Washington:
0.6% (3,795)
Polynesia
Olympic:
7.8% (12)
Washington:
0.3% (1,748)
Korea
Olympic:
7.2% (11)
Washington:
6.2% (38,172)
Japan
Olympic:
6.5% (10)
Washington:
2.8% (16,936)
Panama
Olympic:
5.9% (9)
Washington:
0.3% (1,548)
Germany
Olympic:
5.2% (8)
Washington:
3.4% (21,167)
Thailand
Olympic:
3.9% (6)
Washington:
1.0% (6,294)
Place of birth for U.S.-born residents:
This state: 3,032
Other state: 2,224
Northeast: 163
Midwest: 679
South: 306
West: 1,076
56% of Olympic residents lived in the same house 5 years ago. Out of people who lived in different houses, 35% lived in this county. Out of people who lived in different counties, 84% lived in Washington.
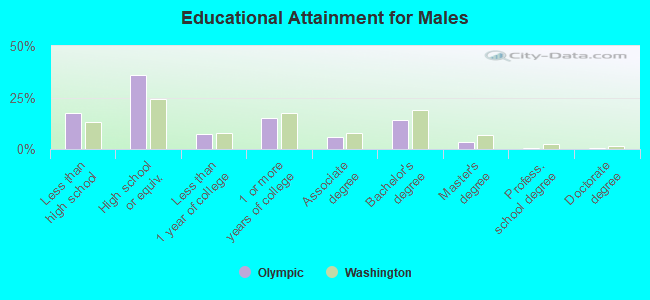
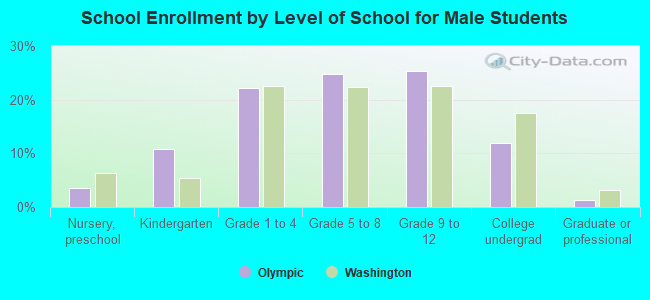
Education attainment for males 25 years and older:
No schooling: 5
Nursery to 4th grade: 5
5th and 6th grade: 9
7th and 8th grade: 46
9th grade: 26
10th grade: 101
11th grade: 81
12th grade, no diploma: 74
High school graduate (or equivalency): 713
Less than 1 year of college: 143
Some college more than 1 year, no degree: 299
Associate degree: 118
Bachelor's degree: 275
Master's degree: 70
Professional school degree: 11
Doctorate degree: 8
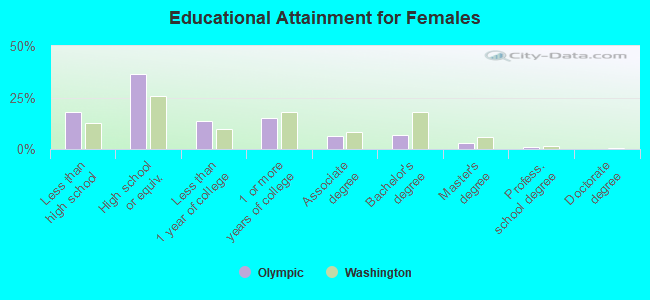
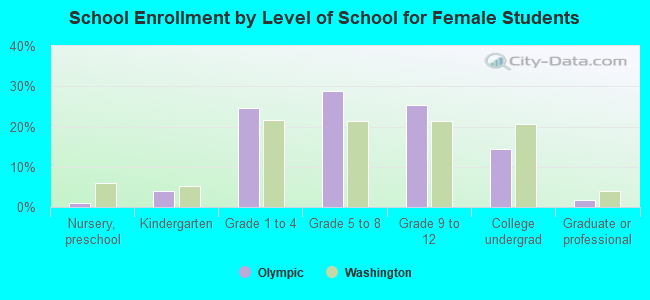
Education attainment for females 25 years and older:
No schooling: 0
Nursery to 4th grade: 7
5th and 6th grade: 7
7th and 8th grade: 24
9th grade: 28
10th grade: 96
11th grade: 84
12th grade, no diploma: 114
High school graduate (or equivalency): 730
Less than 1 year of college: 269
Some college more than 1 year, no degree: 306
Associate degree: 128
Bachelor's degree: 135
Master's degree: 61
Professional school degree: 18
Doctorate degree: 0
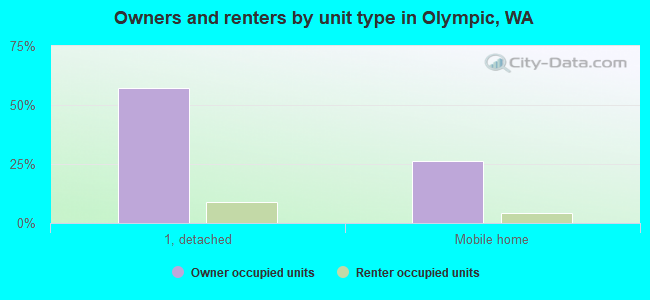
Housing units in structures:
One, detached: 2,796
One, attached: 13
Two: 21
3 or 4: 4
Mobile homes: 1,010
Boats, RVs, vans, etc.: 437
Median worth of mobile homes: $140,635
Housing units lacking complete plumbing facilities: 9.4%
Housing units lacking complete kitchen facilities: 8.9%